J. JSCE, Ser. D3 (Infrastructure Planning and Management), Vol.70, No.5, Special Issue, I_535-I_548, 2014.
SCHEDULING PREFERENCE MODELING OF RAIL PASSENGERS IN THE TOKYO METROPOLITAN AREA AND EVALUATION OF TIME-VARYING FARE POLICY FOR A CONGESTED URBAN RAILWAY LINE Chaoda XIE1 and Daisuke FUKUDA2 1
Non-Member of JSCE, Transportation Modeling Department, Beijing Transportation Research Center (Liuliqiao Road 9, Fengtai District, 100073 Beijing, P.R. China) E-mail:
[email protected] 2 Member of JSCE, Associate Professor, Department of Civil Engineering, Tokyo Institute of Technology (Ookayama 2-12-1-M1-11, Meguro-ku, 152-8552 Tokyo, Japan) E-mail:
[email protected]
Given the limitations of new urban railway construction in the Tokyo metropolitan area, a time-varying fare policy is expected to be one of the most effective measures to spread the concentrated peak demand. This paper presents an empirical study that examined the theoretical time-varying marginal utility model introduced by Vickrey (1973), using data on urban rail commuters in Tokyo. Then, the departure-time-choice model, under deterministic user equilibrium, was proposed by integration with the empirically identified time-varying marginal utility model. The outputs of the equilibrium model were compared with the results from the traditional constant marginal utility model; our results indicated that the former outputs would be more suitable for a commuting pattern with longer travel distance, similar to the Tokyo case. The equilibrium scheduling pattern and the first-best pricing strategy were examined; our study showed that the time-varying marginal utility model was capable of capturing the marginal external cost more precisely for travelers with a relatively flexible arrival time. Key Words : departure time choice, first-best congestion pricing, time-varying marginal utility of time, urban railway, user equilibrium
1. INTRODUCTION In the Tokyo metropolitan area, the scale of the expansion of railway facilities and/or trains to increase capacity is currently limited due to financial, spatial, and environmental constraints. Achieving the target of reducing the overall average peak congestion rate (the ratio of the number of onboard passengers to the capacity of the train carriage) to 150% by year 2015, as shown in the master plan of Tokyo’s urban rail network, remains a challenging task. Under these circumstances, soft measures, including congestion pricing, shifts in the official work start time, and flexible working hours, may offer a more plausible way to alleviate the congestion. Integrated-circuit (IC) card technology for automatic fare collection has recently become quite popular and is noteworthy for alleviating congestion by facilitating time-dependent fare policy in the real world.
Some railway companies in the Tokyo metropolitan area have already begun to offer non-cash gifts (i.e., shopping coupons) to train passengers who enter the fare gates early to avoid peak periods, possibly leading commuters to choose departure times outside of peak hours. In other cities such as London and Singapore, fare discount has been introduced for the same purpose of spreading the peak. To evaluate these strategies, it is necessary to understand how passengers interact with one another as a result of these changes. A travel demand model that precisely describes rail passengers’ scheduling decision behavior is crucial for such a research agenda. The departure time for passenger’s daily morning commute is primarily affected by the time at which they prefer to arrive at their destinations. To evaluate the economic benefits of various measures, it is necessary to understand the scheduling preference of commuters and then derive the aggregate scheduling pat-
I_535
tern when passengers are interacting in a congested rail network. In contrast to previous studies, on road traffic, such as Arnott et al. 1),2) , time-dependent congestion pricing would be the ideal way to eliminate the bottleneck queue. However, the externality in a transit network usually contains in-vehicle congestion cost, as well as travel time cost. Therefore, it is necessary to examine how to price the externality of congestion to facilitate a peak-spreading policy for urban rail commuters. With this background, the objective of this study was first to provide estimates of a scheduling model using actual travel survey data collected for the Tokyo metropolitan area. A time-varying marginal utility model was used to describe the scheduling behavior, which is believed to be more general than the timeconstant marginal utility of time (MUT) model. Second, we developed a departure-time choice model for a congested rail network with equilibrium conditions by integrating the estimated time-varying scheduling cost. We then derived the first-best dynamic pricing strategy for the congested railway network.
2. OVERVIEW OF TRIP SCHEDULING MODELS (1) Constant marginal utility model Much of the literature has been devoted to describing the relationship between scheduling and the MUT. Consider a utility u(tD , a) generated by a scheduled trip that has a positive utility rate at departure time tD and a negative utility rate at arrival time a. One of the special cases under this framework, and maybe the one most widely used, is the so-called “α − β − γ” preference or “step model”, first introduced by Vickrey 3) , further developed by Arnott et al. 2) , and empirically studied by Small 4) and Small et al. 5) . In the step model, a commuter chooses to arrive at a preferred arrival time (PAT) a∗ , and is subjected to a scheduling cost at a rate of β per minute for early arrival or γ per minute for late arrival, with the travel time per se valued at a rate of α. The signs of these parameters are assumed to be positive. In this case, the total utility is composed of three terms as formulated in Eq. (1), that is, the utilities of travel time, schedule delay early (SDE), and schedule delay late (SDL), with corresponding marginal utilities α,β , and γ, respectively, u(tD , a) = − α(a − tD ) + β min(0, a − a∗ ) (1) − γ max(0, a − a∗ ).
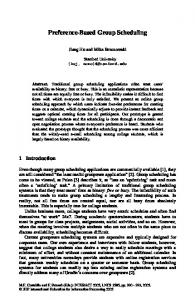
cently provided by Tseng and Verhoef 7) , Fosgerau and Engelson 8) and B¨orjesson et al. 9) . From the traveler’s point of view, the scheduling preference can be described by time-varying marginal utilities for the time amounts spent both at home and in the workplace. Fosgerau and Engelson 8) considered a traveler who departed from the origin at time tD and arrived at the destination at time a within time interval [h, w] and with travel time T ≡ a − tD . Let two linear functions, H(t) and W(t), represent the MUT spent at home and at work at clock time t, respectively, which means that the trip scheduling preference is connected to the activities before time tD at home and after time a in the workplace. Fig. 1 illustrates the trade-off relationship between these two utilities. If these marginal utilities are linear in t as H(t) = β0 + β1 t and W(t) = γ0 + γ1 t, respectively, then the total utility gained within the time interval [h, w] can be represented as ! tD ! w (β0 + β1 s)ds + (γ0 + γ1 s)ds, u(h, tD , a, w) = a
h
where we assume that β1 < 0 < γ1 . Further assume that the travel time is reduced to zero and that the traveler would depart and arrive at time t∗ . Then he/she would incur the maximal total utility, defined as follows: ! t∗ ! w (β0 + β1 s)ds + (γ0 + γ1 s)ds. u(h, tD , a, w)max ≡ t∗
h
The total travel cost can therefore be defined as the difference between umax and u, that is: ! t∗ ! a c(tD , a) = (β0 + β1 s)ds + (γ0 + γ1 s)ds, (2) t∗
tD
in which h and w cancel out. As shown in Fig. 1, we define u0 as the utility level when H(t∗ ) = W(t∗ ), analytically derived as γ0 − β0 u0 = H(t∗ ) = W(t∗ ) = β0 + β1 . β1 − γ1 The travel time is then incorporated into the scheduling cost. For a given travel time T , the optimal travel
(2) Time-varying marginal utility model The more general case under the same framework of scheduled trip utility, proposed by Vickrey 6) , is called the “time-varying preference” or “slope model.” Deeper insight into the slope model was re-
I_536
Travel Time
tD
Fig.1 Time-varying marginal utility model.
cost c(t∗D ) is decided by the departure time tD . By solving the two integrands in Eq. (2) and substituting the value of u0 into it, the total cost with travel time T can be analytically derived as follows: β1 u0 + β0 T + tD T. (3) c(tD , T ) = 2 2 The first-order condition of minimizing the travel cost defined by Eq. (2) for a given travel time T gives the optimal departure time t∗D as γ0 − β0 + γ1 T t∗D = . (4) β1 − γ1 By substituting Eq. (4) into Eq. (3), we obtain the minimal total cost as a function of travel time T : β1 γ1 β1 γ0 − β0 γ1 T2 + T. c∗ (T ) = 2(β1 − γ1 ) β1 − γ1 This result indicates that the travel time is an endogenous variable in the slope-based departure choice model. Travelers with different travel times would have different optimal travel costs, which further leads to different optimal departure and arrival times. This property is significantly different from step models. (3) Relationship between the step model and slope model The travel cost that is defined as Eq. (2) can also be derived in another way. Indeed, it can be obtained from the sum of the utility at home and the utility difference generated in the workplace and at home. As such, Eq. (2) can be rewritten as ! a ! a H(t)dt + [W(t) − H(t)]dt. c(tD , a) = t∗
tD
Instead of deciding the optimal arrival time endogenously with the utilities generated before and after the trip, one could consider an exogenously given PAT for a specific traveler. The travel time is further assumed to be zero. In this case the traveler prefers to arrive at the workplace as soon as his/her trip starts. Thus, this PAT should be the same as the aforementioned time t∗ , as illustrated in Fig. 2. If the traveler arrives before or after t∗ , then he/she would incur scheduling costs. Under these circumstances, the total cost with the exogenously given PAT t∗ is represented as ⎧ & t∗ ! a ⎪ ⎪ ⎨ &a [H(t) − W(t)]dt, (a < t∗ ) c(tD , a) = H(t)dt+⎪ ⎪ a [W(t) − H(t)]dt, (a ≥ t∗ ). ⎩ tD
t∗
If we assume that H(t) (the MUT at home and during the trip) is constant and equal to α and that W(t) (MUT at the workplace) is lower than H(t) by the amount β before t∗ and greater than H(t) by the amount γ after t∗ , then we have H(t) = α, ' α − β, (a < t∗ ) W(t) = α + γ, (a ≥ t∗ ).
Fig.2 Connection between the step model and slope model.
The total cost could then rewritten as follows: ⎧ &be ! a t∗ ⎪ ⎪ ⎨ &a βdt, (a < t∗ ) αdt + ⎪ c(tD , a) = (5) ⎪ ⎩ ∗a γdt, (a ≥ t∗ ). tD t
When the PAT is exogenous, the formulation of Eq. (5) can be converted into Eq. (1), which shows that the step model is a special case of the slope model.
(4) Application to railway passengers’ departure time choice Even though railway commuter’s departure time choice has been studied by several researchers, they all assumed that the trip scheduling cost followed the step model framework. For example, Kobayashi et al. 10) and Okumura et al. 11) studied market interaction between commuters and railway operators and also discussed policy effects on social welfare. They assumed that the commuters arrived no later than an exogenously given work start time and that scheduling cost only included a time-constant schedule delay early. Ieda et al. 12) modeled the scheduling utility in a time-varying way, but again adopted an exogenously given PAT. Iwakura and Harada 13) conducted the simulation of peak-shifting policies with traveler’s stepbased scheduling utility. Tian et al. 14) analyzed the scheduling pattern of a many-to-one railway line by applying a deterministic user equilibrium model and integrating with step-based scheduling costs. Matsumura et al. 15) assessed the step model with structural estimation by assuming that the congestion rate index in the cost function was endogenous. The purpose of this study, the first attempt at providing an empirical estimation of the time-varying scheduling model through actual travel survey data, was to investigate whether time-varying scheduling preferences can be identified and whether they were well suited to rail commuters. Based on the estimation results, the features of the two scheduling models (step and slope) were discussed. From this, a new equilibrium departure pattern model was de-
I_537
veloped for urban rail passengers by extending the work of Tian et al. 14) , further integrating the timevarying scheduling cost. Simulations were carried out to examine the scheduling pattern and first-best timevarying congestion pricing strategies along a manyto-one commuting railway line.
3. ESTIMATING SCHEDULING PREFERENCES OF RAIL PASSENGERS IN THE TOKYO METROPOLITAN AREA (1) Description of the data The data used in this study were obtained from the latest Metropolitan Transportation Census (Dai-toshikotsu-census) for Tokyo, conducted in 2010. The sample for empirical analysis consisted of 7006 railway commuters, a subsample of the census. The basic statistics of the explanatory variables are listed in Table 1, and their sample distributions can be found in Figs.3, 4, 5, 6 and 7. In particular, we learned that the average travel time is over 40 minutes; hence, it is worth investigating the impact of relatively longer travel times on scheduling preferences. As for the schedule delay, we assumed PAT as the official work start time. Most commuters choose to arrive 10 to 20 minutes before their official work start time, which implies that the official work start time may not be the actual PAT. We will investigate these phenomena in the following sections. The clock time in the following simulation was converted into decimal time to simplify the computations.
(2) Econometric model We applied the discrete choice model to estimate the scheduling model parameters. Error terms were added to the total cost functions examined in the previous section and were assumed to follow the Type I generalized extreme value (EV) distributions, leading to a multinomial logit model. The sample we chose for the estimation contained only those passengers who used a commuter pass (or monthly ticket). In this case, we assumed that the passenger’s decision about departure time was made based on their daily knowledge of the congestion level and train diagrams, as well as the total travel time involved in their daily commute. Thus, this departure time was more likely to be the preferred departure time. Regarding the definition of choice sets, the peak hours between 7:08 and 9:52 were divided into 11 intervals of 15 minutes each, and these times are regarded as the universal choice set for all passengers who depart within this period of time. We intended to compare specifications of the slope and step models in the empirical analysis. In the slope model, the preferred departure time is defined as the optimal departure time t∗D . Thus, for the slope model,
Fig.4 Arrival time of day (in clock time).
Fig.3 Onboard time of day (in clock time). Fig.5 Total travel time (in minutes).
Table1 Basic statistics of the sample for the estimation.
Average Max/Latest Min/Earliest Standard deviation
Official work start time
Onboard time
Arrival time
Travel time
9:04 20:30 0:00 48 (min.)
8:03 9:52 7:08 35 (min.)
8:43 12:40 7:00 35 (min.)
40 (min.) 219 (min.) 3 (min.) 20 (min.)
I_538
2
Fig.6 Official work start time of day (in clock time).
Fig.7 Schedule delay (in minutes, negative numbers for earlier arrival than PAT).
we assumed that the reference trip (reported in the census) was the respondent’s optimal choice. We assumed an exogenous PAT for each passenger for the step model, as mentioned in 3. (1). In a congested train, in-vehicle congestion costs would also occupy a portion of the total cost. Hence, we introduced the congestion rate index (CRI) as one of the explanatory variables in the total cost function. For a specific individual, the CRI for a specific time interval is defined as: ( τi (cgi )2 , CRI = i
where cgi is the congestion rate of section i, and τi is the corresponding section journey time. The summation is over all possible sections i that belong to the trip. Although Matsumura et al. 15) examined the endogeneity of congestion, the estimation method was relatively complex. Thus, CRI was assumed to be exogenous in our model. Also, the travel time was assumed to be the same for all possible departure times, and hence was omitted from the model specifications. a) Slope model Following the travel cost of Eq. (2), we solved for the integral and rewrote the utility of the trip with a fixed travel time T as a function of the departure time tD , CRI, and the error term ε as β1 u slope (tD , CRI, ε) = t2D − (γ0 − β0 )tD − γ0 T 2 γ1 (β0 − γ0 )2 − (tD + T )2 − + θCRI + ε, 2 2(γ1 − β1 ) where ε ∼ EV(0, µ) and µ represent the scale parameter and its value normalized to one. In the estimation,
(β0 −γ0 ) was omitted because it is common the term − 2(γ 1 −β1 ) across all alternatives. b) Step model For comparison, the random utility with the conventional α − β − γ preference is specified as u step (a, CRI, ε) = − αT + β min(0, a − a∗ ) − γ max(0, a − a∗ ) + θCRI + ε, where the arrival time a is given by td + T . c) Discrete choice model With these specifications, the choice probability of time interval i in choice set Cd can be modeled as the multinomial logit-type choice probability: eµVi , P(i|Cd ) = ) µV j j∈Cd e where Vi represents the systematic utility of departure time interval i or the observable part of the utility. The systematic utility of the slope model is defined as follows: β1 − γ1 2 tD − γ1 tD T − (γ0 − β0 )tD + θCRI. V slope = 2 Likewise, the systematic utility of the step model is given as V step = β min(0, a − a∗ ) − γ max(0, a − a∗ ) + θCRI.
(3) Estimation results and discussions The comparison of the maximum likelihood estimation results for the step and the slope models is summarized in Table 2. Even though the property of independence irrelevant alternatives is not thoroughly ensured under the setting of dividing the departure time alternatives with a 15-minute interval for each, we followed Ieda et al. 12) , Iwakura and Harada 13) , and Matsumura et al. 15) in the use of the multinomial logit model. All estimates have the intuitive signs, with the exception of CRI, in the group of work start times between 8 and 9 AM. The segmentation by arrival times provides a relatively reasonable sample for the slope model because the ideal departure/arrival times are endogenously decided by the MUT. If the duration of the traveler’s arrival time is long, it is more likely to contain heterogeneous ideal arrival times across travelers. In this case, a single segment of the sample will result in lower t-statistics and goodness of fit. In our segmentation, the official work start time was not used even though it was available in our dataset. Thus, the slope model should provide a plausible approach for estimating scheduling preference when the PAT or the official work start time is not available. We also segmented the sample by official work start times. This segmentation was based on the assumption that individuals who have the same/similar official work start time are more likely to have homogeneous ideal arrival times. Similar to the segmentation
I_539
Table2 Comparison of the estimation results of the step and slope models. Arrival time 8 AM - 9 AM Parameters β (/hr) γ (/hr) θ (/hr·%2 ) γ0 − β0 (/hr) β1 − γ1 (/hr2 ) γ1 (/hr2 ) θ (/hr·%2 ) (Summary statistics) No. of parameters No. of observations Initial log-likelihood Final log-likelihood ρ2 Adjusted ρ2
Step Value (t-test) 1.510(25.75) 14.100(29.10) -0.535(-6.74)
3 4657 -11167.0 -6904.1 0.382 0.381
Slope Value (t-test)
-95.600(-41.72) -11.200(-41.33) 11.700(37.87) 0.246(2.63)
Work start time 9 AM Step Value (t-test) 1.500(20.00) 6.230(28.22) -0.526(-5.97)
4 4657 -11167.0 -6963.5 0.376 0.376
3 2694 -6459.9 -4667.5 0.277 0.277
by the arrival time, this segmentation approach should provide a relatively fair comparison of the two models. If the slope model is applied without any segmentation, it assumes the same ideal departure/arrival time across all individuals, which would be the average time of the sample rather than the individual ideal departure/arrival times. This phenomenon was verified by comparing the t-statistics and the adjusted rho-square values among the group of all individuals, the group of arrival time between 8 and 9 AM and the group whose work start time was 9 AM. By checking the magnitude of γ1 in each segmentation of different work start times, we observed that later official work start times would cause the magnitude of γ1 to decrease. This indicates an increase in the flexibility of the arrival time when the official work start time is late. Such changes in the MUT at the workplace cannot be captured by the step model. The PAT in the step model is exogenous; thus, PAT does not relate to the travel time or MUT. Furthermore, in the estimation of the step model, the PAT is assumed to be identical to the official work start time, which means that the travelers would like to arrive at the official work start time to minimize their scheduling cost. However, the concept of PAT in actual scheduling decisions may be ambiguous. Following our intuition, passengers may prefer to arrive several minutes before the official work start time to prepare for their workday. In this case, the utility during the PAT and the official work start time would begin to rise. Thus, the assumption of the official work start time as PAT may not hold. In the slope model, on the other hand, PAT is endogenously decided by the MUT and individual travel time. For the given marginal utilities and travel time, the optimal arrival time, the corresponding departure time, and the ideal arrival time are determined simul-
Slope Value (t-test)
-55.400(-30.77) -6.450(-30.58) 5.760(23.15) -0.315(-3.28) 4 2694 -6459.9 -4722.1 0.269 0.268
All individuals Step Value (t-test) 1.240(32.45) 6.800(46.27) 0.008(0.18)
3 7006 -16799.7 -12045.0 0.283 0.283
Slope Value (t-test)
-14.60(-26.53) -1.710(-26.42) 1.940(23.00) 0.100(2.28) 4 7006 -16799.7 -14911.8 0.112 0.112
taneously. The ambiguity of PAT is thus avoided. Therefore, the slope model would be able to well describe the scheduling preference of travelers when PAT is hard to identify. In terms of the goodness of fit, the step model performed slightly better than the slope model. This means that scheduling preferences may, to some extent, be described by the step model, where the MUT at the workplace is not continuous near the PAT. Because the flex-time system has not been widely introduced in Japan, their marginal utility tends to increase discretely to higher values after the PAT, as long as travelers prefer to arrive at the official work start time. However, we observed strong t-statistics for the estimates of the slope model, implying that the timevarying marginal utility would also exist. The travelers with time-varying scheduling preferences may work under a flex-time system or they may prefer to arrive at some time before the official work start time; in either circumstance, they have relatively flexible arrival times. Their MUT at the workplaces is, thus, more reasonably assumed to increase continuously near their PAT. The relatively low goodness of fit of the slope model may be caused by the heterogeneity in step-type and slope-type scheduling preferences. An equilibrium model incorporating the slope model as travelers scheduling preference would thus be necessary for the evaluation, if congestion pricing policy is appropriately applied. The aforementioned scheduling preference of piecewise marginal utility at the workplace, as well as the discrete lateness penalty, are not incorporated into the slope model. It is important to note that neither the step model nor the slope model can be treated as a universal model for scheduling preferences, although the slope model is mathematically more general.
I_540
4. MODELING PASSENGERS’ DEPARTURE PATTERN UNDER NETWORK EQUILIBRIUM CONDITIONS Although researchers have already paid much attention to departure time choice under equilibrium conditions, most have assumed that the scheduling cost can be described simply by the time-constant MUT, that is, the step model. Given the estimation results presented in the last section, the scheduling preference with a time-varying marginal utility is not likely to be ignored. The objective of this section is to extend the model of departure time choice under deterministic network equilibrium by integrating the time-varying scheduling cost of travelers. The model can be applied to provide theoretical and quantitative support for evaluating more appropriate peak-shifting policies. (1) Passenger behavior in congestion We follow the fundamental modeling framework of Tian et al. 14) , but extend their work by incorporating passengers’ slope model-based scheduling preferences. The temporally distributed trains can be treated in a similar manner as the spatially distributed road links. Instead of routes, however, passengers instead choose the train that minimizes their total travel cost. Given the monocentric feature of the Tokyo metropolitan area, we only considered a single direction, a many-to-one railway line from suburban stations to the single city center, as shown in Fig. 8. We assumed a set of trains that covered the entire morning peak: Z = {1, 2, . . . , j, . . . , J}. The departure stations are denoted by O = {1, 2, . . . , r, . . . , R}. The section start from each station to the following station is denoted as the same number of the starting station by I = {1, 2, 3, . . . , i, . . . I}, where r = i, I = R. The number of passengers departing from station r taking train j is denoted by nrj , the total departure demand from station r is given by qr , and each section’s travel time is represented as τi . The total cost of passengers who depart from origin r taking train j is composed of the congestion cost C rj
and scheduling cost V rj :
TC rj = C rj + V rj , (6) where the congestion cost is given by the following: ⎛ i ⎞ R ( ⎜⎜⎜( ⎟⎟⎟ C rj = g j ⎜⎜⎜⎝ nmj ⎟⎟⎟⎠ τi , (7) 0 12
i=r
m=1
g j (n) = θ knj is the congestion cost function, with k j being the capacity of train j. The scheduling cost is given by γ1 β1 2 j + (γ0 − β0 ) j + γ0 T r , V rj = ( j + T r )2 − 2 2 where all parameter values are based on the estimation results of the previous section. Now, suppose that the equilibrium condition exists. In user equilibrium, no user can reduce cost by unilaterally changing his/her departure time. This situation can be mathematically represented by ' TC rj = TC r , if nrj > 0 j ∈ Z, r ∈ O TC rj ≥ TC r , if nrj = 0 j ∈ Z, r ∈ O. (2) Equivalent optimization problem Following the similar procedure presented by Beckmann et al. 16) , it is possible to formulate the equivalent optimization problem with the user equilibrium condition as follows: ⎛ i ⎞ J R R ( J ( ( ⎜⎜⎜( ⎟⎟⎟ ( Gi j ⎜⎜⎜⎝ nmj ⎟⎟⎟⎠ + nrj V rj , (8) min z (n) = i=1 j=1
m=1
j=1 r=1
subject to
J (
nrj = qr ,
j ∈ Z,
r ∈ O,
(9)
nrj ≥ 0,
j ∈ Z,
r ∈ O,
(10)
j=1
where ⎛ ⎞ ! i ⎜⎜⎜( ⎟⎟⎟ nmj ⎟⎟⎟⎠ = Gi j ⎜⎜⎜⎝ m=1
)i
m=1
0
nmj
g j (ω)τi dω,
γ1 β1 2 ( j + T r )2 − j + (γ0 − β0 ) j + γ0 T r . 2 2 The first term of the objective function (8) is the sum of the integral of the congestion cost. The second term corresponds to the scheduling cost of all passengers in the network. The constraints ensure that the total demand during the entire morning peak is assigned as in (9) and that the number of departing passengers is non-negative, as described in (10). This is a minimization problem with linear equality and non-negativity constraints. The first-order condition of the minimization program can be expressed by
Fig.8 Railway line with multiple origins and a single destination.
I_541
V rj =
⎛ R ⎛ i ⎞ ⎞ ⎜⎜⎜( ⎜⎜⎜( ⎟⎟⎟ ⎟⎟⎟ nrj ⎜⎜⎜⎝ g j ⎜⎜⎜⎝ nmj ⎟⎟⎟⎠ τi + V rj − λr ⎟⎟⎟⎠ = 0, m=1 i=l ⎛ i ⎞ R ( ⎜⎜⎜( ⎟⎟⎟ m ⎜ g j ⎜⎝⎜ n j ⎟⎟⎠⎟ τi + V rj − λr ≥ 0, i=r
m=1
J (
r
j ∈ Z, r ∈ O, j ∈ Z, r ∈ O,
nrj = qr ,
j ∈ Z, r ∈ O,
nrj ≥ 0,
j ∈ Z, r ∈ O.
j=1
Deviations from these conditions are detailed in APPENDIX A. These conditions imply that: (a) the passenger flow nrj from station r by train j is zero if the total cost of taking train j, denoted by TC rj , is greater than or equal to the origin-specific Lagrange multiplier λr ; and (b) the flow from station r is nonzero if TC rj = λ j . The Lagrange multiplier of a specific origin λr is less than or equal to the total cost of taking either train departing from station r. Therefore, λr is the equilibrated travel cost for station r, which implies that the first-order condition of this minimization problem is equivalent to the user equilibrium problem. Because the Hessian matrix of the objective function is block diagonal, which is always positive definite, the objective function is strictly convex. Therefore, the problem can be solved by the unique optimal solution. The proof of the convexity is given in APPENDIX B. For comparison, the slope preferences of scheduling cost can be replaced by that of the step model, which is specified as V step, j = β min(0, j − a∗ ) − γ max(0, j − a∗ ),
MC rj
Now, it is clear that the marginal external cost (MEC) of passengers taking train j from station r should be ∂TC rj . MEC rj = MC rj − TC rj = nrj ∂nrj If we charge the MEC precisely to each station and each train, then the objective function of equilibrium with pricing can be represented by ⎛ i ⎞ ⎛ R ⎞ J R ( J ⎜( ( ⎜⎜⎜⎜( m ⎟⎟⎟⎟ ( ⎜⎜⎜ ⎟⎟ r r ⎜⎜⎝ n j V j ⎟⎟⎟⎟⎠ , Hi j ⎜⎜⎝ n j ⎟⎟⎠ + min s (n) = i=1 j=1
where ⎛ i ⎞ ⎜⎜⎜( ⎟⎟⎟ ! Hi j ⎜⎜⎜⎝ nmj ⎟⎟⎟⎠ = m=1
J R ( ( r=1 j=1
=
J R ( ( r=1 j=1
nrj
R ( i=r
⎛ i ⎞ R J ( ( ⎜⎜⎜( ⎟⎟⎟ m ⎜ g j ⎜⎜⎝ n j ⎟⎟⎟⎠ τi + nrj V rj . m=1
j=1 r=1
The marginal cost can be derived by solving the partial derivative of TC with respect to nrj as:
m=1
0
nmj
r=1
2
3 ∂g j (ω)τi g j (ω)τi + ω dω, ∂ω (11)
m=1
m=1
m=1
Substituting Eq. (12) into the objective function equation (8), we get ⎛ i ⎞ R J R ( ( ( ⎜⎜⎜( ⎟⎟⎟ nij g j ⎜⎜⎜⎝ nmj ⎟⎟⎟⎠ τi min s (n) = i=r
i=1 j=1
+
J ( j=1
⎛ ⎜⎜⎜ ⎜⎜⎝
J ⎜( R ( j=1
subject to
nrj TC rj
)i
j=1
γ1 − β1 2 j − β1 + T r j + (γ0 − β0 ) j. 2 Thus, Eq. (11) can be rewritten as the following: ⎛ i ⎞ ⎛ i ⎞ ⎛ i ⎞ ⎜⎜⎜( ⎟⎟⎟ ⎜⎜⎜( ⎟⎟⎟ ⎜⎜⎜( ⎟⎟⎟ nmj ⎟⎟⎟⎠ = ⎜⎜⎜⎝ nmj ⎟⎟⎟⎠ g j ⎜⎜⎜⎝ nmj ⎟⎟⎟⎠ τi . (12) Hi j ⎜⎜⎜⎝
where is assumed to be the official work start time and V step, j is no longer a function of the origin r.
TC(nrj ) =
m=1
V rj =
a∗
(3) System optimal and first-best pricing From the analogy of road traffic assignment literature, the first-best congestion pricing can be derived from the difference between private and marginal costs. Recall that in Eq. (6), we defined the total travel cost of passengers departing from origin i taking train j as the sum of the corresponding congestion and scheduling costs. In this case, the total travel cost of the entire network is given by
∂TC j ∂TC r r = = TC + n . j j ∂nrj ∂nrj
nrj = qr ,
r=1
m=1
⎞ ⎟⎟⎟ nrj V rj ⎟⎟⎟⎠ ,
j ∈ Z,
(13)
r ∈ O,
j ∈ Z, r ∈ O. nrj ≥ 0, Thus, the objective function (13) minimizes the total cost of the entire network, which is identical to the system optimal problem. (4) Solution algorithm and simulation scenario We solved the above-mentioned constrained minimization problems using the optimization package SciPy, which is an integrated open-sourced package for Python. The sequential least squares programming (SLSQP) solver was applied to all of the optimizations. From the estimated results in the previous section, the estimates from the 9-AM work start-time segment was chosen for the simulation. A parameter summary and the scenario settings for the simulation are given in Table 3. In the monetized pricing strategy, we assumed a CRI value of 175.82 Yen/hr·%2 , estimated from 2010
I_542
Table3 Parameter and scenario settings for the simulation. Scheduling model β γ θ (/hr*%2 ) γ0 − β0 (/hr) β1 − γ1 (/hr2 ) γ1 (/hr2 ) θ (/hr*%2 ) No. of departing stations Headway (hr) Section travel time (hr) Train capacity Demand of each station
Step 1.500 6.230 -0.526
Slope
-55.400 -6.450 5.760 -0.315
6 0.05 0.1 1450 7000
Fig.9 Arrival pattern by the slope model.
census data from the Metropolitan Transportation Census of Tokyo. By dividing the value of CRI by θ (the parameter of CRI), we derived the marginal utility of the ticket fare. The total travel cost TC rj was then monetized by dividing by the marginal utility of the ticket fare. (5) Simulation results and discussion a) Base scenario Simulation results for the passengers’ arrival patterns from each station to the final destination station by both the step and slope models are illustrated in Fig. 9 and Fig. 10. The scheduling patterns of the slope model (Fig. 9) were more symmetrically distributed than those for the step model (Fig. 10) because the MUTs are time-varying, and travel time is endogenous in the slope model. The arrival pattern by the step model (Fig. 10) showed that the passengers from the most distant station occupied the largest number of trains. In the pattern of the slope model (Fig. 9), on the other hand, those who left from the midway stations (Stations 3 and 4) occupied the largest number of trains. Moreover, the train service for a particular station will not always correspond to the train with a maximum number of passengers from its immediate upstream stations, because the passengers who depart from closer (farther) than the aforementioned midway stations will shift their arrival time earlier (later) relative to the ideal arrival time, respectively. In particular, those who departed from stations farther away than the midway stations tended to shift their arrival time to a later time than those who departed from stations closer than the midway stations. For the same reasons, we observed that the train arriving at the ideal arrival time was not always chosen by all users along the railway line. According to the estimates presented in the last section, the individual whose official work start time is 9 AM ideally arrives at their workplace around 8:35
Fig.10 Arrival pattern by the step model.
Fig.11 Arrival pattern for the slope model when travel time is longer.
AM. From the results of the slope model, the peak arrival rate always corresponded to the ideal arrival time, whereas in the step model, it always appeared at the PAT. The peak arrival rate in the step model was also higher than that of the slope model because the step model assumed that travel time was exogenous. b) Scenario with longer travel time We also simulated a scenario where a section of the travel time was four times longer than the base scenario, keeping all other settings unchanged. Fig. 11 shows the arrival pattern for this longer travel time
I_543
Fig.12 First-best pricing for the slope model.
Fig.13 First-best pricing for the step model.
I_544
case. The variance in arrival time distribution increased due to the larger difference in travel time. The peak arrival rate decreased from 4000 to 2700. In particular, the passengers who departed from stations farther than the midway stations arrived significantly later than those who departed from closer stations. In the Tokyo metropolitan area, the variation in commuting time is fairly large; thus, the use of the slope model to capture the effects of travel distance on arrival pattern may be more suitable. Travel time does not change the scheduling cost of the step model; thus, only the slope model may be applied to longer travel time scenarios. c) First-best congestion pricing strategy With the MEC obtained by solving the system optimal problem, the demand patterns of the firstbest pricing for each station was derived for the two scheduling models, as shown in Fig. 12 and Fig. 13. The features can be interpreted in the following ways. First, the positively priced periods of each station were shorter in the step model than those in the slope model. Second, the maximum amount of pricing in the step model was higher than that in the slope model. Third, by observing the figures from Station 6 to Station 1, the maximum amount of pricing in the step model increased sharply with the travel distance, while in the slope model, the difference between stations was relatively small, although it still increased with travel distance. Fourth, the pattern of the entire pricing period was more symmetric in the slope model than in the step model. In the slope model, the maximum amount of positive pricing appeared in the middle of the pricing period, and the negative pricing period was distributed symmetrically on either side of the positive pricing period. These differences were mainly a result of the fact that the step model assumed that all passengers preferred to arrive at the destination at the same time, no matter how long they traveled. Under this assumption, the arrival time distribution in the step model was more concentrated than that for the slope model was, as shown in Fig. 9 and Fig. 10. Therefore, for a given travel demand, more concentrated, shorter congestion periods led to higher pricing for the most congested trains, but a shorter positively priced period. The arrival pattern of the slope model showed that travelers departing from the station farther than the midway stations tended to arrive later than those departing from a station closer than the midway stations, and that long-distance travelers with time-varying MUT preferences may not always choose the most congested trains. This behavior leads to lower MECs for long-distance travelers in the slope model, compared with those for the step model. The pricing for long-distance travelers in the slope model is thus lower than that in the step model. On the other hand,
the maximum arrival rate in the step model appeared at the PAT, and the arrival rate was symmetrically distributed around the PAT. The arrival rate decreased sharply after the PAT, both because travelers had the same PAT and because of the piecewise marginal utility function at workplaces. This arrival pattern delayed the positive pricing peak to the preferred departure time (PAT minus the respective travel time from each station). Because the peak arrival rate of the slope model appeared at the ideal arrival time, the peak of positive pricing appeared at the ideal arrival time minus the respective travel time from each station. Due to the spread and symmetric arrival rate of the slope model, prices were also distributed symmetrically about the peak departure times of each station. When the first-best pricing was applied, optimal system conditions were achieved. The arrival pattern and the congestion rate under the optimal conditions are shown in Fig. 14 and Fig. 15, respectively. The congestion rate for user equilibrium conditions is also illustrated in Fig. 16. Comparing the arrival patterns in Fig. 9 with those in Fig. 14 and the congestions rates in Fig. 16 with those in Fig. 15 between system optimum and user equilibrium, the arrival period increased from 45 to 63 minutes, and the maximum congestion rate decreased from approximately 280% to 220%, respectively. From Fig. 15 and Fig. 16, the departure period from each station had been extended by pricing, which resulted in a higher congestion rate at the end of each departure period, and also resulted in a lower congestion rate during the peak time compared with the case of user equilibrium. Thus, the effect of peak shifting was verified.
Fig.14 Arrival pattern under optimal system conditions with the slope model.
I_545
Fig.15 Congestion rate from each station to the next for slope-preference travelers under system optimal.
Fig.16 Congestion rate from each station to the next for slope-preference travelers under user equilibrium.
I_546
5. CONCLUSION AND FUTURE WORK
subject to
This study first provided empirical findings of the time-varying marginal utility model for rail passengers’ departure time choice by using passengers’ time-of-day choice data, which were compared with the conventional constant marginal utility model. The results revealed that that the time-varying preference is not likely to be ignored in the Tokyo metropolitan area. Second, the user equilibrium model in a congested urban rail corridor was developed by integrating this model with the time-varying marginal utility model. By comparing the equilibrium scheduling pattern with that from the optimal system formulation, the first-best pricing of commuter railways was derived. The following policy implications can be derived from this work if we apply the traditional stepbased pricing to the travelers with slope-type preferences: long-distance travelers would be charged more than their MEC; the maximum amount of pricing would be higher than the MEC; travelers who arrived before the arrival peak would be charged less than their MEC, and those who arrive after the arrival peak would be charged more than; and the time of the pricing peak would be delayed if the assumed PAT were later than the ideal arrival time. Work remains for further enhancement of the proposed model in light of this study. As for the slope model estimation results for the Tokyo metropolitan area, the slope model should be applied to another dataset or choice situations to check its validity. Also, it would be interesting to extend the equilibrium model to “heterogeneous” slope-type scheduling preferences to examine ideal arrival times and the marginal utility of time. Finally, given that the scheduling parameters were estimated with the multinomial logit model, it would be straightforward to enhance the network model by integrating it with stochastic user equilibrium models. ACKNOWLEDGMENTS: This study was supported by the Japan Society for the Promotion of Science, Grant-in-Aid for Scientific Research (B) #25289160.
APPENDIX A: EQUIVALENCE BETWEEN THE USER EQUILIBRIUM PROBLEM AND THE CONSTRAINED MINIMIZATION PROBLEM The minimization problem with linear equality and non-negativity constraints is given as follows: ⎛ i ⎞ J R R ( J ( ( ⎜⎜⎜( ⎟⎟⎟ ( m Gi j ⎜⎜⎜⎝ n j ⎟⎟⎟⎠ + nrj V rj , min z (n) = i=1 j=1
m=1
j=1 r=1
J (
nrj = qr ,
j ∈ Z,
r ∈ O,
nrj ≥ 0,
j ∈ Z,
r ∈ O,
j=1
where
⎛ i ⎞ ⎜⎜⎜( ⎟⎟⎟ ! Gi j ⎜⎜⎜⎝ nmj ⎟⎟⎟⎠ = m=1
)i
m=1
0
nmj
g j (ω)τi dω,
γ1 β1 2 ( j + T r )2 − j + (γ0 − β0 ) j + γ0 T r . 2 2 The Lagrangian of the equivalent minimization problem, with respect to the equality constraints, can be formulated as ⎛ ⎞ R R ⎜⎜⎜ ⎟⎟⎟ ( ( λr ⎜⎜⎜⎜⎝qr − nrj ⎟⎟⎟⎟⎠ , L(n, λ) = z(n) + V rj =
r=1
j=1
The Lagrangian L(f, λ) is minimized with respect to non-negative origin-destination (OD) flows, that is, nrj ≥ 0
∀ j ∈ Z, r = 1, 2, ..., R.
The first-order conditions of the Lagrangian are given below: ∂L(n, λ) = 0, nrj ∂nrj ∂L(n, λ) ≥ 0. ∂nrj These conditions can be obtained explicitly by calculating the partial derivatives of L(n, λ) with respect to OD flows nrj as ⎛ ⎞ R J ⎟⎟ ( ∂ ∂z(n) ∂ ( ⎜⎜⎜⎜⎜ ⎟⎟⎟ , l⎟ q L(n, λ) = + λ − n ⎜ r r ⎜ ⎟⎠ f l l l ⎝ ∂n f ∂n f ∂n f r=1 j=1 where
⎤ ⎡ ! )i m R J ⎥⎥⎥ m=1 n j ∂ ( ⎢⎢⎢⎢⎢( ∂z(n) ⎥⎥⎥ = g (ω)τ dω ⎢ j i ⎥⎦ ⎢ ∂nlf ∂nlf i=1 ⎣ j=1 0 ⎛ R ⎞ J ∂ ( ⎜⎜⎜⎜( r r ⎟⎟⎟⎟ ⎜⎜ n j V j ⎟⎟⎠ , + l ∂n f j=1 ⎝ r=1
The first term in ∂z(n) is explicitly given by ∂nlf ⎤ ⎡ ! )i m ⎛ i ⎞ R J R ⎥⎥⎥ ( ⎜⎜⎜( ⎟⎟⎟ m=1 n j ∂ ( ⎢⎢⎢⎢⎢( g j (ω)τi dω⎥⎥⎥⎥⎦ = g j ⎜⎜⎜⎝ nmf ⎟⎟⎟⎠ τi . ⎢⎢ ∂nlf i=1 ⎣ j=1 0 m=1 i=l
This becomes the congestion cost of a passenger’s departing from l by train f . is The second term in ∂z(n) ∂nlf ⎛ R ⎞ J ∂ ( ⎜⎜⎜⎜( r r ⎟⎟⎟⎟ ⎜⎜ n j V j ⎟⎠⎟ = V lf , ∂nlf j=1 ⎝ r=1
This becomes the scheduling cost of a passenger’s departing from l taking train f .
I_547
Because λr is not a function of passenger flow nrj , the partial derivative of the Lagrangian becomes ⎛ i ⎞ R ( ⎜⎜⎜( ⎟⎟⎟ ∂ m L(n, λ) = g j ⎜⎜⎜⎝ n f ⎟⎟⎟⎠ τi + V lf − λr . l ∂n f m=1 i=l
Thus, the first-order condition of the minimization program can be expressed by ⎛ R ⎛ i ⎞ ⎞ ⎜⎜⎜( ⎜⎜⎜( ⎟⎟⎟ ⎟⎟⎟ nmj ⎟⎟⎟⎠ τi + V rj − λr ⎟⎟⎟⎠ = 0, j ∈ Z, r ∈ O, nrj ⎜⎜⎜⎝ g j ⎜⎜⎜⎝ m=1 i=l ⎛ i ⎞ R ( ⎜⎜⎜( ⎟⎟⎟ m g j ⎜⎜⎝⎜ n j ⎟⎟⎠⎟ τi + V rj − λr ≥ 0, j ∈ Z, r ∈ O, i=r m=1 ( nrj = qr , j ∈ Z, r ∈ O, j
nrj ≥ 0,
j ∈ Z, r ∈ O.
APPENDIX B: UNIQUENESS OF THE CONSTRAINED MINIMIZATION PROBLEM The Hessian matrix of the objective function (8) can be represented by ⎡ 2 ⎤ ∂2 z(n) ⎥⎥ ∂2 z(n) ⎢⎢⎢ ∂ z(n) ⎥⎥ · · · ⎢⎢⎢ ∂n11 ∂n12 ∂n11 ∂n JR ⎥⎥⎥⎥ ⎢⎢⎢ ∂n211 ⎥⎥⎥ ⎢⎢⎢ 2 ⎥⎥⎥ ∂2 z(n) ⎢⎢⎢ ∂ z(n) ⎥⎥⎥ ⎢ ⎢ ⎥⎥⎥ . ∂n212 ∇2 z(n) = ⎢⎢⎢⎢ ∂n12 ∂n11 ⎥⎥⎥ ⎢⎢⎢⎢ .. .. ⎥⎥⎥ ⎢⎢⎢ . . ⎥⎥⎥ ⎢⎢⎢ 2 ∂2 z(n) ⎥⎥⎥⎥ ⎢⎢⎢ ∂ z(n) ⎥⎦ ··· ⎣ ∂n JR ∂n11 ∂n2JR
The second-order leading-principle minor determinants for this matrix are given by :: 2 : ∂2 z(n) :: :: ∂ z(n) :: :: 2 ∂n ∂n :: ∂n 11 12 :: 11 :: ∂2 z(n) ∂2 z(n) ::: :: : ∂n12 ∂n11 ∂n212 : =
dg j (n11 ) ∂2 z(n) ∂2 z(n) ∂2 z(n) ∂2 z(n) − = τ1 . ∂n12 ∂n11 ∂n11 ∂n12 dn11 ∂n211 ∂n212
As g j (·) is a strictly monotonically increasing function, its derivative is always positive. The Hessian matrix of the objective function is block diagonal, which is always positive definite.
REFERENCES 1) Arnott, R., De Palma, A. and Lindsey, R.: Economics of a bottleneck, Journal of Urban Economics, Vol. 27, No. 1, pp. 111–130, 1990.
2) Arnott, R., De Palma, A. and Lindsey, R.: A structural model of peak-period congestion: A traffic bottleneck with elastic demand, The American Economic Review, Vol. 83, No. 1, pp. 161–179, 1993. 3) Vickrey, W.: Congestion theory and transport investment, The American Economic Review, Vol. 59, No. 2, pp. 251–260, 1969. 4) Small, K. A.: The scheduling of consumer activities: Work trips, The American Economic Review, Vol. 72, No. 3, pp. 467–479, 1982. 5) Small, K., Noland, R., Chu, X. and Lewis, D.: Valuation of travel-time savings and predictability in congested conditions for highway user-cost estimation, Technical Report of National Cooperative Research Highway Program, No. 431, 1999. 6) Vickrey, W.: Pricing, metering and efficiently using urban transportation facilities, Highway Research Record, No. 476, pp. 36–48, 1973. 7) Tseng, Y.-Y. and Verhoef, E. T.: Value of time by time of day: A stated-preference study, Transportation Research Part B: Methodological, Vol. 42, No. 7–8, pp. 607–618, 2008. 8) Fosgerau, M. and Engelson, L.: The value of travel time variance, Transportation Research Part B: Methodological, Vol. 45, No. 1, pp. 1–8, 2011. 9) B¨orjesson, M., Eliasson, J. and Franklin, J. P.: Valuations of travel time variability in scheduling versus mean–variance models, Transportation Research Part B: Methodological, Vol. 46, No. 7, pp. 855–873, 2012. 10) Kobayashi, K., Okumura, M. and Nagano, M.: Departure time distribution of railway commuting: A theoretical approach, Infrastructure Planning Review, Vol. 14, pp. 895–906, 1997 (in Japanese). 11) Okumura, M., Nagano, M. and Kobayashi, K.: Working schedule and welfare of railway commuting, Infrastructure Planning Review, Vol. 15, pp. 831–840, 1998 (in Japanese). 12) Ieda, H., Tsuchiya, K., Le Binh, P. and Okamura, T.: Development of the commuter demand concentration model based on a time-space network scheme, Proceedings of Japan Society for Civil Engineers, No. 702/IV–55, pp. 65–79, 2002 (in Japanese). 13) Iwakura, S. and Harada, C.: A model system of departure time choice for commuter trips by metropolitan railway, Transport Policy Studies’ Review, Vol. 8, No. 3, pp. 4–15, 2005 (in Japanese). 14) Tian, Q., Huang, H.-J. and Yang, H.: Equilibrium properties of the morning peak-period commuting in a many-to-one mass transit system, Transportation Research Part B: Methodological, Vol. 41, No. 6, pp. 616–631, 2007. 15) Matsumura, K., Muto, S., Fukuda, D. and Yaginuma, H.: Structural estimation of departure time choice model in congested urban railway: A empirical study based on game theory, Proceedings of Infrastructure Planning, Vol. 45, Paper No. 165, 2012 (in Japanese). 16) Beckmann, M., McGuire, C. and Winsten, C. B.: Studies in the Economics of Transportation, Yale University Press, 1956. (Received February 28, 2014)
I_548