For most computer systems, even short periods of overload degrade ... While SRPT might not seem like the best choice for large jobs, particularly under overload ...
Scheduling Solutions for Coping with Transient Overload1 Nikhil Bansal
Mor Harchol-Balter May 2001
CMU-CS-01-134
School of Computer Science Carnegie Mellon University Pittsburgh, PA 15213
This research was supported by Cisco Systems via a grant from the Pittsburgh Digital Greenhouse 00-1 and by NSF ITR 99-167 ANI-0081396. 1
Keywords: Overload, HIGH/LOW, scheduling, processor sharing, shortest processing remaining time, time-sharing, shortest job rst, SRPT, priority, unfairness, starvation, heavy-tailed behavior, high variance
Abstract For most computer systems, even short periods of overload degrade performance signi cantly. The number of jobs in the system quickly grows, often exceeding the capacity of the system within just seconds, and response times explode. In this paper we investigate system behavior under transient overload. We nd that the poor behavior of systems under transient overload can at least partly be attributed to the scheduling policy traditionally used in systems. The traditionally-used scheduling policy is Processor-Sharing, or time-sharing, (PS). We derive analytical approximations as well as simulation results for the performance of a single PS queue under transient overload. Simulation and analysis agree. The number of jobs in the system and the system response times grows quite rapidly during overload, and even when the overload period ends, recuperation is very slow. We propose a new solution for coping with transient overload: SRPT scheduling of jobs (Shortest Remaining Processing Time). We derive analytical approximations for the performance of a single SRPT queue under transient overload, and validate those approximations with simulation. We evaluate our PS and SRPT approximations under a realistic job size distribution, a Bounded Pareto with a heavy-tailed property. We nd that SRPT performs an order of magnitude better with respect to mean response time and mean queue length. While SRPT might not seem like the best choice for large jobs, particularly under overload, it turns out that under our realistic workload big jobs do not perform worse under SRPT as compared with PS in expectation. We give intuition for this. Finally we pose some interesting open questions on the topic of starvation of large jobs.
1 Introduction Overload is a situation where the rate of work arriving at a system is greater than the system can handle. In this paper we investigate systems under transient overload, where load alternates between a nite period of overload (called HIGH period) followed by a nite period of low load or zero load (LOW period). The mean system load is always below 1. This HIGH/LOW model is described in Section 2. For most servers (e.g. web servers), even short periods of overload cause the number of jobs in the system to quickly exceed the system capacity, often within a matter of seconds. A large number of jobs implies large allocations of system resources (bu�ers), as well as many context switches. These e�ects in turn cause the server to either stop accepting new jobs or crash. Either way, client response times explode. Recently there has been much attention paid to the problem of overload, particularly in web servers. This research can be divided into 3 primary areas. One solution is to increase the server resources, for example, adding more hardware, bandwidth, or CPU. This is often done by replacing the server by a server farm (e.g. [8, 6, 16]). Another solution is to enhance the OS to better support server software: ([20, 9, 1, 15, 19]). Finally, people try to limit the load at a server, either via installing a proxy cache (at the client or server end) (e.g. [10, 4]) or by admission control ([13]). Our approach to coping with transient overload is di�erent from the above approaches. Our approach does not require buying more hardware or limiting the number of system users. We simply propose scheduling the jobs in a di�erent order from that traditionally used. In computer systems today, when multiple jobs contend for a single resource (e.g. CPU or bandwidth), the policy used for scheduling the jobs most closely resembles ProcessorSharing (PS). That is, the desired resource is time-shared among the contending jobs, with each job in turn receiving a small quantum of service. Processor-Sharing has many provably desirable properties when system load remains below 1, such as low mean response times and fairness (all jobs experience same mean slowdown) [17, 25]. However, in real systems the load uctuates, sometimes exceeding 1, and it is not clear what the performance of PS is in this case. The rst result in this paper is an approximate analysis of the performance of a PS queue under transient overload. Our analysis is based on combining ideas from Jean-Marie and Robert [14] and Chen, Kella, and Weiss [5]. We validate the assumptions made in our analysis via simulation, which agrees with our analysis. We evaluate our analytic formulas in the case where the job size distribution is a Bounded Pareto distribution, with a heavy-tailed property. This distribution has been shown to be characteristic of computer workloads [18, 12, 7, 21]. Our PS results indicate that performance of a PS server under transient overload can be quite poor, even when mean system load is very low. The performance is dominated by the load during the overload period. The number 1
of jobs in system increases very rapidly during the overload period and then is slow to recover during the low load period, due to the time-sharing nature of PS scheduling. In an attempt to improve performance of servers under transient overload, we propose scheduling requests under the well-known Shortest Remaining Processing Time First (SRPT) policy. The motivation is the fact that SRPT minimizes the number of jobs in the system at any time. Applications have shied away from using SRPT for fear that SRPT \starves" big jobs, particularly under overload [3, 23, 24, 22], however the performance of SRPT under transient overload has never been analyzed. In a recent paper [2] we consider only the case with constant load below 1 (no overload). In [2] we nd that, provided the load is not too close to 1 (so as to allow large jobs a turn to run), for many workloads with a heavy-tailed property, the fear of starvation is unsubstantiated. That is, all jobs, including the very largest job have lower queueing time under SRPT scheduling than under FAIR scheduling. The second result in this paper is an approximate analysis of SRPT scheduling under transient overload. We validate the assumptions made in our analysis via simulation, which agrees with our analysis. We evaluate the analytic formulas in the case where the job size distribution is a Bounded Pareto distribution, with a heavy-tailed property. The comparison of the PS results with the SRPT results under the Bounded Pareto workload is quite interesting. We nd that:
� The improvement of SRPT over PS both in terms of the mean response time and � � � �
in terms of mean number of jobs in system is substantial (close to an order of magnitude). The mean improvements of SRPT over PS are greatest when the overload is close to 1. Unfairness to big jobs under SRPT as compared with PS is virtually non-existent under our Bounded Pareto workload. The higher the load during the low load period, the better SRPT looks with respect to all of the above metrics. For distributions with a lighter tail, e.g. the exponential distribution, the results are not much worse. In fact we can prove that for an exponential distribution, if the load during the overload period exceeds 2, then every single job performs better under SRPT than under PS, in expectation.
The last observation above leads us to speculate on the class of distributions for which SRPT improves upon PS under transient overload. This discussion is covered in Section 7, where we provide analyses, observations, and open problems on this topic. The above results are encouraging with respect to the potential real-world applicability of SRPT scheduling. 2
2 Model, Relevant Previous Work, and Simplifying Assumptions 2.1 Model Throughout this paper we will assume an M/G/1 queue. The job sizes will be assumed to be independent and identically distributed with c.d.f. F (x) and p.d.f. f (x). The arrival process will consist of alternating periods of high and low loads. During the high load period (also called the \HIGH" period), jobs arrive with mean arrival rate �h and create a load of �h > 1. The high load period has xed duration th . During the low load period (also called the \LOW" period) jobs arrive with mean arrival rate �l and create a load of �l < 1. The low load period has xed duration tl . Let � denote the average system load. Thus �=
th
th + tl
�h +
tl
th + tl
�l
We will always assume that the average load � < 1. Our system behavior is as follows: During the HIGH period, jobs build up in the system as a function of time. We will derive an expression for this buildup. At the start of the LOW period, there is an accumulation of jobs which we refer to as \the bag of jobs." Since the load during the LOW period is less than 1, the number in system will start decaying and will converge to a low value, related to �l , before the end of the of the LOW period. This is expected since the average load is less than 1. Some additional notation: The number of jobs in the system t time after the onset of the HIGH period will be denoted by Nh (t). Likewise the number of jobs in the system t time after the onset of the LOW period will be denoted by Nl(t).
2.2 Relevant Previous Work To the best of our knowledge, the HIGH/LOW workload model with general job size distribution has not been studied under either PS or SRPT scheduling. For SRPT scheduling, there are no relevant queueing results in the literature dealing with overload. For PS scheduling, there are two relevant results: one by Chen et. al. [5] and the other by Jean-Marie and Robert [14]. While these results don't cover the HIGH/LOW model, they are still very relevant in its analysis. Jean-Marie and Robert's work [14] can be viewed as analyzing only the HIGH period of the HIGH/LOW model under PS scheduling. They prove that Nh (t)=t converges to 3
a particular constant in the limit as t ! 1. They also derive the distribution on the residual job sizes in the limit as t ! 1. Chen et. al.'s work [5] can be viewed as analyzing only the LOW period of the HIGH/LOW model under PS scheduling. Speci cally, they assume a PS server running under load �l < 1 which begins with a set of initial jobs distributed according to an arbitrary distribution. They obtain a uid approximation on Nl , however it is not expressed as a function of t, but rather as a function of v (t), where v (t) is the cumulative amount of processing time per customer allocated by the server up to time t.
2.3 Simplifying Assumptions It seems natural to try to combine the results in [14] and [5] to analyze the HIGH/LOW model under PS. Our goal is to understand the mean response time for a job of size x under the HIGH/LOW model. Unfortunately, we could not see how to directly combine these results to derive mean response time. Part of the problem is that the Chen result doesn't actually compute Nl (t). Another part of the problem is that the Jean-Marie and Robert result requires t ! 1, whereas we want to consider nite th and tl . In our analysis it was therefore necessary for us to resort to two simplifying assumptions under PS and under SRPT: 1. Nht(t) = constant 8t; for all sample paths, and 2. Nl(t) is the same for all sample paths: These simplifying assumptions will serve several purposes: First, they will allow us to obtain an approximation for expected response time for a job of size x for a HIGH/LOW process under PS scheduling (see Section 3). Second, they will allow us to obtain approximations for all performance metrics of interest for a HIGH/LOW process under SRPT scheduling ( expected response time for a job of size x, Nh (t), Nl(t)) (See Section 4). Third, they will allow us to compare SRPT and PS performance in a HIGH/LOW workload (see Section 5). Our simplifying assumptions may seem quite strong. However, in Section 6 we will compare the performance numbers derived using the simplifying assumptions with our simulation results which make no assumptions. We will nd that provided th and tl are not too small (at least 100 times the mean job size), the simulation numbers agree with the analytically-derived numbers.
3 Analytical Results for PS under HIGH/LOW model The goal of this section is to derive the expected response time for a job of size x under the HIGH/LOW model with PS scheduling. Throughout we will apply our simplifying 4
assumptions from Section 2. Before we begin we will need to review the results of Jean-Marie and Roberts [14] and Chen et. al. [5]. In reviewing these results, we will also use our simplifying assumptions to provide intuitive derivations of these results for the bene t of the reader.
3.1 Analysis of the HIGH load period only Lemma 0.1 (due to [14]) Consider an M/G/1/PS queue with load � > 1 and average
arrival rate �h . Let Nh (t) denote the number of jobs in the system at time t. Then for almost all sample paths, lim Nh (t) = a (1) t!1 R1
where a is the solution to �h (1 ? 0
t
f (x)e?ax dx) = a.
Proof via Simplifying Assumptions: The following is a rough proof based on our approximations made in Section 2. Since the work in the system by time t increases as (�h ? 1)t + o(t), it is not di�cult to see that for almost all sample paths, Nh(t) = at + o(t), for some a. To determine a, let us ignore the o(t) term and approximate Nh (t) by at, and assume that this holds for all t and for all sample paths. Now, consider a job of size x, arriving at time ta . Then the service received by the job by time t0 is Z t0 dt S (ta; t0 ) = (2) N (t) ta
h
Clearly the job departs at time td such that S (ta; td ) = x. So, td = ta eax . Thus, at time t, if a job of size x arriving at time ta is present in the system, then ta � te?ax . Now the expected number of jobs of size between x and x + dx which arrive during time [0; t] is �htf (x)dx. Since the arrival process is Poisson these jobs can be assumed to arrive uniformly over [0; t]. Thus, we expect that about �h t(1 ? e?ax )f (x)dx of these jobs will still be present in the system at time t. Averaging over the possible Rjob sizes x, we get that R1 Nh (t) = 0 �h (t?te?ax )f (x)dx. Equating Nh (t) to at gives us a = 01 �h (1?e?ax )f (x)dx. 2. Since we will be interested in evaluating various metrics for PS, we will make the results compact. Let Lg (s) denote the Laplace transform of a function g , i.e. Lg (s) = Rmore 1 g (x)e?sxdx. Thus we observe that a satis es a = � (1 ? L (a)). Moreover observing h f 0 that LF (s) = (1 ? Lf (s))=s, we can write a in the following form which will be useful later. 1 L (a) = (3) F
�h
5
We now obtain an approximation for the number of jobs with remaining size > y at the end of the HIGH period, using our simplifying assumptions 1. Consider a job of (original) size z . Arguing as above, this job will have remaining size > y at time th i� it's arrival time, ta , is such that ta > th e?a(z?y) Thus the total number of jobs of size (z; z + dz ) which have remaining size > y at time th will be �h th f (z )(1 ? e?a(z?y) )dz (4) Integrating 4 over all possible job sizes greater than y gives us the total number of jobs which have remaining size > y at time th , which is Z
1
y
�h th f (z )(1 ? e?a(z?y) )dz
(5)
Let Fr denote the c.d.f of the remaining sizes of the jobs at the end of the HIGH period. Since the total number of jobs at time th is ath , using 5 gives, Fr (y ) =
R1 ?a(z?y) )dz y �h f (z )(1 ? e
a
(6)
After some manipulation, we observe that the Laplace Transform of Fr can be written simply as 1 ? �h LF (s) LFr (s) = (7) s?a
3.2 Analysis of the LOW load period only We now consider just the low load period (�l < 1), starting with Nl (0) jobs with remaining sizes distributed according to c.d.f. Fr . New jobs arrive into the system at rate �l where the new job sizes have c.d.f. F . We now use our simplifying assumptions to derive an expression for the number of jobs in the system. Chen, Kella and Weiss [5] have analyzed the low-load only system and obtained a uid limit expression for the number of jobs in the system. The [5] result is similar to our result in Equation 11. Denote the number of jobs in this system at time t by Nl(t), and let us assume that Nl (t) is constant for all sample paths. Nl(t) will consist of two types of jobs. Jobs which were present at time 0 and those which arrived at time greater than 0. We will call these jobs of Type 1 and Type 2 respectively. To determine Nl(t), consider a job of size x which arrives at time ta . This job will complete at time td such that the service received by the job during time Rta to td is x. Now, the service received by the job during time ta to td under PS, will be ttad Ndtl (t) . 1
[14] also study the problem of residual job sizes.
6
R
Let us de ne v (t) = 0t Ndyl (y) , where v (t) is the cumulative service per customer allocated by the server up to time t. Thus a job of size x arriving at time ta is present in the system at time t i� v (t) ? v (ta ) < x. Thus the number of Type 1 jobs still present at time t will be Nl(0)Fr (v (t)). To obtain the number of Type 2 jobs, consider the jobs which arrive during time y and y + dy . There will be approximately �l dy such jobs. Out of these the number still present at time t will be �l dyF (v (t) ? v (y )). Integrating over y from 0 to t will give us the total number of Type 2 jobs still present at time t. Adding the number of Type 1 and Type 2 jobs we thus obtain, Nl (t) = Nl(0)Fr (v (t)) +
Z t
0
�l F (v (t) ? v (y ))dy
(8)
We do not know of a way to solve Equation 8 directly to obtain the number in system as a function of time. However, we can obtain this indirectly by solving for the number in system and solving for t as a function of v . We will denote these by Nlv and tv respectively. Observing that v (0) = 0 and dtd v (t) = n(1t) , Equation 8 can be written as Nlv (v ) = Nl(0)Fr (v ) +
Z v(t)
0
�lF (v ? z )Nlv (z )dz
We can now solve Equation 9. Using Laplace Transforms this gives us LNlv (s) = Nl (0)LFr (s) + �LF (s)LNlv (s) which yields Nl(0)LFr (s) LNlv (s) = 1 ? � L (s) l F
Using Equation 7 we get,
LNlv (s) =
To obtain tv observe that
Nl (0) (1 ? �h LF (s)) � s ? a (1 ? �l LF (s))
(9) (10) (11) (12)
dtv dv
= Nlv , thus we get, 1 N (0) (1 ? �h LF (s)) Ltv (s) = � l � s s ? a (1 ? �lLF (s))
(13)
3.3 Analysis of Response times for the HIGH/LOW model Using the results above we can now obtain the expressions for the response times as a function of job size under transient overload. We classify the jobs into 3 types. Jobs which arrive during the HIGH period and nish during the HIGH period itself are type 1 jobs. Jobs which arrive during the HIGH period but nish in the LOW period are type 2 jobs. Jobs which arrive during the LOW period and nish during the same LOW period are type 3 jobs. 7
Note, that since the average load is less than 1, very few jobs which arrive during the LOW period will continue during the next HIGH period. Thus we consider only the three types of jobs mentioned above. Suppose J is a job of size x. If it is a type 1 job, then we know that it must have arrived during time 0 to th e?ax . Assuming it arrives uniformly during this interval, we obtain E [T (x)jJob is of type 1]
Z th e?ax = t e1?ax y (eax ? 1)dy 0 h = 21 th (1 ? e?ax )
(14)
Suppose J is of type 2, then it must have arrived during time th e?ax to th . If it arrives at time y , then it spends th ? y time during the HIGH period and its remaining size at the beginning of the LOW period is r(y ) = x ? 1a log tyh . Observe that by Equation 13 this job nishes at time tv (r(y )). Thus we obtain, E [T (x)jJob is of type 2]
Z th = k(1x) ?ax [(th ? y ) + tv (x ? a1 log tyh )]dy th e Z th 1 1 = 2 k(x) + k(x) ?ax tv (x ? a1 log tyh )dy th e Z x 1 1 = 2 k(x) + 1 ? e?ax atv (x ? z )e?az dz (15) 0 where k(x) = th (1 ? e?ax ). Finally we consider the case when J is a job of type 3. To do this, we need to rst digress and de ne quantity tw . Consider the amount of work accumulated during the HIGH period. This is approximately (�h ? 1)th . Thus the time until this work is removed from the system during the LOW period will be around tw = (�h ? 1)th =(1 ? �l ). Returning to the case of a job of type 3, we can separate jobs of type 3 into 2 cases: those which arrive before time tw and those which arrive after time tw . Let us rst consider the jobs which arrive during time tw from the start of the LOW period. Suppose a job arrives at time ta from the start of the LOW period, then it will nish at time tv (x + v (ta)). Given that a job arrives during the time 0 to tw , it will arrive uniformly during this interval (since the arrival process is Poisson). Thus,
E [T (x)jJob is of type 3, and arrives in (0; tw )]
8
Z tw (tv (x + v (y )) ? y )dy = t1 w Z0 1 v 1 (t (z + x) ? tv (z ))N v (z )dz =
l
tw 0
(16)
Observe that for each of the Type 1,2 and 3 jobs considered above, the response time of a job is proportional to th . For type 3 jobs which arrive after time tw , their response time will be independent of th . Thus if th is quite large (compared to the mean job size) we can assume that the response time for these jobs is negligible compared to jobs of type 1, type 2 and jobs of type 3 which arrive during time 0 to tw . Hence we will approximate the response time of type 3 jobs arriving during tw to tl by 0. So, nally we obtain E [T (x)jJob is of type 3]
Z 1 1 = t (tv (z + x) ? tv (z ))Nlv (z )dz
h 0
(17)
Finally to obtain the approximate expected response time for a job of size x, we nd the unconditional response time. Thus we obtain that E [T (x)]P S = p1 E (T1(x)) + p2E (T2(x)) + p3E (T3(x))
(18)
where E [Ti(x)] is the expected response time for a job of type i, i = 1; 2; 3, as obtained in Equations 14,15 and 17. The probability p1 that a job of size x is of type 1 is �h th e?ax =(�h th + �l tl ). The probability p2 that a job of size x is of type 2 is (�h th (1 ? e?ax ))=(�hth + �l tl ). Finally the probability p3 that a job of size x is of type 3 is �lth =(�hth + �ltl ). Substituting the values in Equation 18 and doing some manipulation gives E [T (x)]P S " # (1 ? e?ax )th Z x v �h th + at (x ? z )e?az dz = � t +�t 2 0 hh ll � �Z 1 + � t �+l � t (tv (z + x) ? tv (z ))Nlv (z )dz hh ll 0
(19)
Observe that if �l = 0, E [T (x)]P S =
(1 ? e?ax )th + Z x atv (x ? z )e?az dz 2 0
9
(20)
4 Analytical Results for SRPT under HIGH/LOW model In the previous section we derived an approximation for the response time for a job of size x under PS scheduling. The goal of this section is to derive an approximation for the response time for a job of size x under the HIGH/LOW model with SRPT scheduling.
4.1 Number of jobs during HIGH period Let xo be de ned such that �h (xo ) = 1. Consider a job of size x > xo . This job will never run as long as there are jobs of size less than x in the system. Since �h (x) > 1, it follows that for almost all sample paths ! there will be a time t(! ) such that the work made up by jobs of size less than x will be non-zero for all t > t(! ). Hence, if the job x arrives after time t(! ) it will remain in the system at least until the end of the HIGH period. Assuming that th is large compared to t(! ), we will use the approximation that all jobs of size > xo are held back during the HIGH period. Secondly, for jobs of size x < xo the expected response time for a job of size x is o(1), as shown in [2]. The reason for this is that if we consider the busy periods during which jobs of size � x are executed, then at most one job of size > x can a�ect a particular busy period. Hence, the response time for a job of size x is not a�ected signi cantly by jobs of size > x, and hence is o(1), if �(x) < 1. Using the observations above we approximate the number of jobs at time t as Nh (t) = �h tF (xo )
(21)
and the distribution of the job sizes of the accumulated jobs as ( f (x) ; fr (x) = F (xo )
0
x > xo otherwise
(22)
4.2 Number of jobs during LOW period During the LOW period, �l < 1, and thus the jobs accumulated during the HIGH period will start receiving some share of the processor. Let us consider what the accumulated jobs look like during the LOW period. At time t = 0, the jobs in the bag are of size xo and greater. As time progresses, jobs will be cleared from the bag starting from the jobs of size xo . Let x(t) be the size of the smallest job remaining in the bag at time t. We will rst approximate x(t) as a function of t. Clearly x(0) = xo . Consider the scenario at time t. Consider how much time it takes to advance x(t) by dx amount. This will simply be the amount of work of size between 10
x(t) and x(t) + dx present in the system at time t. Suppose it takes dt time to do this. Let us estimate dt in terms of dx. The expected amount of work that needs to be done during the dt time can be divided into 3 parts:
1. The expected work made up of jobs in the original bag with sizes between x(t) and x(t) + dx. This work totals to �h th x(t)f (x(t))dx. 2. Pending work due to the new arrivals (during the LOW period) with sizes between x(t) and x(t)+ dx. Note that these jobs were not worked upon, until now. This new work will be �ltx(t)f (x(t))dx. 3. The fresh work which arrives during this dt amount of time. We need only consider work made up by jobs of size less than x(t), since x(t) will be a�ected by other jobs. This work will be �l (x(t))dt. Using these observations we can write, dt = �h th x(t)f (x(t))dx + �l tx(t)f (x(t))dx + �l(x(t))dt
Hence,
dt = x1(t?)f�(x((xt())t))dx (23) �h t h + � l t l Integrating the l.h.s. of Equation 23 from 0 to t and the r.h.s. from xo to x(t) and observing that d�dxl (x) = �l xf (x) and �h (xo ) = 1, we get,
1 log �h th + �l t = 1 log 1 ? �l(xo ) �h th �l 1 ? �l(x(t))
�l
Thus we obtain2
�l (x(t)) =
�l (t + th ) �h th + �lt
(24)
Having obtained x(t), Nl (t) can be readily determined, since by the above arguments the number of jobs at time t will be approximately (�h th + �lt)F (x(t)). Thus, Nl (t) = (�h th + �l t)F (x(t))
(25)
Finally, we obtain the inverse of x(t) which we denote by t~(x). Thus t~(x(t)) = t. This will be useful in obtaining the approximation for the expected response time. Clearly t~(x) is only de ned for x > xo . Then Equation 24 gives3 ~t(x) = th �h (x) ? 1 (26) 1 ? �l(x) 2 3
For the case when �l = 0, we get �h (x(t)) = 1 + tth For the case when �l = 0, we get ~t(x) = th (�h (x) ? 1)
11
4.3 Response times as a function of job size To derive the expected response time under SRPT, we rst consider a job of size less than xo . For such a job we know that the expected response time is a constant, hence o(th ). This holds whether the job arrives during the HIGH period or during the LOW period. Consider a job of size x, x > xo . Suppose the job arrives during the HIGH period. Then it will wait throughout the HIGH period, and approximately t~(x) time during the LOW period. Given that the job arrives during the HIGH period, it will arrive uniformly in the interval since the arrival process is Poisson. Thus 1 E [T (x)jjob arrives during HIGH period]SRP T = th + t~(x) (27) 2 Now consider the case when the job of size x, x > xo arrives during the LOW period. Again, if the job arrives after time t~(x), then its will response time will be o(th ). Finally, given that the job arrives during the low period between time 0 to ~t(x), its response time will be approximately 21 t~(x). The probability that a job arrives during the HIGH period is �h th =(�hth + �ltl ). The probability that a job arrives during the interval [0; ~t(x)] of the LOW period is �l ~t(x)=(�hth + �ltl ). Thus the expected response time for a job of size x � xo under SRPT will be ! 1 �l t~2 (x) �h th ~ t + t(x) + (28) E [T (x)]SRP T = �h th + �ltl 2 h �h 2th Observe that when �h and �l are xed E [T (x)] varies linearly with th . However if the job size is less than xo , we know that E [T (x)] is o(th ). Hence, for large th the ratio of response times for a job of size < xo to that of size > xo will tend to 0. Thus we will approximate E [T (x)] by 0 for x < xo . We will show later in Section 6 that this approximation is quite good.
5 Comparison of PS and SRPT based on analytical results In Sections 3 and 4 we derived the approximation for the expected response time of a job of size x under SRPT and PS for the HIGH/LOW model. These results are summarized in Equations 28 and 19 respectively. It is di�cult to compare these two equations analytically for generally-distributed workloads, therefore in this section we compare Equations 28 and 19 evaluated on a particular real-world workload. Although we only show results for this particular workload, we will make observations which apply to more general workloads as well, and we will discuss intuitions for why these results hold more generally. In Section 7 we return to the discussion of other workloads. 12
Our workload assumes job sizes have a Bounded Pareto distribution. This distribution is de ned as follows: Recall a Pareto distribution with parameter �, is de ned such that P r[X > x] � x?� ; where 0 < � < 2
The Bounded-Pareto distribution [11] is characterized by three parameters: �; the exponent of the power law; k, the smallest possible job; and p, the largest possible job, The probability density function for the Bounded Pareto B (k; p; �) is de ned as: f (x) =
�k� x?�?1 k � x � p: 1 ? (k=p)�
In this paper, we consider the distribution B (k; p; �) obtained by keeping the mean xed (at 3000) and the maximum value xed (at p = 1010 and � = 1:5). These parameters correspond to typical values for Web workloads taken from [7]. Throughout we normalize the distribution by scaling down the job sizes by a factor of 3000, leaving the mean as 1. We refer to this normalized distribution as B (� = 1:5). Pareto and Bounded-Pareto distributions have been shown to be characteristic of the job size distributions in many computer workloads [18, 12, 7, 21]. These distributions have 3 important properties: 1. Decreasing failure rate (Pareto) or mostly-decreasing (Bounded Pareto). 2. In nite variance (Pareto) or very high variance (Bounded Pareto). 3. The heavy-tailed property, which we de ne as: \A very small fraction of the largest jobs (e.g., 1%) comprise more than half the total load." We now compare Equations 28 and 19 evaluated on our B(� = 1:5) distribution with respect to two metrics: 1. Number of jobs in system as a function of time (Section 5.1). 2. Response time for a jobs of size x (Section 5.2).
5.1 Number of jobs in system We now consider the number of jobs in the system as a function of time under PS and SRPT. The number in system is an interesting practical metric. Consider as an example a Web server which services its requests in SRPT order, as opposed to the traditional PS service order. The number of requests in the system corresponds to the number of simultaneously open connections in the Web server. The greater this number the more 13
150
1000 PS SRPT
PS SRPT
900
700
100
Number of jobs
Number of jobs
800
50
600 500 400 300 200 100
0 0
500
1000 Time
0 0
1500
(a) �h = 1:3; �l = 0
500
1000
1500 Time
2000
2500
(b) �h = 2; �l = 0
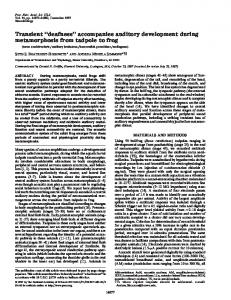
Figure 1: Analytic results: Number of jobs in system as a function of time under (a)
�h = 1:3 and (b) �h = 2 for the B (� = 1:5) distribution. Time 0-1000 corresponds to the HIGH period. For each of the plots �l = 0 and the average load is 0.7.
overhead is required by the Web server. Furthermore, if this number gets too high, the Web server may crash or simply stop accepting requests. Figure 1 shows the number of jobs as a function of time for various values of �h with �l = 0, under SRPT and PS scheduling for the B (1:5) distribution. Here th = 1000 and tl is chosen such that the average load is 0.7. Observe that a value of 1000 on the x-axis indicates the end of an HIGH period. Observe that the area under the curves is proportional to the mean number of jobs in the system (hence to the mean response time). We now state a few general observations based on Figure 1. For each observation, we provide intuition, and discuss why it should hold for more general workloads as well.
Observation 1 The mean number of jobs in the system under SRPT is signi cantly less than that under PS. This is due to the fact that SRPT is known to always minimize the number of jobs in the system (under all conditions) since it always works on that job which can be completed most quickly.
Observation 2 Though still signi cant, the relative advantage of SRPT over PS (with
respect to number of jobs in the system) decreases at higher values of �h . (See Figures 1a and 1b).
This occurs since as �h grows very high, both PS and SRPT retain almost all jobs during 14
the HIGH period and thus the di�erence in their performance depends only on their behavior during the low period.
Observation 3 SRPT recuperates from overload faster than PS. Speci cally, the curve for the number of jobs under SRPT during the LOW period is always convex, while this may not be true for PS. This follows since SRPT works on jobs with the smallest remaining size rst, thus the rate of clearance of jobs is maximum in the beginning of the LOW period and then decreases. Also, since PS timeshares among all the jobs, it somewhat delays getting jobs out at the beginning of the LOW period. This can be observed in Figure 1b (right). Thus SRPT not only accumulates fewer jobs, but it also gets them out as quickly as possible. Finally, a subtle, but important observation:
Observation 4 Given a xed �h, the number in system in Figure 1 does not depend on
the average load (provided � < 1). In general, the average load � can be made arbitrarily low or arbitrarily close to 1 by choosing tl accordingly. However, the the number of jobs during the HIGH period or the LOW period will not change.
This is an important departure from the usual M/G/1 queueing model in the sense that the performance metric does not depend on the average load, but only on the load during the overload period. Finally, we nd that the trends look similar for the case when �l > 0. 4 Notice that the number of jobs during the HIGH period is independent of �l . Hence Nh (t) looks identical for all values of �l . The only noticeable di�erence is that that it takes a longer time (stretched by 1=(1 ? �l)) during the LOW period for the number of jobs to go down to zero.
5.2 Expected Response Times as a function of job size The point of this section is to determine whether the large jobs \starve" under SRPT scheduling as compared with PS scheduling. We do this by observing the expected response time for large jobs. Figure 2 shows the expected response time as a function of job size under SRPT versus PS for the B (� = 1:5) distribution, when �l = 0. The job size is expressed as a percentile of the job size distribution (where 100 percentile indicates the very largest job). Note that due to the choice of the x-axis, the area under the PS (respectively, SRPT) curve corresponds to the mean response time under PS (respectively, SRPT). In Figure 3 we consider the case when �l = 0:5. However we use a 3 stage hyper-exponential approximation to B (1:5), 4
The plots for this case are not included for lack of space.
15
800
1400
600
Expected Response Time
Expected Reponse Time
700
1600 PS SRPT
500 400 300 200 100 0 0
PS SRPT
1200 1000 800 600 400 200
20
40 60 Percentile of Job size
80
0 0
100
20
(a) �h = 1:3; �l = 0
40 60 Percentile of Job Size
80
100
(b) �h = 2; �l = 0
Figure 2: Analytic results: Response times as a function of job size for (a) �h = 1:3,�l = 0 and (b) �h = 2, �l = 0. Both gures assume the B (1:5) distribution. th is assumed to be 1000, �l = 0 and tl is chosen such that the average load is 0.7.
600
PS SRPT 1000
Expected Response Time
Expected Response Time
500
1200 PS SRPT
400
300
200
100
0 0
800
600
400
200
20
40 60 Percentile of Job Size
80
100
(a) �h = 1:3; �l = 0:5
0 0
20
40 60 Percentile of Job Size
80
(b) �h = 2; �l = 0:5
Figure 3: Analytic results: Response times as a function of job size under (a) �h = 1:3; �l = 0:5 and (b) �h = 2; �l = 0:5. Both gures assume the 3 phase approximation to the B (1:5) distribution. th is 1000, and tl is chosen such that the average load is 0.7. 16
100
in order to evaluate the response times (Recall that for �l > 0, evaluating E [T (x)] for PS requires the use of the Laplace Transform of the job size distribution).
5.2.1 Case when �l = 0 We rst consider the case when �l = 0. The following observations hold for all plots in Figure 2 and are easily explained:
Observation 5 Under SRPT jobs of size less than xo have an approximate response time of 0 when compared with th . Observation 6 Large jobs do not necessarily su�er under SRPT as compared with PS (as is commonly believed). (See Figure 2.) To see why this is the case, observe that although large jobs do badly under SRPT, they do almost equally badly under PS. The point is that the average amount of service received by a large job under PS during a HIGH period is negligible compared to its size. Thus this job stays in the system throughout the HIGH period (since its arrival). Moreover it is among the last of the jobs to complete during the LOW period, since its remaining size at the beginning of the LOW period is large compared to other remaining jobs. The observations above make a very strong case for SRPT. Not only is there a signi cant improvement in the mean response time under SRPT, but this improvement does not come at the cost of starving large jobs. Finally, we note (as in Observation 4) that the results above only depend on �h. In particular, they are not a consequence of xing the average load to a value of 0.7.
5.2.2 Case when �l > 0 Observation 7 The extent of starvation when �l > 0 is much less than that when �l = 0. To see why this is the case, rst observe that the growth rate of jobs during the HIGH period is the same for both �l = 0 and �l = 0:5. Thus the di�erence in the response times arises due to the behavior of the system during the LOW period. Observe that the number of jobs is non-zero for a longer time (by a factor of 1=(1 ? �l )) during the LOW period as compared to the case when �l = 0. Thus the poor behavior of PS with respect to clearing jobs out of the system as noted in Observation 3 is accentuated for the case when �l > 0. 17
6 Simulation Comparison The discussion in Section 5 was based on analytical results obtained in Sections 3 and 4. In this section we compare how well our approximations agree with the actual numbers obtained by simulation. We simulate PS and SRPT under the HIGH/LOW model for various distributions. The goal of the simulation is two-fold. 1. To gure out how large th needs to be so that the analytical results match simulation. 2. To gure out the number of the HIGH/LOW cycles required (denoted by n), so that the metrics of interest averaged over these cycles converge to their mean. Figure 4 shows the response times as a function of the percentile of job size under PS and SRPT, both under theory and simulation. The job size distribution is the 3 stage hyper-exponential approximation to B(1.5), with mean job size scaled down to 1, which we denote by Bh (1:5). The parameters th and n are set to 1000 and 100 respectively. Observe that for PS the approximation matches simulation almost exactly. For SRPT the approximation is close except for the point at xo . We nd that, as th is made higher, the simulation and analysis results grow closer for SRPT. Simulation comparison results 1200 PS simulation SRPT simulation PS theory SRPT theory
Expected Response Time
1000
800
600
400
200
0 0
20
40 60 Percentile of Job Size
80
100
Figure 4: Simulation results as compared with analytical approximation results, �h = 2; �l = 0:5. In general for all workload distributions we tested5 , we found that our analytical approximation results match almost exactly with simulation when th is large. We found that simulation matched analysis even for th only about 100-1000 times the mean job size, provided �h was not too close too 1. For low variability distributions th and n may be lower. The comparison of simulation and analysis is an even closer match when considering the metric number in system as a function of time. 5
More plots not shown here for lack of space.
18
7 SRPT vs. PS under more general workloads { Open problems In Section 5 we compared the performance of SRPT vs. PS on a B (� = 1:5) distribution under transient overload. We found that SRPT had two desirable properties: (1) It improved signi cantly upon PS with respect to mean response time, and (2) SRPT did not treat large jobs worse than they would be treated under PS. The point of this section is to explore whether these desirable properties of SRPT also translate to other distributions. We rst show that the desirable properties for low variability distributions as well. We prove that for the exponential distribution (C 2 = 1), SRPT improves upon PS for every job.
Observation 8 For an exponential with �h > 2 and �l = 0 every job has lower expected response time under SRPT as compared with PS.
Proof: Without loss of generality assume that the mean job size is 1. Then �h = �h , and
a = �h ? 1. Recall the expression for response time under PS, E [T (x)]P S = (1 ? e?ax )
th
Z x
v ?az 2 + 0 at (x ? z )e dz Now using the expression for tv we note that the 1 at L v (s) = � h (1 ? � L (s)) t
h Fr
s s?a
1 . Note that Fr (x) = e?x , hence LFr (x) = s+1 Thus, ath Ltv (s) = s(s + 1)
which gives tv (y ) = ath (1 ? e?y ). Thus,
E [T (x)]P S = (1 ? e?ax )
Z x
th
z?x ?az 2 2 + a 0 th (1 ? e )e dz 1 a + 1 e?ax t ? a2 e?x t 1 E [T (x)]P S = (a + )th + h h 2 2a?1 a?1 By Equation 28 we get,
E [T (x)]SRP T = (a + 1)th
19
Z x
0
ye?y dy ?
th
2
(29)
1500
Expected Response Time
PS SRPT
1000
500
0 0
20
40 60 Percentile of Job Size
80
100
Figure 5: No starvation for big jobs under Exponential job size distribution with �h = 2; �l = 0 which gives,
1 2
E [T (x)]SRP T = (a + )th ? (a + 1)(e?x + xe?x )th
(30)
We now show that for a > 1, 8x, E [T (x)]P S > E [T (x)]SRP T . To show that E [T (x)]P S > E [T (x)]SRP T , it su�ces to show that a2 ?x a + 1 ?ax e ? e < (a + 1)(e?x + xe?x ) a?1 2(a ? 1)
Or equivalently, we must show that: 1 e?x < a + 1 e?ax + (a + 1)xe?x a?1 2(a ? 1) 1 < (a2 ? 1)x + a +2 1 e(?a+1)x
De ne
g (x) = 1 ? (a2 ? 1)x ?
a + 1 (?a+1)x e
2 Clearly g (0) = (1 ? a)=2 which is less than 0. g 0(x) = (1 ? a2 )(1 ? e(?a+1)x =2), which is less than 0, for x � 0. Thus g (x) < 0 for all x > 0, and the proof follows. Figure 5 shows response time as a function of job size when the job size distribution is Exponential when �h = 2 and �l = 0. The gure shows that every job prefers SRPT to PS in expectation and furthermore that the improvement in mean response time of SRPT over PS is signi cant (a factor of about 3, judging by the area under the curves). Observe that in the above proof, we required that �h > 2. We now show that if �h is close to 1, then big jobs fair worse under SRPT as compared with PS. 20
700
PS SRPT
Expected Response Time
600 500 400 300 200 100 0 0
20
40 60 80 Percentile of Job size
100
Figure 6: Big jobs su�er under SRPT for Exponential job size distribution with �h = 1:1; �l = 0
Observation 9 For an exponential job size distribution with �h � 1 and �l = 0, big jobs perform worse under SRPT as compared with PS.
The proof is evident from Figure 6. We now provide some intuition for why the case of �h � 1 is bad for SRPT as compared with PS with respect to large jobs. Consider a job of size a little bigger than x0 . If �h � 1, then there is a big di�erence under SRPT vs. PS with respect to the remaining size on this job at the end of the HIGH period. SRPT has a large remaining size (the original size of the job). In contrast under PS since �h is low, big jobs receive quite a bit of service during the high period, hence their remaining size is small, and therefore response times in this case are lower under PS than SRPT (see Figure 6). However even in the case of �h � 1, we nd that for the B (� = 1:5) distribution, starvation is largely diminished.
Observation 10 When �h = 1:1, and the job size distribution is B(� = 1:5), only 0:06% of jobs do worse under SRPT as compared with PS, and only at most 20% worse.
To explain the above observation, we have to return to the heavy-tailed property, exhibited by the B (� = 1:5) distribution. Recall that the heavy-tailed property says that very few of the largest jobs carry all the weight. For distributions with a heavy-tailed property, the work received by the very largest jobs under PS during the HIGH period will be negligible compared to their very large size. Thus these jobs perform comparably under SRPT and PS. Hence no \starvation." We leave it as an open problem to determine the exact conditions under which SRPT has desirable properties as compared with PS. We conjecture that these conditions are 21
related to �h , and the nature of the job size distribution, in particular the weight of its tail, its overall range, and its variance.
8 Conclusion In this paper we propose a solution for coping with transient overload in systems. Our proposal is that the traditional scheduling policy used in systems (PS scheduling) be replaced by SRPT scheduling of jobs. We consider a HIGH-LOW workload model which alternates between a period of overload (HIGH) and a period of low load (LOW). We obtain analytical approximations on the response time for a job of size x under the HIGHLOW model and other metrics. Our analytical approximation results match closely to simulation. We nd the behavior of both SRPT and PS under the HIGH-LOW model to be quite di�erent from that under a tradition M/G/1, � < 1 queue. For example, the main property of PS { fairness (in the sense of the same mean slowdown for all jobs) { no longer holds under the HIGH-LOW model. We evaluate our analytical results on a distribution characteristic of today's computer workloads, and nd that, for the HIGH-LOW model, SRPT improves upon PS for every job size (in expectation), and that the improvement in mean response time can be quite signi cant. Our analysis sheds light on some general reasons for why SRPT performs well as compared with PS under the HIGH-LOW model. Our analysis shows that PS is particularly ine�ective in dealing with periods of temporary overload. Due to its time-sharing nature, it deteriorates the performance of all the jobs, which is actually unfair to small jobs. Moreover, PS is particularly slow at getting the system \back to normal" once the overload has disappeared. By contrast, SRPT accumulates far fewer jobs during the overload period, and is also much more e�cient at getting them out once the overload period is over. Our analysis sheds light on why SRPT performs well as compared with PS even on large jobs. The reason is that while it seems obvious that large jobs won't receive service under SRPT during the overload period, it turns out that they also don't receive much service under PS during the overload period. This is particularly true when the distribution has a heavy-tailed property. Our results have implications for real world systems, where uctuations in load are common. Under PS scheduling, these uctuations can results in large buildups of jobs which continue to e�ect the system for a long time. In SRPT, as we've shown, the e�ect of load uctuations is much less severe.
22
References [1] G. Banga, P. Druschel, and J. Mogul. Better operating system features for faster network servers. ACM SIGMETRICS Performance Evaluation Review, 26(3):23{30, 1998. [2] Nikhil Bansal and Mor Harchol-Balter. Analysis of SRPT scheduling: Investigating unfairness. In Proceedings of Performance and ACM Sigmetrics, 2001. [3] M. Bender, S. Chakrabarti, and S. Muthukrishnan. Flow and stretch metrics for scheduling continous job streams. In Proceedings of the 9th Annual ACM-SIAM Symposium on Discrete Algorithms, 1998. [4] H. Braun and K. Cla�y. Web tra�c characterization: an assessment of the impact of caching documents from NCSA's Web server. In Proceedings of the Second International WWW Conference, 1994. [5] H. Chen, O. Kella, and G. Weiss. Fluid approximations for a processor sharing queue. Queueing Systems: Theory and Applications, 27:99{125, 1997. [6] M. Colajanni, P. S. Yu, and D. M. Dias. Analysis of task assignment policies in scalable distributed Web-server systems. IEEE Transactions on Parallel and Distributed Systems, 9(6), 1998. [7] M. Crovella and A. Bestavros. Self-similarity in World Wide Web tra�c: Evidence and possible causes. In Proceedings of the 1996 ACM SIGMETRICS International Conference on Measurement and Modeling of Computer Systems, pages 160{169, May 1996. [8] Daniel M. Dias, William Kish, Rajat Mukherjee, and Renu Tewari. A scalable and highly available web server. In COMPCON, pages 85{92, 1996. [9] Peter Druschel and Gaurav Banga. Lazy receiver processing (LRP): A network subsystem architecture for server systems. In Proceedings of OSDI '96, October 1996. [10] James Gwertzman and Margo Seltzer. The case for geographical push-caching. In Proceedgins of HotOS '94, May 1994. [11] Mor Harchol-Balter, Mark Crovella, and Cristina Murta. On choosing a task assignment policy for a distributed server system. IEEE Journal of Parallel and Distributed Computing, 59:204 { 228, 1999. [12] Mor Harchol-Balter and Allen Downey. Exploiting process lifetime distributions for dynamic load balancing. In Proceedings of SIGMETRICS '96, pages 13{24, 1996. [13] A. Iyengar, E. MacNair, and T. Nguyen. An analysis of web server performance. In Proceedings of GLOBECOM '97, 1997. [14] A. Jean-Marie and P. Robert. On the transient behavior of the processor-sharing queue. Queueing Systems: Theory and Applications, 17:129{136, 1994. [15] M. Kaashoek, D. Engler, D. Wallach, and G. Ganger. Server operating systems. In SIGOPS European Workshop '96, pages 141{148, 1996. [16] Dongeun Kim, Cheol Ho Park, and Daeyeon Park. Request rate adaptive dispatching architecture for scalable internet server. [17] Leonard Kleinrock. Queueing Systems, volume II. Computer Applications. John Wiley & Sons, 1976. [18] W. E. Leland and T. J. Ott. Load-balancing heuristics and process behavior. In Proceedings of Performance and ACM Sigmetrics, pages 54{69, 1986. [19] Je�rey C. Mogul. Network behavior of a busy web server and its clients. Technical report, DEC WRL Research Report 95/5, October 1995. [20] Je�rey C. Mogul and K. K. Ramakrishnan. Eliminating receive livelock in an interrupt-driven kernel. In Proc. USENIX 1996 Technical Conference, pages 99{111, 1996. [21] David L. Peterson and David B. Adams. Fractal patterns in DASD I/O tra�c. In CMG Proceedings, December 1996.
23
[22] A. Silberschatz and P. Galvin. Operating System Concepts, 5th Edition. John Wiley & Sons, 1998. [23] W. Stallings. Operating Systems, 2nd Edition. Prentice Hall, 1995. [24] A.S. Tanenbaum. Modern Operating Systems. Prentice Hall, 1992. [25] Ronald W. Wol�. Stochastic Modeling and the Theory of Queues. Prentice Hall, 1989.
24