Journal of Agricultural Science; Vol. 6, No. 3; 2014 ISSN 1916-9752 E-ISSN 1916-9760 Published by Canadian Center of Science and Education
Selenium Application Timing: Influence in Wheat Grain and Flour Selenium Accumulation Under Mediterranean Conditions Sara Rodrigo1, Oscar Santamaria1 & Maria J. Poblaciones1 1
Department of Agronomy and Forest Environment Engineering, University of Extremadura. Avda. Adolfo Suárez s/n, Badajoz, Spain Correspondence: Maria J. Poblaciones, Department of Agronomy and Forest Environment Engineering, University of Extremadura. Avda. Adolfo Suárez s/n, Badajoz, Spain. Tel: 34-924-289-300. E-mail:
[email protected] Received: November 22, 2013
Accepted: December 24, 2013
Online Published: February 15, 2014
doi:10.5539/jas.v6n3p23
URL: http://dx.doi.org/10.5539/jas.v6n3p23
Abstract Millions of people have an inadequate supply of selenium (Se) and Se-biofortified crops could prevent such deficiency. In order to establish an effective Se biofortification program under Mediterranean conditions on wheat, the objective of the present study was to evaluate the effect of the Se application timing on the Se accumulation in the grain, yield and protein content. In a field experiment, ten g ha-1 of sodium selenate were foliar-applied at four different growth stages: at 1st node detectable (GS-31); at 5th node detectable (GS-35); at boots just swollen (GS-45); and at 1st spikelet visible (GS-51), in two different growing seasons, 2010-2011 and 2011-2012. The application of Se between GS-35 and GS-45 produced the highest Se accumulation in grain, especially in humid years. The milling process caused Se losses of about 15%. In the special conditions of the Mediterranean area, a proper timing of Se application might have major importance in the Se accumulation in the grain, but due to the rainfall before application, rather than to the plant growth stage. Keywords: agronomic biofortification, application timing, sodium selenate, cereal, semiarid conditions 1. Introduction Two billion people in the world are thought to suffer from one or more micronutrient deficiencies (FAO, IFAD & WFP, 2012). Among such deficiencies, an inadequate supply of selenium (Se), micronutrient essential for humans and animals, has been associated to a multitude of health disorders, including oxidative stress-related conditions, reduced fertility and immune function, cardiomyopathy, and an increased risk of cancers (Reid et al., 2008; Zeng & Combs, 2008; Rayman, 2012). This deficiency is supported by the studies carried out in Europe by Roman-Viñas et al. (2011), which showed inadequate intake of Se in more than 20% of the population. In this context, the Se intake should be highly increased to reach the recommended values. The European Recommended Dietary Allowance (RDA) of Se for humans is about 55 μg Se day-1 (Elmadfa, 2009). Several authors go further and after carrying out clinical trials, have recommended a regular oral dose of 200 μg Se day-1 of Se to reduce the incidence of certain cancers and other diseases (Arthur, 2003; Reid et al., 2008). Because food consumption provides the principal route of Se intake for most of the population, the Se biofortification of crops has demonstrated to increase the Se in common dietary foodstuff (Broadley et al., 2010) and thus to enhance human nutrition. Among various crops, cereals could constitute a major source of Se as they are consumed in large amounts in the human diet. Among cereals, bread making wheat (Triticum aestivum L.) has a great relevance in Mediterranean areas and it is the most consumed cereal by humans in the European countries. The wheat grain has been shown to contain a wide range of Se concentrations depending on the Se concentration in the soil. In Spain, the Se concentration in the wheat grain derived products (white flour and biscuits) ranges between 30 μg kg-1 and 60 μg kg-1 of Se (Diaz-Alarcon, Navarro-Alarcon, de la Serrana & Lopez-Martinez, 1996); concentrations not enough to accomplish the Se intake recommendations. Most of the Se biofortification studies carried out on wheat have been performed in oceanic or continental areas, with high and regular rainfall and a temperate temperature (Broadley et al., 2010; Stroud et al., 2010). Under semiarid Mediterranean or other similar conditions, characterised by scarce precipitations and irregularity in the rainfall, Se biofortification have shown a different pattern, with a higher accumulation potential, at least in other cereals such as two-rowed barley and hard wheat 23
www.ccsenet.org/jas
Journal of Agricultural Science
Vol. 6, No. 3; 2014
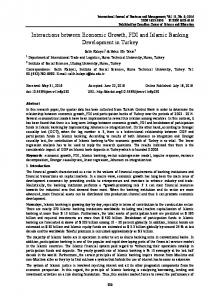
(Rodrigo, Santamaria, Lopez-Bellido, & Poblaciones, 2013; Poblaciones, Rodrigo, Santamaria, Chen, & McGrath, 2014). On bread making wheat, although there are studies in Portugal (Galinha et al., 2013), Australia (Lyons et al., 2004) and New Zealand (Curtin, Hanson, & van der Weerden, 2008), the effect of the Se biofortification under Mediterranean conditions is still poorly understood. Regarding the time of application, many authors (Curtin, Hanson, Lindley, & Butler, 2006; Chu, Yao, Yue, Li, & Zhao, 2013) recommended just one application at stem elongation stage, when the flag leaf ligule/collar is just visible (GS-39 according to the Zadocks scale). That growth stage has been regarded as the most effective one in the later Se accumulation in the grain when several applications moments were evaluated. However most of those studies were performed on pots experiments under glasshouse or in oceanic or continental areas. Due to the different soil, climatic and cropping conditions the application of such experiences under Mediterranean conditions is questionable. Therefore, the main objective of the present study was to evaluate the effect of Se application time on the uptake and later accumulation of Se in grain and flour on bread making wheat, and on the grain yield and protein content, in order to provide the basis for an optimal implementation of a Se biofortification program under Mediterranean conditions. In addition, because in previous studies under Mediterranean conditions, the rainfall occurred during the growing season seemed to play a major role in the accumulation of Se in the grain (Poblaciones, Rodrigo, & Santamaria, 2013), it is also hypothesized and analyzed the importance of the rainfall according to the application time. 2. Materials and Methods 2.1 Study Site Field experiment was conducted in Badajoz, southern Spain (38º54’ N, 6º44’ W, 186 m above sea level), in a Xerofluvents soil under rainfed Mediterranean conditions in 2010-2011 and 2011-2012 growing seasons. Weather-related parameters for this area in the study years, as well as in the average over a 30-year period, are shown in Figure 1. All climate data were taken from a weather station located at the study site. The precipitation was much higher (more than double), during the growing period (from late November to July), in 2010-2011 (492 mm) than in 2011-2012 (248 mm). In 2010-2011, at full flowering (between April and May), there was a severe drought period of about 40 days (in April, most of rainfall occurred during the first 10 days of the month, and in May, rainfall occurred in the final days of the month). In 2011-2012, at tillering (between late January and March) a very dry period took place (Figure 1). Rainfall 120
Total rainfall: 589 mm
Total rainfall: 338 mm
Minimun temperature Total rainfall: 477 mm
60 50
80
40
60
30
40
20
20
10
0
Temperature (ºC)
Rainfall (mm)
100
Maximum temperature
S O N D J F M A M J J A S O N D J F M A M J J A S O N D J F M A M J J A 2010-2011
2011-2012
0
30-years average
Figure 1. Monthly and annual rainfall and mean maximum and minimum temperatures in 2010-2011, 2011-2012 and in an average year from a 30-year period at Badajoz (Spain) 2.2 Experimental Design and Crop Management The study area was sown with bread making wheat, cultivar “Roxo”. Conventional tillage treatment was used to prepare a proper seedbed before sowing. Sowing was made in late December both study years (2010-2011 and 2011-2012), at a rate of 180 kg ha-1 of seeds, in rows of 20 cm. A N-P-K fertilizer (8-15-15) was applied before sowing at a rate of 200 kg ha-1 in all plots. The experiment was arranged as a randomized complete block design with four repetitions. In each block, Se was applied foliarly on dry and sunny days at a dose of 10 g ha-1 of sodium selenate diluted in 3 L of water in one of the following four different moments: (1) at the stem elongation: 24
www.ccsenet.org/jas
Journal of Agricultural Science
Vol. 6, No. 3; 2014
1st node detectable (GS-31); (2) at the stem elongation: 5th node detectable (GS-35); (3) at boots just swollen (GS-45); and (4) at the inflorescence emergence: first spikelet of inflorescence visible (GS-51). Additional plots without any Se application (treatment control) were also performed to be compared with those Se fertilized. The crop area for each Se fertilization treatment and repetition was 15 m2 (3 m × 5 m). The experimental area used each year had not been previously fertilized with Se, therefore a potential residual effect of Se in the soil can be ruled out. 2.3 Soil Analysis Each year, before sowing, four representative soil samples to 30 cm depth were taken from the experimental site. Soil samples were air dried and sieved to < 2 mm using a roller mill. Texture was determined gravimetrically; soil pH was measured using a calibrated pH meter (ratio, 10 g soil: 25 ml deionized H2O), and soil organic matter (SOM) was determined by oxidation by dichromate. Texture, pH and SOM was only determined at the beginning of the experiment. From these soil samples, total Se was determined as follows: a portion of each soil was finely ground (< 0.45 mm) using an agate ball mill (Retch PM 400 mill); 1 g was digested with ultrapure concentrated nitric acid (2 ml) and 30% w/v hydrogen peroxide (2 ml) using a closed-vessel microwave digestion protocol (Mars X, CEM Corp, Matthews, NC), and diluted to 25 ml with ultrapurified water (Adams, Lombi, Zhao, & McGrath, 2002). Sample vessels were thoroughly washed with acid before use. For quality assurance, a blank and a standard (tomato leaf material, NIST 1573a) were included in each batch of samples. Concentrations of Se were determined using an inductively coupled plasma mass spectrometer (ICP-MS) (Agilent 7500ce, Agilent Technologies, Palo Alto, CA, USA) operating in the hydrogen gas mode. These analyses were developed by the Elemental and Molecular Analysis Service of the University of Extremadura (Spain). All the results were reported on a dry weight basis. Extractable Se in the soil samples was determined by using KH2PO4 (0.016 mM, pH 4.8) at a ratio of 10 g dry weight soil: 30 ml KH2PO4 w/v (Zhao & McGrath, 1994). The Se concentration in the extracts was determined by ICP-MS, as described above. 2.4 Grain and Flour Analysis Harvesting took place at crop maturity in early June. Grain yield (expressed as kg ha-1 of grain) and grain protein content were determined. Total N content was determined using the Dumas combustion method (Leco FP-428 analyzer, LECO Corp., Saint Joseph, MI U.S). Grain protein was determined by multiplying the total N by 5.7 as a conversion factor. Total Se contained in the milled grain and in the white flour was determined by ICP-MS as described above for soil samples. Grain was milled with a corundum mill (WolfgangMOC, Germany), and white flour was obtained using a Laboratory Mill CD 1 (Chopin, France). All the results were also reported on a dry weight basis. 2.5 Statistical Analysis The effect of the cropping year (2010-2011 and 2011-2012) on the total and extractable Se into the soil was evaluated by 1-way analysis of variance (ANOVA). Total Se in flour expressed as μg kg-1, Se in grain/Se in flour ratio, grain yield and grain protein were subjected to a 2-way ANOVA, including ‘year’ (2010-2011 and 2011-2012), ‘Se application timing’ (Control, GS-31, GS-35, GS-45, GS-51), and their interaction in the model. When significant differences were found in ANOVA, means were compared using Fisher’s protected least significant difference (LSD) test at P < 0.05. A linear regression was also carried out between the total Se in grain and total Se in flour. In order to evaluate the effect of the weather conditions in the Se accumulation in the grain and flour, Pearson correlation tests, including the data of the two years and of the four application moments, were performed between total Se (in grain and in flour) and the following climate related parameters: (1) the number of days without rain after Se application, (2) the number of days without rain before Se application, (3) the amount of rainfall from seeding to Se fertilization, (4) the amount of rainfall from Se fertilization to harvesting, (5) the amount of rainfall during the 10 days before the Se fertilization, and (6) and the amount of rainfall during the 10 days before and 10 days after the Se fertilization. All these analyses were performed with the Statistix v. 8.10 package. 3. Results 3.1 Soil Properties of the Field Sites The soil of the experimental area had a loamy texture, with a pH of 7.0 ± 0.13 (mean ± standard error), and a soil organic matter (SOM) of 9.9 ± 0.13 g kg-1. According to ANOVA there was not a significant effect of the year on total Se in the topsoil (degree of freedom (df) = 1, P = 0.055), with values of 137.2 ± 6.5 μg kg-1 in
25
www.ccsenet.org/jas
Journal of Agricultural Science
Vol. 6, No. 3; 2014
2010-2011 and 121.2 ± 6.9 μg kg-1 in 2011-2012. Extractable Se, was neither significantly affected by the growing season (df = 1, P = 0.315), and was 2.6 ± 0.3 μg kg-1 in 2010-2011 and 3.3 ± 0.4 μg kg-1 in 2011-2012. 3.2 Effects of Se Application Timing on Grain Yield and Protein Content Grain yield and grain protein content were significantly affected by the year. Grain protein was also affected by the Se application timing (Table 1). As the interaction between yearxtiming was not significant, the main effects could be analyzed separately. In 2011-2012, it was obtained the highest grain yield and the lowest protein content values (Table 2). Regarding Se timing, when Se was applied at the earliest stages, i.e. at the stem elongation (GS-31 and GS-35), the protein content was higher than when it was applied later, regardless of the growing year (Table 2). Table 1. ANOVA table showing the effect of the year, Se application timing and their interaction on the total Se in flour (μg kg-1), total Se in grain and flour ratio, grain yield (kg ha-1) and grain protein content (%) DF
Total Se flour
Total Se grain/Total Se flour
Grain yield
Grain protein
Year
1
638.46***
0.66
1229.75***
168.25***
Timing
3
55.27***
1.68
1.07
7.73***
Year x Timing
3
13.13***
0.53
0.17
1.72
DF: degree of freedom. F values, including the level of significance (*** P< 0.001), are shown in the rest of the columns. Table 2. Mean ± standard error in total Se in flour, grain protein content and grain yield as affected by Se timing (control: without Se fertilization; Se fertilization at growth stages GS-31, GS-35, GS-45, and GS-51 according to Zadocks scale) and year Timing Control
Total Se flour (μg kg-1)
Grain yield (kg ha-1)
Grain protein (%)
2010-2011
2011-2012
Mean
2010-2011
2011-2012
Mean
2010-2011
2011-2012
Mean
55 ± 10D
30 ± 5B
42 ± 7D
15.5 ± 0.3
14.1 ± 0.7
14.8 ± 0.4A
1198 ± 44
1967 ± 83
1583 ± 110
GS-31
730 ± 41aB 293 ± 36bA
512 ± 85B
15.6 ± 0.2
13.0 ± 0.1
14.3 ± 0.5A 1274 ± 106
2022 ± 93
1648 ± 113
GS-35
897 ± 60aA 318 ± 46bA
607 ± 94A
15.2 ± 0.1
13.2 ± 0.2
14.2 ± 0.4A 1292 ± 110
1962 ± 86
1627 ± 102
GS-45
860 ± 92aA 326 ± 13bA 593 ± 108AB
14.3 ± 0.4
12.6 ± 0.2
13.4 ± 0.4B
1314 ± 48
2094 ± 70
1704 ± 112
GS-51
519 ± 68aC 257 ± 13bA
14.7 ± 0.3
12.1 ± 0.1
13.4 ± 0.5B
1340 ± 81
2082 ± 32
1711 ± 107
Mean
612 ± 74a
245 ± 275b
388 ± 58C
15.1 ± 0.1a 13.0 ± 0.2b
1284 ± 30b 2025 ± 28a
For each parameter, averages in the same row, with different lowercase letters mean significantly affected by year (P< 0.05) according to LSD test. Averages in the same column, with different uppercase letters are significantly affected by Se application timing (P< 0.05) according to LSD test. When letters do not appear, differences were not significant according to ANOVA. 3.3 Total Se Uptake and Accumulation in the Grain and in the Flour The total Se contained in flour, referred to μg kg-1 DW, was significantly affected by the year, application timing and their interaction (Table 1). The Se fertilization, regardless of the application timing and the study year, increased at a great extent the Se concentration in the flour (Table 2) in relation with the control (on average, 525 vs. 42 μg kg-1 DW). The effect of the Se application timing on the Se accumulation in the flour was regarded to the year. Whilst in the driest year (2011-2012) it was not significantly affected by the application time, in the most humid year (2010-2011), the highest Se accumulation values were obtained when the fertilizer was applied at GS-35 and in GS-45 (Table 2). The ratio total Se in the grain/total Se in the flour, which indicates the loss of Se during the milling process, was not significantly affected by any of the studied variables (Table 1). The relationship between the total Se in grain and the total Se in flour was linear and highly significant with a Se in grain/Se in flour ratio of 1.15 (Figure 2).
26
www.ccsenet.org/jas
Journal of Agricultural Science
Total Se grain 1500 [μg kg-1]
Vol. 6, No. 3; 2014
y = 1.1961x – 19.229 R² = 0.9681***
1200 900 600
Grain/Flour Ratio = 1.15
300 0 0
300
600
900
1200
Total Se flour [μg kg-1]
Figure 2. Total Se in grain (μg kg-1 DW) expressed as a linear relationship of the total Se in flour (μg kg-1 DW). Level of significance: *** P< 0.001 3.4 Influence of Rainfall Parameters on Total Se in the Grain and Flour Considering the pooled data of the two study years and the four application times, both total Se in the flour and total Se in the grain correlated positive (R2 = 0.63/0.65) and significantly with the number of days before the Se application without rainfall, and negatively (R2 = -0.76/-0.78) with the amount of rain fallen during the ten days before Se application (Table 3). Table 3. Correlation coefficients (R2) obtained in the Pearson correlation tests performed between both the total Se in the flour and the total Se in the grain and each one of several weather-related parameters. Days without rain before Se application
Days without rain after Se application
Amount of rain from sowing to Se application
Amount of rain from Se application to harvesting
Amount of rain during the 10 days before application
Amount of rain during the 10 days before and after application
Total Se flour
0.634**
0.083
0.132
0.393
-0.756**
0.145
Total Se grain
0.649**
0.113
0.112
0.437
-0.778**
0.102
** Significant correlation at a level P< 0.01. 4. Discussion 4.1 Se Content in Soil Based on the classification given by Hawkesford and Zhao (2007) the soils of the experimental area could be considered as deficient-marginal in Se, regardless it was obtained as total or extractable Se. These soils might not be able then to provide crop products with enough Se to accomplish the Se intake recommendations, as discussed by Poblaciones et al. (2013) and Rodrigo et al. (2013) in two similar studies conducted on field pea and two-rowed barley in the same area. Under such conditions of deficient Se availability, the introduction of a Se biofortification program might be indicated. The lack of significant effect of the year on total and extractable Se in the topsoil might indicate that further differences in the studied parameters relating to Se content in grain and flour between years could be mainly attributed to climatic variability rather than soil. 4.2 Effects of Treatments on Grain Yield and Grain Protein Content As it is well known in rainfed conditions, precipitation is a key factor in the crop yield. Although in 2010-2011 the precipitation was higher than in 2011-2012, the severe and prolonged drought occurring during 2010-2011 at full flowering might be the cause of the lower grain production and higher protein content, probably due to a dilution effect. Grain yield was not affected by the Se application timing, in clear agreement with Ducsay and Ložek (2006). In contrast, Chu et al. (2013) found that, when Se was applied at joining-heading and
27
www.ccsenet.org/jas
Journal of Agricultural Science
Vol. 6, No. 3; 2014
heading-blooming stages, the grain yield was much higher than it was applied at other stages. However, such study was carried out in much more humid conditions and Se was applied as sodium selenite (instead selenate). Those two relevant differences could explain such disagreement. Regarding protein content, it was higher when Se was applied at the earliest stages, regardless the growing year. It is known the toxicity of Se for the plants at very high concentrations into the soil (Hermosillo-Cereceres et al., 2011). Although in our case a serious toxicity problem might by unlikely due to the initial low Se values into the soil, and the very small dose of Se used in the fertilization, a slight toxicity could affect at some extent the plant protein synthesis or the efficiency of the N absorption by roots. According to the results, as at the earliest stages the protein content was not different than in controls, such slight toxicity only might affect at the latest stages. In any case, the differences in the protein content due to Se timing, although significant, were quite lower than those caused by the climatic conditions. Therefore their relevance could be considered as low in terms of management. 4.3 Total Se in the Grain and in the Flour Due to the higher grain yield obtained in 2011-2012, a possible dilution effect could be the responsible of the lower Se concentration obtained that year. However, when data were referred to mg ha-1 (multiplying the total Se in μg kg-1 of Se by the grain yield) to take into account that possible dilution effect, the amount of Se in the flour was also much higher in 2010-2011 than in 2011-2012 (786 vs. 496 mg ha-1 DW, respectively). Therefore, in this case, rather than a dilution effect, it could be hypothesized that the lower the water availability, the lower the uptake, and consequently the smaller the Se accumulation in the grain. A significant and positive correlation between grain Se concentration and the amount of precipitation during the growing season have been already indicated (Johnson, 1991). Such hypothesis is also in agreement with the stated by Rodrigo et al. (2013) in two-rowed barley and Poblaciones et al. (2013) in field pea, who obtained similar results under similar conditions when Se was also applied as sodium selenate. Hence, the irregular precipitations typical of the Mediterranean conditions may prompt differences in the uptake and accumulation of Se in the grain after fertilization. Consequently, special attention to this irregularity should be paid in order to get a Se biofortification as effective as possible. In the most humid year, the Se accumulation in the grain was higher when the fertilizer was applied at GS-35 and in GS-45. This result was in line with the general recommendation (application at GS-39 stage, at stem elongation) given for humid regions in temperate climates, such as those in central and northern Europe. In a similar study carried out on winter wheat (Ducsay & Ložek, 2006), when Se fertilizer was applied at the GS-29 stage at a dose of 10 g ha-1, the Se concentration in the grain was much lower than that obtained in the present study. Although several other parameters could have affected such lower Se concentration in the grain, a very early application does not seem to be the most convenient. Other authors have reported a better Se accumulation when Se was applied at flowering stage (Curtin et al., 2006) or even at grain filling (Chu et al., 2013). However, these studies were conducted in more humid regions or in irrigated crops. In our Mediterranean conditions it does not seem convenient such so late applications, as the accumulation of Se in the grain was significantly reduced when applications were performed later than at the boot stage, which is in agreement with the stated by Lyons et al. (2004) in a study on Se biofortification conducted in South Australia on wheat. The ratio total Se in the grain/total Se in the flour gives information about how much Se is lost during the milling process. Milling is considered as a critical process affecting the concentration of Se on wheat grain (Cubadda, Aureli, Raggi, & Carcea, 2009). Because bran (pericarp, seed coat and aleurone) and germ are removed in the milling process, the value of 1.15 may indicate that about 15% of the selenium in the grain was accumulated in the bran and germ. Similar losses in the milling process were found by Hart et al. (2011) in bread making wheat (Se loss of about 13%) and Cubadda et al. (2009) in durum wheat (Se loss of about 16%). The loss of Se during the milling process was constant regardless the Se application time. This fact could indicate that the distribution of Se within the grain, i.e. in the bran, germ and endosperm, was not affected by the moment in which Se was provided to the plant. 4.4 Influence of Rainfall Parameters on Total Se in the Grain and Flour According to the results, it seems clear that the rainfall in the previous days before the Se application was the key factor affecting the absorption and later accumulation of Se into the plant, at least when Se was provided as foliar application. In fact, the highest accumulation of Se in the flour during 2010-2011, when Se was applied at the GS-35 and GS-45 stages, agreed precisely to the application carried out with the lowest amount of rainfall during the 10 days before the Se application. This fact could be explained by the high and negative osmotic potential which may occur in the plant under such dry conditions. In this situation, the plant may absorb eagerly and very efficiently through the stomata the Se fertilizer applied, reducing greatly the loss of Se. Therefore, the
28
www.ccsenet.org/jas
Journal of Agricultural Science
Vol. 6, No. 3; 2014
importance of the moment of the Se application on the Se accumulation in the grain and flour could be mainly attributed to the rainfall before the application, rather than to the exact growth stage of the plant. A lower amount of rain in this period led to a higher Se accumulation in the grain. 5. Conclusion The application of Se between the GS-35 and the GS-45 stages according to the Zadocks scale produced the highest accumulation of Se in the grain and in the flour, especially in humid years. However, the rainfall of the growing season seemed to play a very important role in the accumulation of Se in the grain, even more important than the exact growth stage of the plant in the application time. The milling process produced a loss of Se of about 15%, which was not affected by the Se application time. Therefore according to our results, the general recommendations given for the Se biofortification management under humid or temperate climates would be mostly adequate under Mediterranean conditions. However, special attention should be paid to the precipitation as clearly affected the absorption and later accumulation of Se in the grain, especially the rainfall during the ten days before the application. A lower amount of rain in this period led to a higher Se accumulation in the grain. Bread making wheat would be thus a suitable candidate to be included in Se biofortification programs under Mediterranean conditions. The foodstuff derived from its grain could efficiently increase the Se content in the human food chain. Acknowledgments This study was funded by the University of Extremadura through program “Plan de Iniciación a la Investigación, Desarrollo Tecnológico e Innovación 2011”. References Adams, M. L., Lombi, E., Zhao, F. J., & McGrath, S. P. (2002). Evidence of low selenium concentrations in UK bread-making wheat grain. Journal of the Science of Food and Agriculture, 82, 1160-1165. http://dx.doi.org/10.1002/jsfa.1167 Arthur, J. R. (2003). Selenium supplementation: does soil supplementation help and why? Proccedings of the Nutrition Society, 62, 393-397. http://dx.doi.org/10.1079/PNS2003254. Broadley, M. R., Alcock, J., Alford, J., Cartwright, P., Foot, I., Fairweather-Tait, S. J., … Zhao, F. J. (2010). Selenium biofortification of high-yielding winter wheat (Triticum aestivum L.) by liquid or granular Se fertilization. Plant and Soil, 332, 5-18. http://dx.doi.org/10.1007/s11104-009-0234-4 Chu, J., Yao, X., Yue, Z., Li, J., & Zhao, F. J. (2013). The effects of selenium on physiological traits, grain selenium content and yield of winter wheat at different development stages. Biological Trace Element Research, 151, 434-440. http://dx.doi.org/ 10.1007/s12011-012-9575-6. Cubadda, F., Aureli, F., Raggi, A., & Carcea, M. (2009). Effect of milling, pasta making and cooking on minerals in durum wheat. Journal of Cereal Science, 49, 92-97. http://dx.doi.org/10.1016/j.jcs.2008.07.008 Curtin, D., Hanson, R., Lindley, T. N., & Butler, R. C. (2006). Selenium concentration in wheat (Triticum aestivum L.) grain as influenced by method, rate, and timing of sodium selenate application. New Zealand Journal of Crop and Horticultural Science, 34, 329-339. http://dx.doi.org/10.1080/01140671.2006.9514423 Curtin, D., Hanson, R., & van der Weerden, T. J. (2008). Effect of selenium fertilizer formulation and rate of application on selenium concentrations in irrigated and dryland wheat (Triticum aestivum L.). New Zealand Journal of Crop and Horticultural Science, 36, 1-7. http://dx.doi.org/10.1080/01140670809510216 Diaz-Alarcon, J. P., Navarro-Alarcon. M., de la Serrana, H. L. G., & Lopez-Martinez, M. C. (1996). Determination of selenium in cereals, legumes and dry fruits from southeastern Spain for calculation of daily dietary intake. Science of Total Environment, 184, 183-189. http://dx.doi.org/10.1016/0048-9697(96)05079-6. Ducsay, L., & Ložek, O. (2006). Effect of selenium foliar application on its content in winter wheat grain. Plant, Soil and Environment, 52, 78-82. Elmadfa, I. (2009). The European Nutrition and Health Report. Forum of Nutrition, Vienna, 62. FAO, IFAD, & WFP. (2012). The State of Food Insecurity in the World: Economic growth is necessary but not sufficient to accelerate reduction of hunger and malnutrition. The Food and Agriculture Organization of the United Nations, Rome. Galinha, C., Freitas, M. do C., Pacheco, A. M. G., Coutinho, J., Macas, B., & Almeida, A. S. (2013). Selenium supplementation of Portuguese wheat cultivars through foliar treatment in actual field conditions. Journal of Radioanalytical and Nuclear Chemistry, 297, 227-231. http://dx.doi.org/10.1007/s10967-012-2372-z 29
www.ccsenet.org/jas
Journal of Agricultural Science
Vol. 6, No. 3; 2014
Hart, D. J., Fairweather-Tait, S. J., Broadley, M. R., Dickinson, S. J., Foot, I., Knott, P., ... Hurst, R. (2011). Selenium concentration and speciation in biofortified flour and bread: Retention of selenium during grain biofortification, processing and production of Se-enriched food. Food Chemistry, 126, 1771-1778. http://dx.doi.org/ 10.1016/j.foodchem.2010.12.079 Hawkesford, M. J., & Zhao, F. J. (2007). Strategies for increasing the selenium content of wheat. Journal of Cereal Science, 46, 282-292. http://dx.doi.org/10.1016/j.jcs.2007.02.006. Hermosillo-Cereceres, M. A., Sanchez-Chavez, E., Balandran-Quintana, R. R., Mendoza-Wilson, A. M., Guevara-Aguilar, A., ... Garcia-Banuelos, M. L. (2011). Ionome variation in bean plant growth under different Se forms and application rates. Journal of Food Agriculture and Environment, 9, 374-378. Johnson, L. (1991). Trends and annual fluctuations in selenium concentrations in wheat grain. Plant and Soil, 138, 67-73. http://dx.doi.org/10.1007/BF00011809 Lyons, G., Lewis, J., Lorimer M. F., Holloway, R. E., Brace, D. M., Stangoulis, J. C., & Graham, R. D. (2004). High-selenium wheat: agronomic biofortification strategies to improve human nutrition. Food, Agriculture & Environment, 2, 171-178. Poblaciones, M. J., Rodrigo. S. M., & Santamaria, O. (2013). Evaluation of the potential of peas (Pisum sativum L.) to be used in Selenium biofortification programs under Mediterranean conditions. Biological Trace Element Research, 151, 132-137. http://dx.doi.org/10.1007/s12011-012-9539-x Poblaciones, M. J., Rodrigo, S. M., Santamaria, O., Chen. Y., & McGrath. S. P. (2014). Agronomic selenium biofortification in Triticum durum under Mediterranean conditions: From grain to cooked pasta. Food Chemistry, 146, 378-384. http://dx.doi.org/10.1016/j.foodchem.2013.09.070. Rayman, M. P. (2012). Selenium and human http://dx.doi.org/10.1016/S0140-6736(11)61452-9
health.
The
Lancet,
379,
1256-1268.
Reid, M. E., Duffield-Lillico, A. J., Slate, E., Natarajan, N., Turnbull, B., Jacobs, E., … Marshall, J. R. (2008). The nutritional prevention of cancer: 400 Mcg per day selenium treatment. Nutrition and Cancer, 60(2), 155-163. http://dx.doi.org/10.1080/01635580701684856. Rodrigo, S., Santamaria, O., Lopez-Bellido, F. J., & Poblaciones, M. J. (2013). Agronomic selenium biofortification of two-rowed barley under Mediterranean conditions. Plant, Soil and Environment, 59, 115-120. Roman-Viñas, B., Ribas-Barba, L., Ngo J., Gurinovic, M., Novakovic, R., Cavelaars, A., … Serra-Majem. L. (2011). Projected Prevalence of Inadequate Nutrient Intakes in Europe. Annuals of Nutrition and Metabolism, 59, 84-95. http://dx.doi.org/10.1159/000332762 Stroud, J. L., Li, H. F., Lopez-Bellido, F. J., Broadley, M. R., Foot, I., Fairweather-Tait, S. J., ... Zhao, F. J. (2010). Impact of sulphur fertilisation on crop response to selenium fertilisation. Plant and Soil, 332, 31-40. http://dx.doi.org/10.1007/s11104-009-0230-8. Zeng, H., & Combs, G. F. (2008). Selenium as an anticancer nutrient: roles in cell proliferation and tumor cell invasion. Journal of Nutrition Biochemistry, 19, 1-7. http://dx.doi.org/10.1016/j.jnutbio.2007.02.005 Zhao, F. J., & McGrath, S. P. (1994). Extractable sulphate and organic sulphur in soils and their availability to plants. Plant and Soil, 164, 243-250. http://dx.doi.org/10.1007/BF00010076 Copyrights Copyright for this article is retained by the author(s), with first publication rights granted to the journal. This is an open-access article distributed under the terms and conditions of the Creative Commons Attribution license (http://creativecommons.org/licenses/by/3.0/).
30