University of Pennsylvania
ScholarlyCommons Center for Human Modeling and Simulation
Department of Computer & Information Science
2007
Semantic Segmentation of Motion Capture Using Laban Movement Analysis Durell Bouchard University of Pennsylvania,
[email protected]
Norman I. Badler University of Pennsylvania,
[email protected]
Follow this and additional works at: http://repository.upenn.edu/hms Part of the Engineering Commons, and the Graphics and Human Computer Interfaces Commons Recommended Citation Bouchard, D., & Badler, N. I. (2007). Semantic Segmentation of Motion Capture Using Laban Movement Analysis. Proceedings of the 7th International Conference on Intelligent Virtual Agents, 4722 37-44. http://dx.doi.org/10.1007/978-3-540-74997-4_4
This paper is posted at ScholarlyCommons. http://repository.upenn.edu/hms/211 For more information, please contact
[email protected].
Semantic Segmentation of Motion Capture Using Laban Movement Analysis Abstract
Many applications that utilize motion capture data require small, discrete, semantic segments of data, but most motion capture collection processes produce long sequences of data. The smaller segments are often created from the longer sequences manually. This segmentation process is very laborious and time consuming. This paper presents an automatic motion capture segmentation method based on movement qualities derived from Laban Movement Analysis (LMA). LMA provides a good compromise between high-level semantic features, which are difficult to extract for general motions, and low-level kinematic features which, often yield unsophisticated segmentations. The LMA features are computed using a collection of neural networks trained with temporal variance in order to create a classifier that is more robust with regard to input boundaries. The actual segmentation points are derived through simple time series analysis of the LMA features. Keywords
human motion, motion capture, motion segmentation, Laban movement analysis Disciplines
Computer Sciences | Engineering | Graphics and Human Computer Interfaces
This book chapter is available at ScholarlyCommons: http://repository.upenn.edu/hms/211
Semantic Segmentation of Motion Capture Using Laban Movement Analysis Durell Bouchard and Norman Badler Center for Human Modeling and Simulation, University of Pennsylvania 200 S. 33rd St. Philadelphia, PA 19104, USA
[email protected] [email protected] http://cg.cis.upenn.edu/hms/
Abstract. Many applications that utilize motion capture data require small, discrete, semantic segments of motion capture data, but most motion capture collection processes produces long sequences of motion capture data. The smaller segments are often created from the longer sequences manually. This segmentation process is very laborious and time consuming. This paper presents an automatic motion capture segmentation method based on movement qualities derived from Laban Movement Analysis (LMA). LMA provides a good compromise between high-level semantic features which are difficult to extract for general motions and low-level kinematic features which often yield unsophisticated segmentations. The LMA features are computed using a collection of neural networks trained with temporal variance in order to create a classifier that is more robust with regard to input boundaries. The actual segmentation points are derived through simple time series analysis of the LMA features over. Key words: human motion, motion capture, motion segmentation, LMA
1
Introduction
The increasing popularity of 3D computer generated animation in television, movies, and video games coupled with the decreasing cost of motion capture production are driving a need for more sophisticated tools to process and analyze motion capture data. Many of these motion capture tools, such as gesture recognition, gait analysis, and motion retargeting, require small, discrete, semantically sophisticated segments of input motion capture in order to function properly. However, in order to create quality motion capture data efficiently, capture sessions typically produce long streams of motion capture data. The solution is to preprocess the long motion capture data stream by breaking it up into short segments that are appropriate for an analysis tool. This process is often done manually, but it is a very laborious and time consuming process. A better solution is to create tools that automate the segmentation process. Automated segmentation is also more deterministic than manual segmentation due to low interannotator and intra-annotator agreement in manual segmentation. An automatic segmentation program will produce the same segmentation
2
D. Bouchard, N. Badler
7
0.8
6
0.7
5
0.6
4
0.5 Error
number of segment points
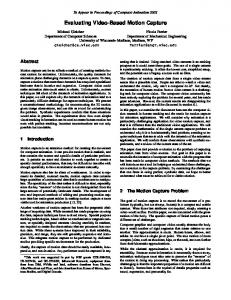
given the same input motion capture. Different people given the same motion capture data, on the other hand, will produce different segmentations. In addition a person will produce a different segmentation given the same input motion capture data. Figure 1 shows the result of having one person segment 3 different groups of motion capture data 6 times each. The median of each segment boundary was computed and then the distance of each boundary from the median was computed and graphed as a histogram. The result is a standard deviation of 15.4 frames or about a half a second. The annotator agreements can be increased if the motion capture sample rate is decreased, however, it will also introduce shift error into the segment points. The performance of some classifiers is dependent on the selection of segment points. Figure 2 shows the effect of changing the segment boundaries on the performance of a neural net. A shift of five frames of the segment boundaries can change the error rate from 15% to 55%. Deterministic segmentation, and therefore automated segmentation, can improve the performance of classifiers.
3
0.4
2
0.3
1
0.2
0
0.1 0
10
20
30
40 frame
50
60
70
80
Fig. 1. Manual Segmentation Boundary Deviance Histogram
0
1
2
3
4
5
6
7
8
9
Shift
Fig. 2. Classifier Performance
To segment motion capture data is to produce a collection of smaller motion capture data segments that consist of contiguous portions of the original motion capture data. A semantic segmentation is a high-level segmentation, where segments correlate to a semantic labeling of the motion, such as throwing a ball hard. A kinematic segmentation is a low-level segmentation, where segments correlate to a kinematic description of a motion, such as a high velocity sagittal motion. The generality of motion capture data refers to the diversity of motions. General motion capture consists of any motion that can be performed by a person. Motion capture that is not general is limited to classes of motions such as locomotion or dancing. Current methods of automatic motion capture segmentation tend to either be effective for general motions, but do not produce semantic segmentations, or produce semantic segmentations, but are not useful for general motions. The goal of automatic motion capture segmentation is to produce semantic segmentation of general motion capture data.
Semantic Segmentation of Motion Capture
3
A na¨ıve solution to the segmentation problem is to create a classifier and apply it to all possible segments. Any segments that are properly classified are considered segments. There are multiple problems with this approach. The first is that it would be extremely slow. The second is that it requires an extremely sophisticated classifier. The classifier must be robust enough to take poorly segmented data as an input. This is difficult because the performance of a classifier is dependent on the quality of the segmentation of its input. The problem is a paradox where recognition requires segmentation and segmentation requires recognition.
2
Related Work
Many motion capture segmentation methods are based on changes in low-level kinematic features. Fod et al. [3] implement two different segmentation methods that utilize angular velocity in four different degrees of freedom in the arm. The first method chooses segments such that at least two degrees of freedom have zero velocity within three milliseconds of both the beginning and end of every segment. The second method tracks the sum of the four degrees of freedom’s angular velocity and determines segment boundaries when the value drops below an experiment based threshold. Osaki et al. [8] and Shiratori et al. [10] also use velocity in segmentation calculation. They calculate the linear velocity of a hand relative to the waist. Segment boundaries are velocity local minima with the added constraints that initial and ending velocity must be under some threshold, and the maximal velocity must exceed some threshold. Zhao and Badler [14] calculate segment boundaries when hand linear acceleration zero crosses and curvature is above some threshold. Wang et al. [12] determine segment boundaries as when the velocity of a hand is below a threshold at the same time as the curvature of the hand is above a threshold. Jenkins and Matari´c [4, 5] use a method called kinematic centroid segmentation. The segments are calculated in-line by finding a local maximum of the distance between the centroid of an arm’s markers for the first frame and the centroid of each following frame. These kinematic methods are extremely efficient, however, they produce simple low-level segmentations. There are motion capture segmentation methods that produce more highlevel segmentations than the kinematic methods above by using techniques from time series database analysis. Barbiˇc et al. [1] implement two different segmentation methods that are based on data compression. The first method segments where the projection error resulting from Principal Component Analysis (PCA) increases on incrementally larger segments of motion capture data. The second method segments by tracking changes in the distance of fitting a small segment of motion capture data to a Gaussian distribution model of the frames that precede the segment. Li et al. [13] use a similar method where segments are chosen such that they can be represented with the fewest number of linear dynamic systems. Another data analysis method, clustering, is also useful for segmenting motion capture data. When clustering is applied to motion capture segmentation the assumption is that frames of neighboring segments belong to separate clus-
4
D. Bouchard, N. Badler
ters. Barbiˇc et al. [1] employ expectation minimization to estimate the Gaussian Mixture Model (GMM) that corresponds to a cluster, while Lee and Elgammal [7] use k-means to estimate the GMM. These time series analysis based methods produce more high-level segmentations than the kinematic methods produce, but they do not utilize semantic content of the motion on which they operate. It is possible to capture some of the complexity and flexibility of decision making present in manual motion capture segmentation by using supervised learning. Kahol et al. [6] use a na¨ıve Bayesian classifier in order to derive choreographer segmentation profiles of dance motion capture sequences. Starner and Pentland [11] and Bregler [2] implement implicit segmentation through the use of Hidden Markov Models (HMM) trained with manually segmented data. These learning based segmentation methods are difficult to implement for general motion. In the above two examples Kahol et al. perform tests on motion capture of dance, Starner and Pentland to sign language gestures, and Bregler to gait. Creating a general classifier for all motions is difficult because as the class of motions that can potentially be classified grows so does the number of training examples needed. In the case of a truly general classifier the number of training motions would be enormous.
3
Hypothesis and Model
The learning based segmentation methods have the ability to create semantic segmentations, but the implementation is not feasible for general motion capture data. The above methods avoid this problem by eliminating the requirement of general motion capture and using a class of motions, such as dance, sign language, and gait. A different solution would be to use a classifier that operates on a smaller set of classes, but is effective on general motions. In order for a segmentation based on this type of classifier to be useful the subset of classes must be present in all motions, significant in meaning, and practical to classify. A classification that fits these critera is Laban Movement Analysis (LMA) Effort classification. LMA is a rigorous system of movement study which describes motion as a combination of four components: Body, Effort, Shape, and Space. Body, Shape, and Space define what motion is performed while Effort describes how a motion is performed. The Effort component is related to a person’s intention and is itself composed of four different motion parameters: Space, Weight, Time, and Flow. Each parameter is a continuum between diametric extremes. The extremes of the four Effort parameters are summarized in Table 3. The Effort of any motion can be described as four values on the four different Effort dimensions.
4
Method
The advantage of LMA Effort as a basis for motion capture segmentation is that it is more meaningful than kinematic features, so it has the potential to create more semantic segmentations, and it is easier to compute for general motions
Semantic Segmentation of Motion Capture
5
Table 1. LMA Effort Elements Space Time Weight Flow Indulging Indirect Sustained Light Free Condensing Direct Sudden Strong Bound
than semantic features, so it can be applied to general motion. In order to test the hypothesis that LMA Effort is useful in segmenting general motion capture, a classifier must be constructed and used to segment a collection of general motions. 4.1
LMA Effort Classifier
The classifier implemented is based on the LMA classification work of Zhao and Badler [14], and is a set of four neural networks, one for each LMA Effort parameter, which outputs three values between 0 and 1 for indulging, neutral, and condensing. The first step in creating the neural networks was to collect the training motion capture data. In order to accomplish this two LMA experts assisted in creating a repertoire of motions that span a set of primitive motions defined in LMA. The motions are summarized in Table 4.1. Each of the 12 motions was performed in 12 times in order to isolate and emphasize the 4 different LMA Effort parameters, Space, Time Weight, and Flow, and at 3 intensities, condensing, neutral, and indulging. In total 288 different motions were captured using Ascension Technology’s active optical motion capture system, the ReActor. The system tracks 30 markers at 30 Hz. with an accuracy of 3 mm. The 288 motions were segmented using a hybrid of kinematic and manual segmentation, where manually selected segment points were limited to those with high curvature to increase the consistency of the segmentation. In order to improve the performance of the neural networks kinematic features were extracted from the segmented motion capture data. The first step in this process was to normalize the motion capture data as a means to account for the difference in size and orientation of the two LMA experts. The marker locations of every frame of every segment of motion capture were translated, rotated, and scaled. They were translated such that the sternum marker was located at the origin and rotated about the vertical axis such that the saggital planes were aligned. The marker locations were scaled by a factor which was estimated by averaging distances between joints that remain fairly constant such as the elbow and the shoulder. In order to abstract the motions from positional information the kinematic time series in Table 4(b) were computed for each of the markers in Table 4(a). Experiments showed that some subsections of these kinematic time series were more important than others. For example the Flow parameter is very dependent on the end of a motion, while the Time parameter is sensitive to the beginning of the motion. Therefore, several weighted masks, summarized in Table 4(c), were applied to each kinematic time series. Lastly the
6
D. Bouchard, N. Badler Table 2. Neural Network Training Motions Direction forward downward upward downward horizontal horizontal diagonal diagonal sagittal sagittal backward “glide”
Space mid-reach mid-reach mid-reach near-reach mid-left mid-right mid-left mid-right mid-reach mid-reach far-reach far-reach
Form spoke-like spoke-like spoke-like spoke-like arc-like circular arc-like arc-like arc-like spoke-like circular transverse
set of scalar kinematic features in Table 4(d) were computed from each of the weighted time series. In total 4788 different features were calculated. This was still too many features for a an effective neural network, and many of the features were redundant or ineffective. In order to select the most salient features a method from Ruck et al. [9] was implemented. The method associates feature saliency with changes in the weights of the hidden layers of the neural networks during training. The result is a numerical score of the saliency of every feature. A sorted plot of the computed saliency values, Fig. 3, shows an exponential drop around the 100 most salient features. However, the 100 most salient features do not necessarily correlate to the best performing neural net. Figure 4 is a plot of the performance of the four neural networks versus an increasing number of the most salient features. This plot demonstrates that when the number of training samples is fixed the neural network performance can be degraded if there are too many inputs. The apexes of the curves in Fig. 4 were used to determine the number of inputs for each neural network. The Space, Time, Weight, and Flow neural networks had 84, 72, 75, and 57 inputs respectively. In order to further optimize the performance of the neural networks PCA was performed on these inputs, in order to create a set of inputs with 95% variance, which reduced the number of inputs to 36, 23, 33, and 25. Finally, the optimum number of hidden layer units was determined by performing PCA on the hidden layer weights. The average performance of the neural networks is summarized in Table 4.1. The neural networks performed more poorly than expected on data that they were not trained on, due to error induced by manual segmentation boundary shift in the test data. When the neural networks are tested on the data they were trained on there is no perturbation in the segment boundary points. However, as was demonstrated in the introduction, the performance of a motion capture classifier is very sensitive to test data boundary points, and manual segmentation produces irregular boundary points. Experiments showed that the majority of
Semantic Segmentation of Motion Capture
Table 4. Neural Network Input Features (a) Markers right wrist right elbow right shoulder sternum right arm centroid
(b) Kinematic Time Series displacement velocity acceleration zero crossing distance from start distance from end distance from sternum distance from shoulder curvature torsion
(c) Weight front back center even zero crossing boundary
(d) Scalar average maximum minimum sum
100
1
90
80
0.8
percent correct
saliency
70
0.6
0.4
60
50
40
30
0.2 20
0
0
500
1000
1500
2000 features
2500
3000
3500
10
0
10
20
30
40
50 60 number of inputs
70
80
90
100
Fig. 3. Neural Network Input Saliency Fig. 4. Neural Network Performance
7
8
D. Bouchard, N. Badler
boundary shift error occurs within a window of 11 frames. In order to minimize the error due to segment boundary inconsistencies, 121 sets of neural nets were trained with motion capture data with all permutations of boundary points shifted at most 5 frames. Then every test motion capture segment’s boundaries were shifted in the same 121 ways and the output of the 121 neural networks was summed for a final output. The result, summarized in Table 4.1, is a reduction in the difference between training data error and test data error from 26.2% to 4.3%. Table 4. Neural Network Average Percent Correct Static Boundary Variant Boundary Training Data Test Data Training Data Test Data 91.2% 65.0% 92.3% 88.0%
4.2
Segmentation Determination
Once the neural networks were trained the final step was to incorporate them into a segmentation scheme. Using the neural networks to find segments by exhaustive search yielded many false positives. In a 25 second test motion capture sequence, that consists of a person repeatedly throwing a ball, the result of applying the neural networks to all segments between 2/3 and 3 1/3 seconds is 26,493 segments. The large number of segments is because segments with similar start and end frames produce similar neural network outputs, and therefore if one segment makes a good segment its neighboring segments will as well. This local similarity can be taken advantage of by assuming that a frame that is a good segment boundary will appear in many other good segments. This is accomplished by producing a histogram of the 26,493 segment boundaries where the number of bins is the number of frames in the 25 second sequence. The histogram of the test motion capture sequence is shown in Fig. 5(a). There is a strong correlation between the peaks of this histogram and the peaks of the histogram in Fig. 5(b), which is of 20 manual segmentations of the same sequence. Two different methods were implemented in order to convert the segment histogram into segment boundaries. The first method finds peaks in the neural network output histogram of a minimum size by using a pair of dynamic thresholds. A dynamic threshold is calculated for every frame of the sequence as the average of its neighboring 100 frames. The upper and lower thresholds are calculated by shifting the dynamic threshold up and down by half of the experimentally determined minimum peak size. The upper and lower thresholds for the test sequence are shown as curves in Fig. 6(a). Segment boundares are calculated as the maximum histogram value in between the points where the
Semantic Segmentation of Motion Capture
9
segments segments
frame
(a) Neural Networkframe Output Histogram segments segments
frame frame
(b) Manual Segmentation
Fig. 5. Neural Network Output and Segmentation Correlation
histogram transitions from below the lower threshold to above the upper threshold to below the lower threshold again. Figure 6(b) shows a histogram of the segment boundaries that were calculated via this method from the test sequence. This correlates well to the manual segmentation of the test sequence in Fig. 6(c).
segments segments segments
frame
(a) Neural Networkframe Output Histogram
segments segments segments
frame
frame frame
segments segments segments
(b) Automaticframe Segmentation
frame frame frame
(c) Manual Segmentation
Fig. 6. Threshold Segmentation
The second method for calculating the segment boundaries from the segment histogram uses local maxima and minima. The method begins by calculating all of the local maxima and minima of the segment histogram. The local maxima and minima of the test sequence are represented as circles in Fig. 7(a). The local
10
D. Bouchard, N. Badler
maxima and minima are then pruned such that the distance in height between two consecutive points must be above some experimentally determined threshold. The lines in Fig. 7(a) connect all of the points that remain after the pruning process is performed on the test sequence. The segment boundary points are the same as local maximum points. Figure 7(b) shows a histogram of segment boundaries calculated via this method from the test sequence. This correlates well to the manual segmentation of the test sequence in Fig. 7(c).
output output output frame frame
(a) Neural Networkframe Output Histogram output output output frame frame frame
(b) Automatic Segmentation output output output frame frame frame
(c) Manual Segmentation
Fig. 7. Maxima/Minima Segmentation
5
Analysis
Both of the above methods for calculating segment boundaries produced all of the same segment points as manual segmentation in the 25 second test sequence. The segment points are listed in Table 5. The average distance between automatically calculated segment points and the manual segment points is 8.5 frame for the threshold method and 9 frames for the local maximum method. In experiments with manual segmentation it was found that segment points varied by 9.2 frames on average. So the error of the automatically generated segment points for this example is within the error that is produced by manual segmentation. The preliminary results demonstrate that using LMA Effort parameters as the basis for segmenting produces results that are on par with manual segmentation in at least this one example. What needs to be shown is that this method is still effective on longer and more general sets of motions. The performance
Semantic Segmentation of Motion Capture
11
should also be evaluated by comparing it to existing methods when integrated into real applications. Table 5. Segmentation Results Boundary Number Manual Boundaries Threshold Boundaries Local Maximum Boundaries Threshold Difference Local Maximum Difference
1 91 82 81 9 10
2 170 162 161 8 9
3 298 295 294 3 4
4 355 348 347 7 8
5 394 404 403 10 9
6 481 474 473 7 8
7 545 561 560 16 15
8 695 687 686 8 9
References 1. J. Barbiˇc, A. Safonova, J.Y. Pan, C. Faloutsos, J.K. Hodgins, and N.S. Pollard. Segmenting motion capture data into distinct behaviors. Proceedings of Graphics Interface (GI’04), 2004. 2. C. Bregler. Learning and recognizing human dynamics in video sequences. IEEE Conference on Computer Vision and Pattern Recognition, pages 568–574, 1997. 3. A. Fod, M.J. Matari´c, and O.C. Jenkins. Automated derivation of primitives for movement classification. Autonomous Robots, 12(1):39–54, 2002. 4. O.C. Jenkins and M.J. Mataric. Automated derivation of behavior vocabularies for autonomous humanoid motion. Proceedings of the second international joint conference on Autonomous agents and multiagent systems, pages 225–232, 2003. 5. O.C. Jenkins and M.J. Matari´c. A spatio-temporal extension to isomap nonlinear dimension reduction. ACM International Conference Proceeding Series, 2004. 6. K. Kahol, P. Tripathi, and S. Panchanathan. Automated gesture segmentation from dance sequences. Automatic Face and Gesture Recognition, 2004. Proceedings. Sixth IEEE International Conference on, pages 883–888, 2004. 7. C.S. Lee and A. Elgammal. Human motion synthesis by motion manifold learning and motion primitive segmentation. Conference of Articulated Motion and Deformable Objects (AMDO), pages 464–473, 2006. 8. R. Osaki, M. Shimada, and K. Uehara. A motion recognition method by using primitive motions. Proceedings of the Fifth Working Conference on Visual Database Systems: Advances in Visual Information Management, pages 117–128, 2000. 9. D.W. Ruck, S.K. Rogers, and M. Kabrisky. Feature selection using a multilayer perceptron. Journal of Neural Network Computing, 2(2):40–48, 1990. 10. T. Shiratori, A. Nakazawa, and K. Ikeuchi. Rhythmic motion analysis using motion capture and musical information. IEEE International Conference on Multisensor Fusion and Integration for Intelligent Systems (MFI), pages 89–94, 2003. 11. T. Starner and A. Pentland. Visual recognition of american sign language using hidden markov models. Master’s thesis, Massachusetts Institute of Technology, Program in Media Arts and Sciences, 1995. 12. T.S. Wang, H.Y. Shum, Y.Q. Xu, and N.N. Zheng. Unsupervised analysis of human gestures. IEEE Pacific Rim Conference on Multimedia, pages 174–181, 2001.
12
D. Bouchard, N. Badler
13. H.-Y. Shum Y. Li, T. Wang. Motion texture: a two-level statistical model for character motion synthesis. siggraph2002, pages 465–472, 2002. 14. L. Zhao and N. Badler. Acquiring and validating motion qualities from live limb gestures. Journal of Graphical Models, 2005.