arXiv:1209.1719v1 [cs.IR] 8 Sep 2012
Semi-metric networks for recommender systems Tiago Simas
Luis M. Rocha
Cognitive Science Program Indiana University, Bloomington, IN 47406, USA Email:
[email protected]
Center for Complex Networks and Systems School of Informatics & Computing Indiana University, Bloomington, IN 47406, USA Email:
[email protected]
Abstract—Weighted graphs obtained from co-occurrence in user-item relations lead to non-metric topologies. We use this semi-metric behavior to issue recommendations, and discuss its relationship to transitive closure on fuzzy graphs. Finally, we test the performance of this method against other item- and user-based recommender systems on the Movielens benchmark. We show that including highly semi-metric edges in our recommendation algorithms leads to better recommendations. Index Terms—recommender systems;complex networks; network theory (graphs); fuzzy systems
I. I NTRODUCTION : R ECOMMENDATION AS P REDICTION The identification of association or correlation between time events is important for many systems, such as: recommender systems, social behavior, functional brain interaction, event-detection, financial forecasting, and many more. Recommender systems are a good example of prediction, since the goal is to recommend the items users may be interested in the future, given information about how they accessed or purchased items in the past [1]. Recently, there has been much interest in the analysis of complex networks [2]—extracted from large collections of textual documents and user access patterns—to predict social behavior including online behavior [3]. In previous work, we developed complex network methods to uncover clusters in non-metric network topologies that arise in weighted graphs obtained from real-world data (e.g. via cooccurrence statistics, see below). Our clustering methodology, which is equivalent to what has become known more recently as link communities[4], has been applied to social networks, word networks, scientific journal networks, etc [e.g.[5], [6]]. Of particular interest to prediction in recommendation, we have developed measures to extract the graph edges which most violate the triangle inequality: semi-metric associations (see below). Our working hypothesis is that strong semimetric associations can be used to identify items with a higher probability of co-occurring in the future, as well the dynamics of such networks in general [7]. This methodology has been applied to recommender systems for the digital library at the Los Alamos National Laboratory, the givealink.org project, networks of felons obtained from intelligence records, etc. The performance of this approach was assessed using expert evaluations [5]. While this performance assessment showed that recommendations issued on the basis of semimetric behavior were relevant to users, one has to worry about the subjectivity of human experts. Moreover, it did not allow us to conclude about the ability of semi-metric
associations to predict future user choices in recommender systems. To address these concerns, here we use the MovieLens benchmark1 . The advantage of using this benchmark is that it has been widely used to assess various recommender systems in the literature. The disadvantage is that the results are specific to the Movilens database on the topic of movies preferences only. There are other datasets, such as the one provided by Netflix2 , which we will address in future work. Here, we simply want to establish, without expert subjectivity, that semimetric behavior can be useful to predict future user behavior and thus issue quality recommendations; to achieve that goal, as we show below, the MovieLens benchmark is sufficient. II. BACKGROUND A. Knowledge extraction in Proximity Graphs Our approach starts with probabilistic proximity measure computed from binary relations between any two sets of items (e.g. keywords-documents or items-users). This measure is a natural weighted extension [8] [9] of the Jaccard similarity measure [10], which has been used extensively in computational intelligence [11] [12]. Given a generic binary relation R between sets X (of n elements x) and Y (of m elements y), we extract two complementary proximity graphs: XY P and Y XP . m X
xypi,j =
n X
(rik ∧ rkj )
k=1 m X
(rik ∨ rkj )
k=1
; yxpi,j =
(rki ∧ rkj )
k=1 n X
(1)
(rki ∨ rkj )
k=1
These measures equate proximity with co-occurrence. xyp(xi , xj ) is the probability that both xi and xj are related (co-occur) via R to the same elements y ∈ Y (and only those)—and vice-versa for yxp. Below, when we refer to a proximity graph P , we mean a graph obtained via formula 1. Other co-occurrence measures can be used to capture a degree of proximity between elements of two sets in a binary relation. In information retrieval, it is common to use the cosine [13], Euclidean [14] and even mutual information measures [15]. For characterizing closeness in relations, we prefer our weighted Jaccard proximity measure because it possesses 1 http://movilens.umn.edu 2 www.netflix.com
several desirable characteristics. The Euclidean measure is a similarity measure (it is transitive), but it generates non-sparse matrices, since all finite elements of the relation R lead to similarity greater than zero. This makes it impractical for very large data sets. The cosine proximity measure (which is typically not transitive) is scale-invariant which makes it very appealing for text documents of varying size, but may be problematic in other domains. The weighted Jaccard measure has aspects of both the Euclidean and the cosine measures [14], and leads to sparse matrices. Proximity graphs can be seen as associative knowledge networks that represent how often items co-occur in a large set of documents [7], [16]. The assumption is that items that frequently co-occur, are associated with a common concept understood by the community of users and writers of the documents. Notice that a graph of co-occurrence proximity allows us to capture network associations rather than just pairwise co-occurrence. In other words, we expect concepts or themes to be organized in more interconnected sub-graphs, or clusters of items in the proximity networks. Indeed, we have successfully used the modularity of proximity networks in several knowledge extraction and literature mining applications, from recommender systems [5] to biomedical text mining [17], [6]. More recently, modularity-detection in proximity graph has been rediscovered in the literature as the idea of link communities [4], which applies the Jaccard similarity measure to graphs prior to identification of clusters. B. Transitive and Distance Closure Proximity graphs are reflexive and symmetric fuzzy graphs. We can perform a transitive closure of these graphs using the composition of their connectivity matrices, which is done in much the same way as the algebraic composition of matrices, except that multiplication and summation are substituted by generalized fuzzy logic conjunctions (∧) and disjunction (∨), more generally known as T-Norms and T-Conorms respectively [18]. P ◦P =
_^
(pik , pkj ) = p0ij
compute the smallest possible distance between vertices. This is done in exactly the same way as the transitive closure, except that matrix composition becomes D ◦ D = fk (g(dik , dkj )) = d0ij , for a pair of monotonic functions f, g, which we have referred to elsewhere as TD-Conorms and TD-Norms [19]. A special case of distance closure is the metric closure, where f (x, y) = min(x, y) and g(x, y) = x+y. This type of closure computes the shortest path between all edges in D — it is thus equivalent to the All Pairs Shortest Paths (APSP) algorithm [20]. We can define an isomorphism between the two types of graphs and closures, but only by using a non-linear map ϕ, since proximity edges are constrained to [0, 1], while distance edges to [0, +∞] [19]. To establish an isomorphism (for graphs P and D to commute), we must guarantee: ∀i, j ∈ P : f {g(ϕ(pi,k ), ϕ(pk,j )} = ϕ(∨{∧(pi,k , pk,j )}) k
k
which leads to the equations that allow us to define the constraints of each operation: g(di,k , dk,j )
= ϕ(∧(ϕ−1 (di,k ), ϕ−1 (dk,j )))
f (di,k , dk,j )
= ϕ(∨(ϕ−1 (di,k ), ϕ−1 (dk,j )))
∨(pi,k , pk,j )
= ϕ−1 (f (ϕ(pi,k ), ϕ(pk,j )))
∧(pi,k , pk,j )
= ϕ−1 (g(ϕ(pi,k ), ϕ(pk,j )))
(2)
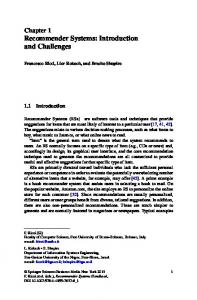
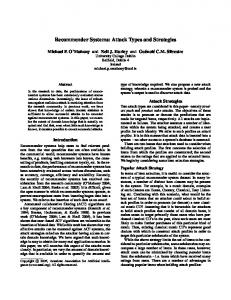
This isomorphism generalizes the concept of distance in weighted graphs. Using different TD-Norms, TD-Conorms we can calculate different types of distances and shortest paths in weighted graphs, such as: metric distances, ultra-metric distances, diffusion distances among an infinity of possibilities. ∨o∧ Proximity Graph
Transitive Closure
P
P∞
φ
φ
k
where P denotes a proximity graph, and pi,j ∈ [0, 1] the entries of its connectivity matrix. The most commonly used operations are ∧ =minimum (conjunction) and ∨ = maximum disjunction. But there are many large classes of such functions available [18]. The transitive closure P ∞ of a proximity graph P is obtained via the following algorithm[18]: 1) P 0 = P ◦ P 2) If P 0 6= P , make P = P 0 and go back to step 1. 3) Stop: P ∞ = P 0 The transitive closure of P yields a similarity graph. Instead of a proximity graph, it is often useful to work with a distance graph D, where di,j ∈ [0, ∞], di,i = 0, di,j = dj,i . In this case, instead of proximity/similarity, edge weights denote dissimilarity represented with the very intuitive notion of distance. Similarly, we can compute a distance closure, D∞ to
Distance Graph D
fog
Distance Closure D∞
Fig. 1. Isomorphism between the proximity and distance spaces, with their respective transitive and distance Closures.
C. Semi-metric behavior A high value of proximity means that two items from one set (e.g. words) tend to co-occur frequently in another set of objects (e.g. web pages). But what about items that do not co-occur frequently with one another, but do occur frequently with the same other elements? In other words, even if two
items do not co-occur much, they may occur very frequently with a third item (or more). Should we infer that the two items are related via indirect associations, that is, from transitivity? We would expect items that are strongly indirectly related to be more relevant than those that are not. To build up a more intuitive understanding of transitivity in weighted graphs, we convert our proximity graphs to distance graphs via isomorphism ϕ. The simplest proximity-to-distance conversion function is; ϕ : di,j =
1 −1 pi,j
(3)
A distance graph D, obtained via ϕ from P which is itself obtained from co-occurrence data in some corpus (as graphs XY P and Y XP ), does not, in general, yield an Euclidean topology. This is because, for a pair of elements i and j, the triangle inequality may be violated: di,j ≥ di,k +dk,j for some element k. This means that the shortest distance between two elements may not be the direct edge but rather an indirect path. Distance functions that violate the triangle inequality are referred to as semi-metrics [21]. Clearly, semi-metric behavior is a question of degree. For some pairs of vertices in a distance graph an indirect path may provide a much shorter indirect short-cut, a shorter distance, than for others. To measure a degree of semi-metric behavior we have introduced the semi-metric and below average ratios [7]: si,j =
di,j ; di,j
bi,j =
di di,j
where di,j is the shortest, direct or indirect, distance between i and j in distance graph D, and di is the mean direct distance from i to all other k ∈ D such that di,k ≥ 0. si,j is positive and > 1 for semi-metric edges. si,j and bi,j are only applied to semi-metric edges di,j where 0 < di,j < di,j . b measures how much the shortest indirect distance between i and j falls below the average distance of i to all its directly associated elements k. The below average ratio is designed to capture semi-metric behavior of non-finite edges: di,j → ∞. Note that bi,j 6= bj,i . b > 1 denotes a below average distance reduction (see [7] for more details). III. R ECOMMENDATION FROM P ROXIMITY G RAPHS We developed and tested two types of collaborative filtering algorithms: proximity- and semi-metric-based. The training set is a relation between users (U ) and items (I) from the past R : U × I, where ri,j = 1 if user i has accessed item j, and ri,j = 0 otherwise. This relation is a rectangular matrix of n × m entries. Given R, using eq. 1, we obtain user-based (U IP ) and item-based (IU P ) proximity graphs, as well as their isomorphic distance graphs obtained via the map of eq. 3. U IP (IU P ) is a weighted graph of n (m) elements. Let us now describe our recommender algorithms based on these graphs: Algorithm 1: Item-Based Proximity For each user i = 1 · · · n:
1) Retrieve the user vector Ui , containing the associated set of items from the training set R. 2) From IU P remove all columns associated with items j such that ri,j = 0 (items that do not appear in the user’s profile from step 1). 3) Calculate the mean value of row weights for each row in the reduced IU P matrix obtained in step 2. This results in a scalar score (in [0, 1]) for all items j = 1 · · · m. 4) User i is recommended the top n scored items. Algorithm 2: Item-Based Semi-metric Same as Algorithm 1, except that IU P is enhanced with additional edges. We calculate the metric closure from the proximity relation IU P using the isomorphism of equation 3. From the resulting distance graph, we identify the semi-metric pairs (edges) with below average ratio bi,j above a given threshold, and insert the corresponding edges from the transitive closure of IU P ∞ into the original proximity graph (IU P ). Finally we use this proximity graph as input for item-based proximity algorithm 1. Notice that IU P ∞ is, in this case, the isomorphic transitive closure to the metric closure of the distance graph. Therefore, the respective conjunction and disjunction operations employed are obtained from eq. 2 for f = min and g = +, given the isomorphism of eq. 3. This results in ∨ = max and ∧ = ab/(a + b − ab) (Hamacher product). Algorithm 3: User-Based Proximity For each user i = 1 · · · n: 1) Determine the k nearest users to user i from proximity graph U IP : the k highest values of row i (neighborhood of user i in graph U IP ). 2) Recommend top n most frequent items among neighborhood of user i obtained in step 1. Algorithm 4: User-Based Semi-metric Here we enhance user proximity U IP with semi.metric edges, just like we did for IU P in algorithm 2. Afterwards, we use algorithm 3. For both semi-metric algorithms (2 and 4), the thresholds for the below average ratio were set on the distribution of bi,j around the cut-off point of the power law. IV. E XPERIMENTAL E VALUATION 1) Data Sets: We used the benchmark data set of MovieLens. This data set is a collection of votes, on a scale from one to five, given by web users (943 users) in respect to a given movie (1682 movies), as a total of 100,000 ratings. In our experiment, to ascertain the utility of semi-metric behavior to predict user behavior, we do not need to use ratings; the goal is to predict which (future) movies, users will rate based on past behavior. Therefore, we converted ratings to binary votes: one (rated) or zero (not-rated). 2) Evaluation Metrics: We used the balanced F 1 score, based on precision and recall measures, as well as variant of the Somers’D, the degree of agreement metric [22]. Precision, recall, and the F 1 measures are traditional measures in information retrieval, computed for unranked retrieval. There are other assessment measures for ranked results, as the Area
Under the Precision and Recall Curve. But since we compare our results to a previous benchmark effort that used the Somers’D measure on a set of recommender systems [23] [24], we also use it here. Below, the measures employed are defined: recall =
| test ∩ topn | | test | | test ∩ topn | | topn |
(5)
2 · recall · precision recall + precision
(6)
precision = F1 =
(4)
where topn is the set of top n recommendations issued by a recommender system, and test is the set of relevant or expected recommendations from test set. The variant of Somers’D method used for the MovieLens dataset, follows the following procedure described in [24]. 1) For each user we take the row vector of similarities, R : U × I, for each movie for the considered user. 2) Take only the non-watched movies for this user. 3) Rank the non-watched movies taking in consideration all movies. 4) Compute the degree of agreement: consider each pair (a, b) of movies from recommended ranking, with a in the test set and b not. If a ahead of b: correct pair (agreement), b ahead of a: incorrect pair, 7. d=
#agreements #total − of − pairs
(7)
5) Compute the global degree of agreement. This variant of Somers’D degree of agreement gives us a measure of how well our set of recommendations is distributed in the first positions of our list of relevant items. V. R ESULTS We compare our results with the ones of Fouss et al [24]. Table I shows our results for the proximity and semi-metric (SM) approaches for item- and user-based recommender systems. Tables II and IIIshow the results obtained by Fouss et al in [24] for several item- and user-based recommender algorithms, respectively. A good description of the algorithms involved in this comparison can be found in Fouss [24]. L+ is based on the pseudo-inverse of the Laplacian matrix; PCA CT is based on the principal component analysis of L+ ; kNN is based on the k-nearest neighbors algorithm; Cosine is based on cosine similarity; Katz is based on the similarity index, which has been proposed in the social sciences field; and Dijkstra based on the shortest paths of elements of the dataset. Agreement (in %) F1
Prox-Item-based 89.53 0.1827
SM-Item-based 90.16 0.1832
Prox-User-based 88.20 0.2130
SM-User-based 88.16 0.2179
TABLE I R ESULTS FOR RECOMMENDATION SYSTEM . S OMERS ’D DEGREE OF AGREEMENT [23] [24] AND F1 MEASURE .
Agreement (in %)
PCA CT 87.08
L+ 90.99
kNN −−
Cosine −−
Katz 87.90
Dijkstra 49.11
TABLE II R ESULTS FOR ITEM - BASED RECOMMENDATION SYSTEMS FROM [24].
Agreement (in %) #Neighbors
PCA CT 82.46 60
L+ 93.02 100
kNN 92.63 100
Cosine 92.73 60
Katz 89.82 20
Dijkstra 76.09 100
TABLE III R ESULTS FOR USER - BASED RECOMMENDATION SYSTEM FROM [24].
The semi-metric approach improves the item-based proximity method, in both F 1 and the Somers’D measures (Table I), and is as good as the best item-based result reported in Fouss et al [24] (Table II). Notice that performance measures (on a fixed gold standard) are not statistical, so all improvements are significant. Our user-based algorithms are among the top such algorithms (table III)—which tend to perform better than item-based algorithms, table II, though in our approach the reverse was observed (Table I). On our user-based approach, we see a slight improvement of including semi-metric edges with the F 1 measure, but not with the Somers’D. A possible explanation is the fact that user-based approaches depend on the number of neighbors around a given user. We leave an analysis of the impact of number of neighbors on our userbased method for future work, since the objective of this paper is simply to show that semi-metric behavior can improve recommender predictions. VI. D ISCUSSION AND C ONCLUSIONS We show that exploring the natural clustering of proximity graphs (equations 1), leads to very simple, but competitive item- and user-based recommender systems, in comparison to previous benchmarks in the literature [24]. Enhancing proximity graphs with semi-metric edges further improves recommendations, confirming the previous evidence in Rocha et al [5]; on the item-based approach we see an improvement in both F 1 and Somers’D measures, while on the user-based approach we see it only on the F 1 measure. This improvement is not dramatic, but shows that semi-metric edges can be used to enhance prediction in recommender systems. Since we barely scratched the surface of understanding semi-metric behavior in complex networks, the approach is promising leaving plenty of room to improve the basic algorithms we introduced here. R EFERENCES [1] J. L. Herlocker, J. A. Konstan, A. Borchers, and J. Riedl, “An algorithmic framework for performing collaborative filtering,” in SIGIR ’99. ACM Press, 1999, pp. 230–237. [2] R. Pastor-Satorras and A. Vespignani, Evolution and structure of the Internet a statistical physics approach. Cambridge, UK: Cambridge University Press, 2004. [3] P. Jones, J. Bollen, R. Coifman, A. McCallum, and K. Verspoor, “Workshop iii: Social data mining and knowledge,” 2007. [4] Y.-Y. Ahn, J. P. Bagrow, and S. Lehmann, “Link communities reveal multiscale complexity in networks.” Nature, vol. 466, no. 7307, pp. 761–764, Jun. 2010.
[5] L. Rocha, T. Simas, A. Rechtsteiner, M. DiGiacomo, and R. Luce, “Mylibrary@lanl: Proximity and semi-metric networks for a collaborative and recommender web service,” in Proc. IEEE/WIC/ACM International Conference on Web Intelligence (WI’05). IEEE Press, 2005, pp. 565–571. [6] A. Abi-Haidar, J. Kaur1, A. Maguitman, P. Radivojac, A. Retchsteiner, K. Verspoor, Z. Wang, and L. M. Rocha, “Uncovering protein interaction in abstracts and text using a novel linear model and word proximity networks,” Genome Biology, vol. 9, no. Suppl 2, p. S11, 2008. [7] L. M. Rocha, “Semi-metric behavior in document networks and its application to recommendation systems,” in Soft Computing Agents: A New Perspective for Dynamic Information Systems, ser. International Series Frontiers in Artificial Intelligence and Applications, V. L. (Ed.), Ed. IOS Press, 2002, pp. 137–163. [8] L. Rocha, “Evidence sets: Modeling subjective categories,” International Journal of General Systems, vol. 27, pp. 457–494, 1999. [9] M. Popescu, J. Keller, and J. Mitchell, “Fuzzy measures on the gene ontology for gene product similarity,” Computational Biology and Bioinformatics, IEEE/ACM Transactions on, vol. 3, pp. 263–274, 2006. [10] G. Grefenstette, Explorations in Automatic Thesaurus Discovery. Kluwer Academic, 1994. [11] K. Nakamura, S. Iwai, and T. Sawaragi, “Decision support using causation knowledge base,” Systems, Man and Cybernetics, IEEE Transactions on, vol. 12, no. 6, pp. 765 –777, nov. 1982. [12] L. Rocha, “Talkmine: a soft computing approach to adaptive knowledge recommendation,” in Soft Computing Agents: New Trends for Designing Autonomous Systems, ser. Studies in Fuzziness and Soft Computing, V. Loia and S. Sessa, Eds. Physica-Verlag, Springer, 2001, pp. 89– 116. [13] R. Baeza-Yates, B. Ribiero-Neto, and B. Ribeiro-Neto, Modern Information Retrieval. Pearson Education, 1999. [14] A. Strehl, “Relationship-based clustering and cluster ensembles for high-dimensional data mining,” Ph.D. dissertation, Austin University of Texas, 2002. [15] P. D. Turney, “Mining the Web for synonyms: PMI–IR versus LSA on TOEFL,” LNCS, vol. 2167, pp. 491–502, 2001. [16] L. M. Rocha, “Automatic conversation driven by uncertainty reduction and combination of evidence for recommendation agents,” in NATO Advanced Research Workshop on Systematic Organisation of Information in Fuzzy Systems; October 24-26, 2001; Vila Real, Portugal. IOS Press, 2003. [17] K. Verspoor, J. Cohn, C. Joslyn, S. Mniszewski, A. Rechtsteiner, L. Rocha, and T. Simas, “Protein annotation as term categorization in the gene ontology using word proximity networks,” BMC Bioinformatics, pp. 6(Suppl 1):S20. doi:10.1186/1471–2105–6–S1–S20, 2005. [18] G. J. Klir, Facets of System Science, K. A. P. Publishers, Ed. ISFR International Series on Systems Science and Engineering, 2001, vol. 15. [19] T. Simas and L. M. Rocha, “Generalized transitive closures on complex networks,” Fuzzy Sets and Systems, vol. submmited, 2012. [20] U. Zwick, “All pairs shortest paths using bridging sets retangular matrix multiplication,” Journal of the ACM, vol. 49, no. 3, pp. 289–317, May 2002. [21] F. Galvin and S. Shore, “Distance functions and topologies,” American Mathematical Monthly, vol. 98, pp. 620–623, 1991. [22] S. Siegel and J. Castellan, Nonparametric Statistics for the behavioral Sciences, 2nd ed. McGraw-Hill, 1988. [23] F. Fouss, S. Faulkner, M. Kolp, A. Pirotte, and M. Saerens, “Web recommendation system based on a markov-chainmodel,” ICEIS, vol. 4, pp. 56–63, 2005. [24] F. Fouss, A. Pirotte, and M. Saerens, “A novel way of computing similarities between nodes of a graph, with application to collaborative recommendation.” WI ’05 Proceedings of the 2005 IEEE/WIC/ACM International Conference on Web Intelligence, 2005.