and is under clinical investigation as an immunosuppressant after organ transplantation. An 1-IPLC/mass spectrometry assay to quanti1 sirolimus in blood was ...
ClinicalChemistry 42:9 1417-1425
(1996)
Sensitive and specific quantification of sirolimus (rapamycin) and its metabolites in blood of kidney graft recipients by HPLC/electrospraymass spectrometry FRANK STREIT,”2 LUDGER
ERNST,5
UWE
CHRISTIANS,3*
ANNETTE
LINcK,’
HANS-MARTIN
D.
BARRY
face and positive ions were detected. The limit of quantification in 1 mL of blood was 0.25 i.eg/L and the calibration curve in blood was linear up to 250 zg/L. The recovery from blood was 88 ± 26% and interassay variation at 1 pgfL was 19% and at 15 pgfL 9.3%. Hydroxy, dihydroxy, demethyl, and didemethyl siroliinus as well as sirolimus were detected in blood of kidney graft patients.
plantation
mIuis: therapeutic #{149} macrolides
drug
monitoring
organ
#{149}
KAHAN,4
and
KIMBERLY
KARL-FRIEDRICH
L.
NAPOLI,4 SEWING2
(chloroform) due to hindered rotation around the pipecolic acid amide bond [3, 4]. Because of its triene structure, sirolimus has ultraviolet (UV) absorption maxima at 288, 276, and 266 nm.6 It is sparingly soluble in water, aliphatic hydrocarbons, and diethyl ether, whereas it is soluble in alcohols, halogenated hydrocarbons, and dimethyl sulfoxide [1, 5, 6]. Sirolimus is unstable in solution and degrades in plasma and low- and neutral-pH buffers at 37 #{176}C, with a half-life of 16 hydroxyl-
6
Nonstandard
abbreviations:
MS, mass spectrometry;
1417
and CAD,
UV,
ultraviolet;
collision-activated
ESI, electrospray dissociation.
ionization;
1418
Streit
et al.: ESJIMS
of sirolimus
si roll m us
39-0-demethyl
sirolimus
CYP3A
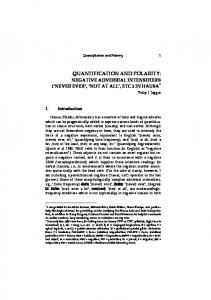
Fig. 1. Structure bolic pathways.
of sirolimus
and its meta-
Numbering of atoms follows the rules of the Cambridge Structure Data Bank: first numbering of the main chain, then of the methyl groups.
Me
OMe Me
Me
The 700
Me
fr
MaterialsandMethods AND
OMe Me
further hydroxylated- and/or demethylated metabolites
ated and (or) demethylated metabolites were detected by HPLC/electrospray-mass spectrometry (ESI-MS) [25]. HPLC assays have been described by several authors [24, 26-29]. Most of these methods do not allow quantification of sirolimus metabolites [26-29] and have other serious drawbacks: The method described by Sattler et al. [23] does not report any specifications, Napoli and Kahan [26] did not show that their method is able to quantify sirolimus in biological samples, and Yatscoff et al. [27] used demethyl sirolimus as internal standard, which is a potential sirolimus metabolite [24] and is present in blood of patients in concentrations equal to that of sirolimus (vide infra). The only HPLC/IJV assay described so far that is used for therapeutic drug monitoring of sirolimustreated patients is that described by Napoli and Kahan [29]. This assay does not allow quantification of metabolites and its sensitivity is limited to 2 gfL. Because of its high immunosuppressive potency [6,16,30],a sensitive and specific assay for sirolimus and its metabolites that detects concentrations 95% as estimated by HPLC/UV [24]. Furthermore, the metabolites were used to compare the signal intensities of the different sirolimus
was eluted from the HPLC column with a retention time of 32 mm (Fig. 2). Fractions were manually collected and extracted with equal volumes of dichloromethane. The organic phase was dried over MgSO4 and evaporated under vacuum. Structures and purity of the internal standard were confirmed by ESIMS/MS and collision-activated dissociation (CAD). For CAD, argon was used as collision gas with a collision energy of 49 eV. Structural identification of the internal standard was based upon analysis of the fragmentation pattern shown in Figs. 3 and 4 and described in refs. 31 and 32. GENERATION
AND
PURIFICATION
OF SIROLIMUS
METABOLITES
Sirolimus metabolites were generated as previously described [24]. Human liver microsomes were isolated by using standard centrifugation techniques [33]and the protein concentration
A
B Fig. 2. Isolation of the internal standard 28O-acetyl sirolimus and other acetylated sirolimus derivatives by semipreparative HPLC. Chromatogram of 28-O-acetyl sirolimus during semi-
D
5
10
15
20
25
30
35
40
preparative isolation by HPLC. HPLC conditions: 250 x 10 mm C8 7-.em column, acetonitrile/ sulfuric acid (pH 3) gradient: analysis time 0 mm, 500 mL/L acetonitrile; analysis time 20 mm, 550 mL/L acetonitrile; analysis time 35 mm, 650 mL/L acetonitrile; analysis time 40 mm, 750 mL/L acetonitrile. Flow 4.5 mL/min, column temperature 35 C, LIV detection wavelength 276 nm. A representativechromatogram is shown. Retention time (t5) 28.5 mm, sirolimus (A, larger peak); t 32.9 mm, 28-O-acetyl sirolimus (B, larger peak); t 34.9 mm, 40-O-acetyl sirolimus(C, larger peak); t 37.6 mi 28,40-O-diacetylsirolimus (D, larger peak). The smaller peaks behind the sirolimus and derivetive peaks with retention times of 29.9 mm, 33.8 mm, 36.0 mm, and 38.5 mm, respectively,represent the separated rotameres.
Streit et al.: ESI/MS
1420
%
100
of sirolimus
A
936.6
409
eo’
.3
60’
40’
32 20
0...j.,
1
345.2
693
453.1 582.4..
ILdA I.______
73j.
i
200
4#{212}0
B
Fig. 3. CAD mass spectra
standard
Do4....
600
$
oo’
95.4
1000
en
1I II
the internal
5
75.5
I.iI41.-#{176}
of sirolimus (A) and 28-0-acetyl sirolimus
.3
773.2
The fragments used for identification according to FIg. 4 are marked by arrows.
derivatives and recoveries of single metabolites during tion with those of sirolimus and the internal standard. EXTRACTION
OF BLOOD
extrac-
SAMPLES
To
1 mL of blood, 25 jiL of the internal standard solution (I mg/L in methanol) and for protein precipitation 2 mL of methanol/water saturated with zinc sulfate (70/3 0 by vol) were added. Samples were vortex-mixed for 20 s and centrifuged at 2000g for 2 mm. The supernatants were drawn through C18 extraction columns that had previously been primed with 2 mL of acetonitrile and 2 mL of sulfuric acid (pH 3). The pressure was adjusted to -5 mmHg. The extraction columns were washed with 2 mL of sulfuric acid (pH 3) and dried by drawing air through the columns for 2 mmn. Sirolimus, its metabolites, and the internal standard were eluted with 400 j.LL of acetonitrile/l % formic acid (90/10 by vol). Two hundred microliters were transferred into an HPLC microvial (Hewlett-Packard) and 100 1.L of the extract was injected into the HPLC system. HPLC/ESI-MS
Sirolimus, its metabolites, and the internal standard were eluted isocratically from the analytical column with methanolll% formic acid (90/10 by vol) at a flow rate of 0.4 mL/min. The column temperature was 35 #{176}C. The mass spectrometer was tuned with 0.5g/L sirolimus dissolved in the mobile phase and delivered by a syringe pump at 5 jLL/min, bypassing the HPLC column. The capillary temperature was 200 #{176}C. The auxiliary gas pressure was 175 kPa and the gas was not heated. The sheath gas pressure was 175 kPa. The needle voltage was adjusted to 5.5 kV and the capillary exit voltageto -200 V. The mass spec-
trometer was run in the positive ion mode. The multiplier voltage was set to 1400 V and the conversion dynode to -15 kV. For single ion detection, the MS was focused on the [M+Na}
of didemethyl sirolimus [908 atomic mass unit (amu)], demethyl sirolimus (922 amu), sirolimus (936 amu), hydroxy sirolimus (952 amu), dihydroxy sirolimus (968 amu), trihydroxy sirolimus (984 amu), as well as 28-O-acetyl sirolimus (978 amu). The resolution was set to 1000 (10%-valley definition) and a mass was scanned within 0.25 s. Because sirolimus and its metabolites gave the same detector response after MS analysis as equal amounts of the internal standard, similar slope and intercept of the calibration curves, as well as equal recoveries (see below), concentrations of sirolimus and its metabolites were calculated as follows: sirolimus or metabolite (pg/L) = (areas sirolimus or metabolite/areas internal standard) . internal standard added (p.gfL). Determination of recoveries, inter- and intraassay variation, calibration curves, and lower limit of quantification were based on blood collected from healthy volunteers, to which sirolimus or the purified metabolites dissolved in acetonitrile/sulfuric acid (pH 3, 7/3 by vol) were added. Calibration curves were made up of six data points (0, 1, 5, 10, 50, and 250 j.tg/L with n = 5). The concentration of sirolimus or its metabolites was calculated by using the internal standard and the formula described above. Data were analyzed by using linear regression analysis (REG procedure, SAS version 6.05;SAS Institute, Cary, NC). The accuracy was calculated as the deviation from the nominal concentration added to 1-mL blood samples of healthy volunteers and are given in percent of the nominal concentration. As for the calibration curve, concentrations were calculated with
Clinical Chemistry
fragment fragment
=
o
,,
A
Na
Ms
of39-O-demethyl sirolimus
sirolimus
H,LYfoH
HYlCcOH Ms
m/z
of
1421
42, No. 9, 1996
m/z
sirolimua
HYccOM
331
Me
/
345
of 40-0-acetyl
fragment
Me
mlz
Na
387
simlimus c51HNo13Na R’Me,R =H,RH m/z938.6 39-0-demethyl sirolimus CwHnNO,3Na R’ H, R2 = H, R3 = H miz 922.6 40-0-acetyl sirolimus cH81NO,4Na = Me. R2 =coCH3,R3 = H m/z 978.6 28-0-acetyl sirolimus C5,H81N0,4Na R1 = Me, R2 H, R3 = COCH3 m/z = 978.8 fragment
of sirolimus fragment
of 28-O.acetyl
sirolimus
MoMe
Me
m/z =607 fragment of 28-0-acetyl
OMe Me
Me
m/z 649
sirolimus
Fig. 4. Formation of fragments and CAD crucial for structural sirolimus and its derivatives. Me
OM. Me
Me
mlz
=
589
the internal standard. For determination of the lower limit of quantification, samples containing the following concentrations were prepared: 0, 0.1, 0.25, 0.5, 1, 2.5, 5, and 10 jLg/L. The lower limit of quantification was calculated as the percentage deviation from the nominal concentration obtained by inverse prediction from the standard regression curve. For acceptance as lower limit of quantification, the percentage deviation for a certain concentration had to be