Ficha catalográfica elaborada pela Biblioteca Prof. Achille Bassi e Seção ... Carlos â SP, 2016. 117 p. Dissertação (Mestrado - Programa de Pós-Graduação.
Service-oriented middleware for dynamic, real-time management of heterogeneous geosensors in flood management Luiz Fernando Ferreira Gomes de Assis
Luiz Fernando Ferreira Gomes de Assis
Service-oriented middleware for dynamic, real-time management of heterogeneous geosensors in flood management
Master dissertation submitted to the Instituto de Ciências Matemáticas e de Computação – ICMCUSP, in partial fulfillment of the requirements for the degree of the Master Program in Computer Science and Computational Mathematics. FINAL VERSION Concentration Area: Computer Computational Mathematics
Science
and
Advisor: Prof. Dr. João Porto de Albuquerque Pereira
USP – São Carlos February 2016
Ficha catalográfica elaborada pela Biblioteca Prof. Achille Bassi e Seção Técnica de Informática, ICMC/USP, com os dados fornecidos pelo(a) autor(a)
A848s
Assis, Luiz Fernando Ferreira Gomes de Service-oriented middleware for dynamic, real-time management of heterogeneous geosensors in flood management / Luiz Fernando Ferreira Gomes de Assis; orientador João Porto de Albuquerque Pereira. – São Carlos – SP, 2016. 117 p. Dissertação (Mestrado - Programa de Pós-Graduação em Ciências de Computação e Matemática Computacional) – Instituto de Ciências Matemáticas e de Computação, Universidade de São Paulo, 2016. 1. Service-Oriented Middleware. 2. Flood Risk Management. 3. Sensor Web Enablement. I. Pereira, João Porto de Albuquerque, orient. II. Título.
SERVIÇO DE PÓS-GRADUAÇÃO DO ICMC-USP
Data de Depósito: Assinatura: ______________________
Luiz Fernando Ferreira Gomes de Assis
Middleware orientado a serviços para gerenciar dinamicamente e em tempo-real geosensores heterogêneos na gestão de inundações
Dissertação apresentada ao Instituto de Ciências Matemáticas e de Computação – ICMC-USP, como parte dos requisitos para obtenção do título de Mestre em Ciências – Ciências de Computação e Matemática Computacional. VERSÃO REVISADA Área de Concentração: Ciências de Computação e Matemática Computacional Orientador: Prof. Albuquerque Pereira
USP – São Carlos Fevereiro de 2016
Dr.
João
Porto
de
This thesis is firstly dedicated to God that helps me in my way to this journey. To my parents, sister and all my family members, with their great affection and support, since they do not spare any effort to ensure that I got to this stage of my life. To all my friends and colleagues for the constant encouragement and support. And to all my professional colleagues, who were important in my academic life.
ACKNOWLEDGEMENTS
I would like to thank my advisor Prof. Dr. João Porto de Albuquerque, for supporting me with his valuable advice and giving me the opportunity to develop this project. I am very grateful to my supervisors, the Ph.D. candidates, MSc. Flávio Eduardo Aoki Horita and MSc. Livia Castro Degrossi, for guiding me to better results. I am sincerely thankful to all my colleagues of the AGORA Group1 , for contributing with their feedbacks, time and efforts in order to improve the results of the project. Then, I appreciate the cooperation with all the members of the Software Engineering Laboratory 2 of the Institute of Mathematics and Computer Science (ICMC), University of São Paulo (USP), and the Geoinformatics Research Group at the University of Heidelberg 3 , for the encouragement and tips provided during this project. Special thanks to the contributions made by Prof. Dr. Edison Pignaton de Freitas and Prof. Dr. Carlos Eduardo Pereira from the Rio Grande do Sul Federal University, and Prof. Jó Ueyama from USP. I would like to express thanks for the financial support provided by the São Paulo Research Foundation (FAPESP) by the grant #13/16202-1, #14/01515-7 and #14/08398-6, CAPES by the grant #88887.091744/2014-01 and #12065-13-7, Heidelberg University (Excellence Initiative fund: 2300054, assignment: 7812617) and the National Council for Scientific and Technological Development (CNPq) by the grant #477499/2012-0 and #202453/2014-6.
1 2 3
http://www.agora.icmc.usp.br/site/members/ http://www.labes.icmc.usp.br/site/content/about-labes http://www.geog.uni-heidelberg.de/gis/index_en.html
“Science is organized knowledge. Wisdom is organized life.” (Immanuel Kant)
RESUMO ASSIS, L. F. F. G.. Service-oriented middleware for dynamic, real-time management of heterogeneous geosensors in flood management. 2016. 117 f. Master dissertation (Master student Program in Computer Science and Computational Mathematics) – Instituto de Ciências Matemáticas e de Computação (ICMC/USP), São Carlos – SP.
Os desastres naturais, como inundações, secas e tempestades causam muitas mortes e danos em todo o mundo. Mais recentemente, alguns países sofreram com o aumento das inundações, comparado com outros tipos de desastres. Para melhor gerenciá-las, agências governamentais têm fornecido dados históricos de redes de sensores estáticas para ajudar comunidades que vivem em áreas de risco. No entanto, tais redes de sensores apenas ajudam a verificar propriedades específicas (por exemplo, temperatura e pressão) e pouco contribuem com a falta de informações presente nesse contexto. Além dos sensores estáticos, sensores móveis também têm sido utilizados para monitorar inundações, uma vez que podem fornecer imagens e alcançar distâncias onde sensores estáticos não funcionam adequadamente. Para combinar esses sensores, deve ser utilizado uma iniciativa chamada Sensor Web Enablement (SWE) que isola as aplicações das idiossíncrasias da implementação desses sensores heterogêneos. Entretanto, a SWE não gerencia completamente contextos em que sensores são inseridos e removidos dinamicamente. Este contexto dinâmico torna complexo o controle, o acesso e a descoberta de novos sensores. Logo, o objetivo deste trabalho é gerenciar dinamicamente e próximo do tempo-real sensores heterogêneos envolvidos na gestão de inundações, permitindo um acesso interoperável para seus dados usando componentes abertos e de re-uso. Para alcançar esse objetivo, um middleware orientado a serviços contendo um protocolo de mensagens comum, um componente de gerenciamento dinâmico de sensores e um repositório foi desenvolvido. A avaliação dessa abordagem foi feita considerando uma aplicação que prioriza geograficamente dados de mídias sociais baseados em dados de sensores. Palavras-chave: Middleware orientado a serviços, Gerenciamento de Risco de Inundação, Sensor Web Enablement.
ABSTRACT ASSIS, L. F. F. G.. Service-oriented middleware for dynamic, real-time management of heterogeneous geosensors in flood management. 2016. 117 f. Master dissertation (Master student Program in Computer Science and Computational Mathematics) – Instituto de Ciências Matemáticas e de Computação (ICMC/USP), São Carlos – SP.
Natural disasters such as floods, droughts and storms cause many deaths and a great deal of damage worldwide. Recently, several countries have suffered from an the increased number of floods. This has led government agencies to seek to improve flood risk management by providing historical data obtained from stationary sensor networks to help communities that live in hazardous areas. However, the sensor networks can only help to check specific features (e.g. temperature and pressure), and are unable to contribute significantly to supplying the missing information that is required. In addition to stationary sensors, mobile sensors have also been used to monitor floods since they can provide images and reach distances that are not within the coverage of stationary sensors. By combining these heterogeneous sensors, an initiative called Sensor Web Enablement (SWE) seeks to free these applications from the idiosyncrasies that affect the implementation of these heterogeneous sensors. However, SWE cannot always be applied effectively in a context where sensors are embedded and removed dynamically. This dynamic context makes it a complex task to handle, control, access and discover sensors. In view of this, the aim of this work is to dynamically manage heterogeneous sensors involved in flood risk management in near real-time, by enabling interoperable access to their data and using open and reusable components. To achieve this goal, a service-oriented middleware was designed that contains a common protocol message, a dynamic sensor management component and a repository. This approach was evaluated performed by employing an application that prioritizes geographically social media messages based on sensor data. Key-words: Service-Oriented Middleware, Flood Risk Management, Sensor Web Enablement.
LIST OF FIGURES
Figure 1 – Figure 2 – Figure 3 – Figure 4 – Figure 5 – Figure 6 – Figure 7 – Figure 8 – Figure 9 – Figure 10 – Figure 11 – Figure 12 Figure 13 Figure 14 Figure 15 Figure 16 Figure 17 Figure 18 Figure 19 Figure 20
– – – – – – – – –
Figure 21 Figure 22 Figure 23 Figure 24 Figure 25 Figure 26 Figure 27
– – – – – – –
Dynamic context involving stationary and mobile sensors. . . . . . . . . . . 24 AGORA components of the architecture . . . . . . . . . . . . . . . . . . . 28 Flow Chart of the objectives, methods and results. . . . . . . . . . . . . . . 31 Research Method. . . . . . . . . . . . . . . . . . . . . . . . . . . . . . . . 37 Search Key Terms. . . . . . . . . . . . . . . . . . . . . . . . . . . . . . . . 38 Studies Search Details. . . . . . . . . . . . . . . . . . . . . . . . . . . . . 40 Example of four subsequent scenarios of the sensor field. . . . . . . . . . . 49 Registering, Updating and Publicating Sensor Information into the Sensor Web. 50 A diagram of the approach overview. . . . . . . . . . . . . . . . . . . . . . 51 Dynamic Sensor Management Architecture of the approach. . . . . . . . . . 53 A Mission and Vision Control Module composed of two Raspberry Pi boards with infrared and visible light cameras. . . . . . . . . . . . . . . . . . . . . 54 Simulation Setup Scenario One. . . . . . . . . . . . . . . . . . . . . . . . . 55 Simulation Setup Scenario Two . . . . . . . . . . . . . . . . . . . . . . . . 56 Scenario One - Sent Messages . . . . . . . . . . . . . . . . . . . . . . . . 58 Scenario Two - Sent Messages . . . . . . . . . . . . . . . . . . . . . . . . 58 Sensor Data Stream Workflow. . . . . . . . . . . . . . . . . . . . . . . . . 64 Social Network Message Workflow. . . . . . . . . . . . . . . . . . . . . . . 65 São Paulo - An analysis of Brazilian Stations and Catchments. . . . . . . . 67 São Paulo - An analysis of Prioritized Tweets during periods of floods. . . . 67 Examples of flood-related tweets containing images that can help in flood risk management. . . . . . . . . . . . . . . . . . . . . . . . . . . . . . . . 69 Median, Average and Outliers of flood-related and non flood-related tweets. 69 Conceptual Architecture of AGORA-DSM. . . . . . . . . . . . . . . . . . 76 Latency for registering sensors. . . . . . . . . . . . . . . . . . . . . . . . . 82 Latency for publishing observations. . . . . . . . . . . . . . . . . . . . . . 83 Latency for registering sensors and publishing observations. . . . . . . . . . 84 Sensor Constellations (BRöRING; STASCH; ECHTERHOFF, 2012). . . . . 107 Observation components (BRöRING; STASCH; ECHTERHOFF, 2012). . . 108
LIST OF TABLES
Table 1 Table 2 Table 3 Table 4 Table 5 Table 6 Table 7
– – – – – – –
Table 8 – Table 9 – Table 10 Table 11 Table 12 Table 13 Table 14 Table 15 Table 16
– – – – – – –
Quality Criteria. . . . . . . . . . . . . . . . . . . . . . . . . . . . . . . . . 39 Electronic Databases. . . . . . . . . . . . . . . . . . . . . . . . . . . . . . . 39 Summary of the approaches and their main functionalities. . . . . . . . . . . 40 Message Protocol. . . . . . . . . . . . . . . . . . . . . . . . . . . . . . . . 51 Parameters in simulation. . . . . . . . . . . . . . . . . . . . . . . . . . . . . 55 Size Comparison. . . . . . . . . . . . . . . . . . . . . . . . . . . . . . . . . 57 Keyword-based filtering description of the location-based social network messages . . . . . . . . . . . . . . . . . . . . . . . . . . . . . . . . . . . . 68 Sensor measurement description of Cemaden stations. . . . . . . . . . . . . 68 Examples of prioritized Tweets containing flood-related keywords without images (On Topic, Relevant). . . . . . . . . . . . . . . . . . . . . . . . . . . 68 Parameters for registering sensors from ”Pegel Online”. . . . . . . . . . . . 81 Parameters for publishing observations from Cemaden. . . . . . . . . . . . . 82 Parameters for registering sensors and publishing observations from Cemaden. 82 Pegelonline stations attributes. . . . . . . . . . . . . . . . . . . . . . . . . . 105 Pegelonline stations measurements attributes. . . . . . . . . . . . . . . . . . 106 SOS parameters vs PEGELEONLINE stations measurements attributes. . . . 110 SOS parameters vs CEMADEN stations measurements attributes. . . . . . . 110
CONTENTS
1
INTRODUCTION . . . . . . . . . . . . . . . . . . . . . . . . . . . . 23
1.1
Motivating factors . . . . . . . . . . . . . . . . . . . . . . . . . . . . . .
23
1.2
Background . . . . . . . . . . . . . . . . . . . . . . . . . . . . . . . . . .
25
1.2.1
Flood Risk Management . . . . . . . . . . . . . . . . . . . . . . . . . .
25
1.2.2
Service-Oriented Middleware . . . . . . . . . . . . . . . . . . . . . . .
26
1.3
Research Context . . . . . . . . . . . . . . . . . . . . . . . . . . . . . .
27
1.4
Research Question and Objectives . . . . . . . . . . . . . . . . . . . .
29
1.5
A Methodological Overview . . . . . . . . . . . . . . . . . . . . . . . .
30
1.6
Organization of this Thesis . . . . . . . . . . . . . . . . . . . . . . . .
31
2
DYNAMIC INTEGRATION OF HETEROGENEOUS SENSORS INTO THE SENSOR WEB: A SYSTEMATIC MAPPING OF THE LITERATURE . . . . . . . . . . . . . . . . . . . . . . . . . . . . . . . . 33
2.1
Introduction . . . . . . . . . . . . . . . . . . . . . . . . . . . . . . . . .
33
2.2
Background . . . . . . . . . . . . . . . . . . . . . . . . . . . . . . . . . .
34
2.2.1
Sensor Web . . . . . . . . . . . . . . . . . . . . . . . . . . . . . . . . . .
34
2.2.2
Sensor plug-and-play . . . . . . . . . . . . . . . . . . . . . . . . . . . .
35
2.3
Sistematic Mapping Method . . . . . . . . . . . . . . . . . . . . . . .
36
2.4
Discussion . . . . . . . . . . . . . . . . . . . . . . . . . . . . . . . . . . .
41
2.5
Final Remarks . . . . . . . . . . . . . . . . . . . . . . . . . . . . . . . .
42
3
DYNAMIC SENSOR MANAGEMENT: EXTENDING SENSOR WEB FOR NEAR REAL-TIME MOBILE SENSOR INTEGRATION IN DYNAMIC SCENARIOS . . . . . . . . . . . . . . . . . . . . . . . . 45
3.1
Introduction . . . . . . . . . . . . . . . . . . . . . . . . . . . . . . . . .
45
3.2
Related Work . . . . . . . . . . . . . . . . . . . . . . . . . . . . . . . .
47
3.2.1
The use of mobile sensors in WSN . . . . . . . . . . . . . . . . . . . .
47
3.2.2
Dynamically Integrating Sensors into the Sensor Web . . . . . . . .
48
3.3
Problem Definition . . . . . . . . . . . . . . . . . . . . . . . . . . . . .
49
3.4
Proposed Approach . . . . . . . . . . . . . . . . . . . . . . . . . . . . .
50
3.4.1
Message Protocol . . . . . . . . . . . . . . . . . . . . . . . . . . . . . .
51
3.4.2
Dynamic Sensor Management . . . . . . . . . . . . . . . . . . . . . . .
52
3.5
Simulation Setup Scenarios . . . . . . . . . . . . . . . . . . . . . . . .
53
3.6
Results . . . . . . . . . . . . . . . . . . . . . . . . . . . . . . . . . . . .
56
3.7
Discussions . . . . . . . . . . . . . . . . . . . . . . . . . . . . . . . . . .
58
3.8
Final Remarks . . . . . . . . . . . . . . . . . . . . . . . . . . . . . . . .
59
4
AUTOMATED GEOGRAPHICAL PRIORITIZATION OF SOCIAL NETWORK MESSAGES USING SENSOR DATA STREAMS: AN APPLICATION TO FLOODS . . . . . . . . . . . . . . . . . . . . . . 61
4.1
Introduction . . . . . . . . . . . . . . . . . . . . . . . . . . . . . . . . .
61
4.2
Related Works . . . . . . . . . . . . . . . . . . . . . . . . . . . . . . . .
62
4.3
Problem Statement and Approach . . . . . . . . . . . . . . . . . . . .
63
4.3.1
Prioritization of Location-based Social Network Messages . . . . . .
63
4.3.2
Sensor Data Stream and Social Network Message Workflows . . . .
64
4.4
Case Studies and Experimental Setup . . . . . . . . . . . . . . . . . .
65
4.4.1
Case Study: Flash Floods in Brazil . . . . . . . . . . . . . . . . . . . .
66
4.4.2
Experimental Setup . . . . . . . . . . . . . . . . . . . . . . . . . . . . .
66
4.5
Results and Analysis . . . . . . . . . . . . . . . . . . . . . . . . . . . .
67
4.6
Final Remarks . . . . . . . . . . . . . . . . . . . . . . . . . . . . . . . .
70
5
TOWARDS A MIDDLEWARE TO DYNAMICALLY MANAGE HETEROGENEOUS GEOSENSORS IN NEAR REAL-TIME FOR DISASTER MANAGEMENT . . . . . . . . . . . . . . . . . . . . . . . . 73
5.1
Introduction . . . . . . . . . . . . . . . . . . . . . . . . . . . . . . . . .
73
5.2
Related Works . . . . . . . . . . . . . . . . . . . . . . . . . . . . . . . .
74
5.3
AGORA - DYNAMIC SENSOR MANAGEMENT APPROACH . . .
75
5.3.1
Sensor Layer . . . . . . . . . . . . . . . . . . . . . . . . . . . . . . . . .
76
5.3.2
Middleware Layer . . . . . . . . . . . . . . . . . . . . . . . . . . . . . .
76
5.3.2.1
Sensor Registration . . . . . . . . . . . . . . . . . . . . . . . . . . . . . .
77
5.3.2.2
Publish Observation . . . . . . . . . . . . . . . . . . . . . . . . . . . . . .
78
5.3.2.3
Sensor Updating . . . . . . . . . . . . . . . . . . . . . . . . . . . . . . . .
78
5.3.3
Application Layer . . . . . . . . . . . . . . . . . . . . . . . . . . . . . .
79
5.4
Deployment and Analysis . . . . . . . . . . . . . . . . . . . . . . . . .
79
5.4.1
Deployment of AGORA-DSM in the Flood Risk Management . . .
79
5.4.2
Performance Evaluation . . . . . . . . . . . . . . . . . . . . . . . . . .
81
5.5
Final Remarks . . . . . . . . . . . . . . . . . . . . . . . . . . . . . . . .
83
6
CONCLUSION . . . . . . . . . . . . . . . . . . . . . . . . . . . . . . 87
6.1
Discussion and Final Considerations . . . . . . . . . . . . . . . . . . .
87
6.2
Future Works . . . . . . . . . . . . . . . . . . . . . . . . . . . . . . . . .
88
6.2.1
Citizen as Sensors . . . . . . . . . . . . . . . . . . . . . . . . . . . . . .
89
6.2.2
Publish-Subscribe Mechanism . . . . . . . . . . . . . . . . . . . . . . .
90
6.2.3
AGORA-GeoDashboard - Flood Web Application . . . . . . . . . . .
91
BIBLIOGRAPHY . . . . . . . . . . . . . . . . . . . . . . . . . . . . . . . . . . . 93 APPENDIX A
IMPLEMENTATION DETAILS . . . . . . . . . . . . . 105
23
CHAPTER
1 INTRODUCTION
The aim of this thesis is to describe an approach to manage geosensors involved in flood risk management dynamically in an interoperable manner. The remainder of this chapter is structured as follows. To start with, Section 1.1 outlines the reasons for carrying out this project. Following this, the Section 1.2 outlines the background together with the required improvements that are involved in designing a service-oriented middleware for flood risk management. Section 1.3 describes the context of the research, while Section 1.4 defines the research question and objectives of this project. Finally, Section 1.5 provides shows an overview of the methodological strategy that is adopted. Section 1.6 describes how the following chapters of the thesis will be organized.
1.1
Motivating factors
According to the United Nations (UN1 ), of all natural phenomena it is floods which cause the most damage2 . For this reason, National Government Agencies have deployed stationary sensors to help people build resilience against floods. However, these sensors only provide historical datasets that give information about features such as water level, temperature and pressure. Managing floods by checking unevenly distributed sensors with discrete measurements and estimating the hazardous areas, are insufficient to help people make quick decisions based on updated data (LEYH et al., 2012). This is because a larger amount of sensor data available in near real-time is necessary to ensure their predictions are more realistic and reduce the impact caused by the flood disaster. In addition to stationary sensors, mobile sensors such as Unmanned Aerial Systems (UAS) have also been used to monitor disasters since they can show more images and reach greater distances than stationary sensors. 1 2
http://www.preventionweb.net/english/hazards/statistics/?hid=62 http://www.preventionweb.net/english/countries/statistics/?cid=24
24
Chapter 1. Introduction
Since stationary and mobile sensors can provide geo-referenced observations, they are also known as geosensors (STASCH; BRÖRING; WALKOWSKI, 2008). When they are dynamically combined, they have a great potential for better decision-making. However, this is difficult since there is a wide range of geosensor protocols and interfaces (BEDER et al., 2013b). The Open Geospatial Consortium (OGC) has freed the applications from the idiosyncrasies of geosensor implementation by means of an initiative called Sensor Web Enablement (SWE) which lays down standards that provide rules and guidelines for geosensor interoperability connected to the web (BUEHLER; REED, 2011). SWE has an infrastructure that enables the interoperable use of geosensor resources, by ensuring that they can carry out different tasks such as gaining access to observations and conducting an analysis of risk situations (BOTTS et al., 2007). However, SWE is unable to manage contexts in which geosensors can be embedded and removed dynamically. For example, geosensors may fail as a result of a lack of battery power or continuously provide distinct geographical information, among other factors. This dynamic context makes it a complex task to control and gain access to the heterogeneous geosensors, as well as handling the geosensor discovery as a way of clustering information (JIRKA; BRÖRING; STASCH, 2009). For example, it is difficult to find all the geosensors that provide a certain measurement, or work either in a particular locality or at a specific time. To illustrate these problems, Figure 1 shows presents a dynamic context with depicting two subsequent moments represented by (1) and (2) geosensors in a monitored region.
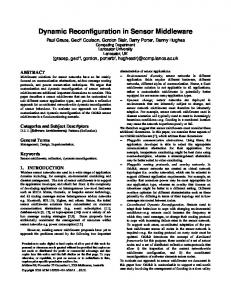
Figure 1 – Dynamic context involving stationary and mobile sensors.
The dynamic context is represented by a mobile sensor, and three stationary sensors. All the geosensors are represented by letters, which are placed next to them. The data is sent to the geosensor sink node, which is responsible for the final reception of the data inside the network. The users are able to access all the sensor data when they use the Internet. At the moment (1), the application must manage three stationary sensors and one mobile sensor, which will have a varied location over time. At the moment (2), the battery of one stationary sensor fails to make a disconnection from the network. Before it can explore all the means of obtaining data in this
1.2. Background
25
kind of situation, an application must be able to discover and access the assets of the geosensors in a particular region or time. Dealing with all the problems outlined above is a challenge that must address the following factors: (1) managing the large and variable number of geosensors at any given time in the sensor field; (2) managing the random distribution of geosensors; (3) managing the different types of geosensors, and the distinct format and flow rate of their data; (4) overcoming the SWE limitations in dynamic scenarios; (5) integrating sensor data with applications while taking account of reusability and interoperability (JIRKA; BRÖRING; STASCH, 2009; BRÖRING et al., 2011; CHEN et al., 2014). Moreover, when managing the heterogeneous geosensors involved in flood risk management, the following two activities must be carried out: (1) the discovery of heterogeneous geosensors in a dynamic context; and (2) access obtained to data from these geosensors in near real-time. This is based on the premise that a service-oriented middleware platform is an alternative way of managing dynamically heterogeneous geosensors involved in flood risk management by complying with SWE standards. If a generic approach is adopted, that allows interoperable communication between geosensors and applications, this can lead to the reuse of components by means of design patterns and open services, as well as improving the availability of sensor data.
1.2
Background
This section aims to define the basic concepts and the most important terms involved in this project.
1.2.1
Flood Risk Management
Owing to the increase in the number of natural disasters that have affected many people, there has been a search for ways to improve the resilience and adaptability of the affected communities (MENDIONDO, 2010). Floods frequently occur around the world, so an ability to manage flood risks can help to reduce their effects. Flood risk management includes a set of activities that involves pre-flood planning, managing emergency situations and post-flood recovery. The purpose of these activities is to mitigate their social, economic, and environmental impact (AHMAD; SIMONOVIC, 2006). Pre-flood planning is designed to reduce the extent of the damage caused by a flood, e.g. by drawing up evacuation plans. Emergency management ensures that planned tasks are executed during floods. Post-flood recovery enables communities to return and adapt to their circumstances, as they were before the floods (SIMONOVIC, 1999). As can be seen, flood risk management is a complex cyclical task which comprises specific tasks which must be carried out before, during and after the floods (SIMONOVIC, 1999). Updated knowledge of river conditions also plays an important role in supporting decision-
26
Chapter 1. Introduction
making in some countries, since there are several technical factors that can prevent this kind of information from being obtained. For example, countries where there are flash floods caused by either heavy rains or the overflow of streams, and where there are narrow gullies, need this kind of management to mitigate the damage caused to the local infrastructure. This means that emergency agencies have to cope with the risk of human casualties and the extent of flood damage in their decision-making. Three key factors can ensure the effectiveness of flood risk management and the accuracy of decisions made by the emergency agencies: (1) a fast, integrated and reliable response time on the part of government agencies (OSTERMANN; SPINSANTI, 2011); (2) ensuring that there is not a lack of detailed and up-to-date information regarding information about the affected areas (TU; LI; LIU, 2009), and (3) introducing interoperable standards among the existing systems (BAHARIN; SHIBGHATULLAH; OTHMAN, 2009).
1.2.2
Service-Oriented Middleware
According to (HEINZELMAN et al., 2004), there is a middleware that can bridge the gap between low-level components of sensor networks and applications, by simplifying the interactions between them and making their operations useful at a local level. In turn, a middleware can be seen as a software with tools that can hide the complexity and heterogeneity of the basic hardware and network platforms, by making it easier to operate the resource management systems and adding predictability to the executions of the application (WANG et al., 2008). A middleware is able to address some of the challenges of sensor networks effectively, particularly with regard to the enduring features and limited resources of these systems. For example, a middleware can propose mechanisms that allow applications to discover services; this is useful in dynamic sensor networks since sensors and/or services are interchangeably available (HEINZELMAN et al., 2004). According to (HADIM; MOHAMED, 2006c), in constructing a middleware for sensor networks, a number of factors must be taken into account such as power management, scalability, mobility, heterogeneity, ease of use and transparency of sensor networks. For this reason, a middleware must be able to manage the efficient use of memory and network processing in which its nodes are able to communicate. This communication is carried out by switching its power transmission by means of several types of hardware as well as being aware that the network can grow regardless of place and time. Similarly, a middleware must encapsulate the complexity of both APIs and resources so that it can handle several heterogeneous abstract models by using a user-friendly interface. According to (BRORING; FOERSTER; JIRKA, 2010), the research conducted by (WANG et al., 2008) shows that most of the middleware solutions for wireless sensor networks are
1.3. Research Context
27
concerned with low-level features while a few focus on the reduction of efforts to integrate sensor networks and the Sensor Web (LEVIS; CULLER, 2002). (BARR et al., 2002; ABDELZAHER et al., 2004; LIU; MARTONOSI, 2003; HEINZELMAN et al., 2004; SRISATHAPORNPHAT; JAIKAEO; SHEN, 2000; YU et al., 2003) and Cougar3 are exemplary middleware solutions that address low-level features (HADIM; MOHAMED, 2006b). In addition, these solutions are not confined to the context of disaster management, while a specific middleware solution for sensor networks was proposed which was designed for environmental monitoring, without using the concept of Sensor Web (HUGHES et al., 2011). In (ABERER; HAUSWIRTH, 2006) and (SGROI et al., 2005), the authors define middleware solutions that integrate sensors and sensor data, without complying with OGC standards. For this reason, a logical bus (BROERING et al., 2010), along with a design and pattern proposed by (HOHPE; WOOLF, 2004) was proposed. This, comprises the following: (1) a communication infrastructure, (2) a shared set of adapter interfaces and (3) a well-defined message protocol, which can reduce the effort required to integrate the Sensor Web with the sensor networks. However, this approach does not include the management of the dynamic context and near real-time geosensor data management. Moreover, it involves difficulties in the remaining requirements for managing situations where that sensors are embedded and removed in near real-time. These include the following: a) accessing a different sensor data flow rate and format (GEIPEL et al., 2015; CHEN et al., 2015b), b) keeping the sensor updates available in near real-time (PARK; CHO; KIM, 2012; BAKILLAH et al., 2015), c) adopting a generic approach to enable interoperable communication and reusable components, and d) enabling the exchange of large volumes of data between applications and devices with limited capabilities (TAMAYO; GRANELL; HUERTA, 2012; ARNABOLDI et al., 2013). This means that, since none of the previous studies completely fill the gap between geosensors and Sensor Web, there are still no complete solutions to the problem of embodying new sensors dynamically (”on-the-fly integration”) in an automated manner (”plug & play”) for flood risk management. These operations still require a considerable amount of configuration and customization from the applications. Further explanations about the sensor plug & play concept can be found in Chapter 2.
1.3
Research Context
This project was interfaced, within the context of [FAPESP 2012/18675-1] in particular, which proposes A Geospatial Open collaboRative Architecture for Building Resilience against Disasters and Extreme Events (AGORA). The term AGORA is derived from the Greek word for the birthplace of democracy, and also refers to a transdisciplinary research endeavour to fill the gap between science and society. AGORA here enables organisations and individuals to provide 3
www.cs.cornell.edu/database/cougar
28
Chapter 1. Introduction
information to a common platform using Web 2.0 technologies so that this information can be dynamically analysed by different stakeholders and improve the decision-making involved for building resilience against flooding in a standardised fashion. The components of AGORA consist of methods for near real-time analysis that combine information from several sources for flood risk monitoring. This is accomplished by fusing, integrating and creating traditional and new geographic information sources by employing novel methods. This collaborative approach aims to improve and support the decision-making, as well as the availability and quality of the information required for flood risk management (ALBUQUERQUE; ZIPF, 2012). Figure 2 shows depicts the three pillars that underpin the AGORA architecture: Acquisition, Integration and Application.
Figure 2 – AGORA components of the architecture4 .
The challenge of AGORA is how to make available accurate, timely and complete information for the climate change adaptation and resistance required by both locals in vulnerable areas and decision- makers. Since environmental variables related to a specific geographic region are important assets to reduce the impact of these disasters, the ability to design and deploy a collaborative SDI geoportal is important. This SDI geoportal is community-based and seeks to monitor the environment in a collaborative way by integrating real-time sensor and volunteer data, early-warning alerts and climate change models. 4
http://www.agora.icmc.usp.br/site/componentes/
1.4. Research Question and Objectives
29
The geoportal also enables the management, concentration, sharing and visualization of different types of data sources that take full account of the vulnerability and strategies required for flood risk management. The research framework of AGORA is designed to structure the problems, information needs, risk perception and motivational factors of the communities with regard to the risks incurred by water-related climate change. Furthermore, AGORA provides indicators based on both the ISO criteria and community evaluation of the geoinformation by effectively following the stages of processing, analysing and communicating. AGORA interfaces projects regarding the assessment of the impact of, and vulnerability to, climate change in Brazil and adopts strategies for adaptation, as well as introducing a wireless sensor network for monitoring pollution and urban rivers. This assessment consists of a large-scale project that involves a multidisciplinary group of researchers who are given the task of carrying out studies and making an assessment of the vulnerability of communities and their ability to adapt to climate change in Brazil. The project combines local climate change projections and vulnerability indexes based on environmental, geographical-geophysical and social information to identify hazardous areas that might be subject to climate stress, and to map the vulnerability of the people in the State of São Paulo. This project represents the AGORA-DSM module (AGORA - Dynamic Sensor Management) shown in the Acquisition Layer. It supplements the [Universal CNPq 477499/2012-0] ˆ Some of the and [FAPESP 2008/58161-1] projects, and interfaces with the project [RNP CIA2]. publications related to this project that are not covered in the text are (HORITA et al., 2013) and (HORITA et al., 2014). The implementation details are attached as Appendix A.
1.4
Research Question and Objectives This project aims to answer the following research question:
RQ) How is it possible to dynamically manage heterogeneous geosensors employed for flood risk management in near real-time?
An attempt to answer this question requires a service-oriented middleware that conforms to SWE standards so that it can manage dynamically heterogeneous geosensors involved in flood risk management. This involves: 1) the discovery of heterogeneous geosensors in a dynamic context; and 2) providing communities with access to geosensor data in a timely and accurate manner. The general objective can be achieved by setting out four specific objectives: 1) Identifying, evaluating and interpreting studies that examine the geosensor plug-andplay in the Sensor Web. 2) Integrating geosensors employed for flood risk management into the Sensor Web.
30
Chapter 1. Introduction
3) Conducting an experimental evaluation of the proposed middleware by building an application that uses the sensor data gathered by the middleware. 4) Designing and implementing a middleware that is capable of managing geosensors dynamically in near real-time.
1.5
A Methodological Overview
The project was divided into four stages: (1) a literature review; (2) the creation of a mechanism to integrate heterogeneous sensors into the Sensor Web; (3) a flood web application; and, (4) a service-oriented middleware to manage heterogeneous geosensors. The first stage was to carry out a literature review by means of a systematic method, also known in the literature, as systematic mapping (KITCHENHAM; CHARTERS, 2007). The purpose of this was to identify, evaluate and interpret the strengths and weaknesses of the existing approaches, techniques and procedures when adopted for the dynamic integration of geosensors into the Sensor Web. In the second stage, we aimed at automatically integrating heterogeneous sensors into the Sensor Web, by using an interoperable solution for sensors involved in dynamic scenarios in which sensors can be embedded and removed on-the-fly, such as those employed in flood risk management. This dynamic integration is important because the Sensor Web cannot be managed effectively completely when sensors either fail because of a lack of battery power or move over time. This stage was useful because Sensor Web needs to manage the changes in the availability of sensor data, as well as to keep track of the mobile sensors. Dealing with all these issues is not a trivial task because different types of stationary and mobile sensors are involved and these lead to a wide range of data types and formats at different flow rates. To evaluate the middleware an application was designed that receives the sensor data provided by the AGORA-DSM, with the aim of automatically giving priority to social media messages based on real-time sensor data streams (ASSIS et al., 2015a; ASSIS et al., 2015b). The purpose of this is to ensure that when they are combined, they provide accurate and useful information for flood risk management. Although most of the current approaches seek to obtain useful information within a social network in an offline manner, without combining different data sources, it would more feasible for the applications if this combination could be more fully exploited in real-time. This conclusion was reached from was based on an analysis that examines the spatio-temporal characteristics of social network messages. as well as of the closest hydrological stations. The last stage entailed building a middleware that contains a Sensor Web Infrastructure responsible for connecting heterogeneous geosensors and disaster applications. Since the combination of heterogeneous geosensors has a great potential, one of the main difficulties is how to combine and discover them dynamically and thus improve the decision-making. The task of combining all of them requires the following: (i) a wide range of sensor protocols and interfaces;
1.6. Organization of this Thesis
31
(ii) most applications should still carry out integration by only using their own mechanisms; and (iii) a set of services to store, process and provide the combined sensor data. SWE can make it easier to address these issues but further developments are still required. This led us to adopt a generic approach to enable interoperable communication between sensors and applications, as well as allow the components to be reused. In this stage, the middleware was designed and implemented with the aid of Java programming, in a service-oriented manner based on (BROERING et al., 2010), the dynamic management of real-time geosensor data. Figure 3 shows is a flow chart of the objectives, methods and results of this thesis. It describes the specific goals and all the methodological steps taken to ensure that the results were achieved.
Figure 3 – Flow Chart of the objectives, methods and results.
1.6
Organization of this Thesis
The remainder of this thesis is organized as a series of papers published, that have been submitted for publication but not yet accepted and papers that could be submitted. Chapter 2 contains a systematic literature mapping of approaches to integrate dynamically heterogeneous sensors into the Sensor Web (Objective 1). Chapter 3 (ASSIS et al., 2016) was accepted at the 30th IEEE International Conference on Advanced Information Networking and Applications (AINA-2016) and describes a dynamic sensor management component that extends the Sensor
32
Chapter 1. Introduction
Web for near real-time mobile sensor integration in dynamic scenarios (Objective 2). Chapter 4 was accepted at the 35th Brazilian Computer Society Conference (CSBC-2015) (ASSIS et al., 2015a) and 16th Brazilian Symposium on Geoinformatics (GEOINFO-2015) (ASSIS et al., 2015b) and outlines an automated geographical prioritization of social network messages using sensor data stream: an application to floods (Objective 3). Chapter 5 presents a service-oriented middleware for dynamic, near real-time management of heterogeneous geosensors for flood risk management (Objective 4). Chapter 6 closes with discussions and conclusions of the project, as well as it outlines the future works. The Appendix A describes the implementation details of the middleware and the flood web application. As shown in the list of publications above, this study can be entirely attributed to the work of the author. Any collaborative activities carried out have been highlighted and any material that is not in his possession has been fully acknowledged.
33
CHAPTER
2 DYNAMIC INTEGRATION OF HETEROGENEOUS SENSORS INTO THE SENSOR WEB: A SYSTEMATIC MAPPING OF THE LITERATURE
2.1
Introduction
Heterogeneous sensors refer to several types of sensor nodes with different abilities (WU; CHUNG, 2007). Even though heterogeneous sensor networks have a large variety of sensor nodes capacity in terms of sensing, computation processing, communication links and power consumption, they have a better performance when compared to traditional sensor networks, which consist of sensors with the same configuration (SAMUNDISWARY; PRIYADARSHINI; DANANJAYAN, 2009). Here we are considering heterogeneity as a term to define different sensor specifications and implementations. This heterogeneity started causing interoperability problems since every time an application was interesting on a specific sensor, it should concern about their particularities for gathering their data. So making sensors available on the web in a standardised manner became interesting once it would not be necessary to concern about each sensor specification any more. These web-accessible sensors also known as Sensor Web start being easily discovery within all the applications. In order to isolate application from heterogeneous sensors, Open Geospatial Consortium (OGC1 ) developed an initiative called Sensor Web Enablement (SWE), which defines standard activities based on rules and guidelines to improve interoperability of web-accessible sensor and solve a diversity of protocols, interfaces and devices (BOTTS et al., 2008; BUEHLER; REED, 2011). 1
http://www.opengeospatial.org
34
Chapter 2. Dynamic integration of heterogeneous sensors into the Sensor Web: A Systematic Mapping of the Literature
Although Sensor Web acts as an intermediary layer between sensors and applications, it still needs to address important requirements regarding dynamic integration of heterogeneous sensors on the web. For an application integrating sensors in this way, it must consider efforts to adapt a set of required Sensor Web operations and other mechanisms that are still missing in Sensor Web. Besides providing intelligence to the sensor network system for operating autonomously with minimal user intervention in different scenarios and contexts (PATHAN; TAYLOR; COMPTON, 2010), these further developments must consider a set of open standards, semantic correspondences, loosely coupling services for promoting their reuse, easily adaptation and composition, and consequently, real-time sensor data. All these further developments help to integrate sensors and Sensor Web automatically in a generic manner. However, existing approaches also must consider a high concentration of heterogeneous sensors deployed in a high dynamic scenario (BRÖRING et al., 2011). This new scenario considered "dynamic", where a larger amount of heterogeneous sensors are continuously installed and removed within the sensor field hinder web-accessible sensor control and access within the application (JIRKA; BRÖRING; STASCH, 2009). Due to the current relevance of integrating heterogeneous sensors into the Sensor Web and the uncertainty about whether existing approaches address this new dynamic scenario, a broad review of primary studies approaching both themes is not only interesting but also necessary. We performed this broad review as a formal and systematic approach to identify strengths and weaknesses of the main functionalities of existing approaches, evidence clusters groups, as well as to represent this specific domain at a high level of granularity (KEELE, 2007). The remaining paper is structured as follows. Section 2 contains a background. Section 3 describes the systematic and formal method used to search studies related to the topic of this project. Section 4 comprises of a discussion about the research questions approached by the systematic mapping. Finally, Section 6 presents a conclusion.
2.2
Background
2.2.1
Sensor Web
A sensor can be defined as a device that receives stimulus and respond with electrical signals (FRADEN; KING, 1998). One or more sensors can be used, along with a processor, a memory, an energy supply, a radio and an actuator, for composing a sensor node, which is capable of sensing, measuring and gathering data from an environment (YICK; MUKHERJEE; GHOSAL, 2008). Unlike traditional networks, where sensor nodes gather data and transmit them to an uplink point, Sensor Web nodes change their behavior and act according to the gathered data (DELIN, 2002). Sensor Web is a macro-instrument, suitable for environmental monitoring and
2.2. Background
35
exploration, where sensor nodes interact with each other leading to a synergy similar to that performed by neurons inside the brain (DELIN; JACKSON, 2001). These sensor nodes could be orbital or terrestrial, fixed or mobile (DELIN, 2005). Nevertheless, the term Sensor Web has also been used to designate an intermediary layer, which integrates sensor networks and web applications (BRÖRING et al., 2011). An Open Geospatial Consortium (OGC) created an initiative, considering this new Sensor Web meaning, called Sensor Web Enablement (SWE). Then Sensor Web has become more broadly known as web-accessible sensor networks and archived sensor data, that can be discovered and accessed through standard protocols and application programming interfaces (APIs) (BOTTS et al., 2008). SWE initiative also defines open standard protocols to establish a clear and transparent communication between sensor and application layer (BOTTS et al., 2008). These open standards helps to explore web-accessible sensors, to activate sensor discovery, to exchange and process sensor observations, and to allocate tasks to specific sensors systems (SIMONIS, 2008). The new generation of SWE has been divided into three main layers: (1) Sensor Layer consists of hardware devices as standardized sensors and proprietary communications protocols; (2) Sensor Web Layer connects sensors and applications; and, (3) Application Layer which contains the interaction with end users or computers (BRÖRING et al., 2011). The main specifications established by the new generation of SWE are Observations & Measurements (O&M); Sensor Model Language (SensorML); Sensor Observation Service (SOS); Sensor Planning Service (SPS); Sensor Event Service (SES); Sensor Observable Registry (SOR); Sensor Instance Registry (SIR) and Event Pattern Markup Language (EPML).
2.2.2
Sensor plug-and-play
Normally, plug-and-play concept is associated with an automatic recognition of devices in computers by combining drivers to achieve the device discovery and allocate resources to them (ABDULRAZAK; HELAL, 2006). Similarly, sensor plug-and-play is associated with the insertion and removal of a sensor in a sensor network without changing the sensor network configuration. An important step in this direction was the specification of TEDS by IEEE 1451.2. TEDS interfaces provide a standardizable mechanism for sensor plug-and-play (LEE, 2000), as well as allow sensors to send its description and identification to a control unit within a system (O’FLYRM et al., 2007). Sensor plug-and-play addresses sensor networks communication and configuration management problems (DUNBAR, 2001), and its applications range from smart space (KING et al., 2006) to wireless patient monitoring (FALCK et al., 2007) and water quality monitoring (O’FLYRM et al., 2007). We can cite other applications such as smart sensor networks that can operate automati-
36
Chapter 2. Dynamic integration of heterogeneous sensors into the Sensor Web: A Systematic Mapping of the Literature
cally with minimal human intervention in different contexts and an automatically recognition of devices in domestic environments (PATHAN; TAYLOR; COMPTON, 2010; MILLER et al., 2001). These devices can identify each other in a self-configuring network without considering the underlying physical and transport layers. Sensor plug-and-play for the Sensor Web involves storing dynamically sensor data on the web. This needs lots of efforts since detailed knowledge of both sensor network format and SWE standards are necessary, as well as an internal adaptation of the SWE standards to specific sensor interfaces (BROERING; BELOW; FOERSTER, 2010; WALTER; NASH, 2009). Integrating heterogeneous sensors involved in a dynamic scenario where a high concentration of sensors, which leave and join the network continuously, into the Sensor Web still poses some challenges (BROERING; BELOW; FOERSTER, 2010). This scenario imposes further developments and adaptations to the Sensor Web standards. Since it is unclear in the literature what are the main functionalities, challenges and limitations of existing approaches aiming to integrate heterogeneous sensors into the Sensor Web automatically, we did a literature review to overlap this needs.
2.3
Sistematic Mapping Method
In software engineering and in many other disciplines, a formal and systematic approach has been adopted to identify, evaluate and interpret all relevant studies available in the literature to answer a particular research question or a phenomenon of interest. This approach is called of Systematic Literature Review (SLR) (BUDGEN et al., 2008). Similarly, a Systematic Mapping (SM) provides an objective and systematic procedure for discovering relevant primary studies (BUDGEN et al., 2008). This SM follows a well-defined and rigorous sequence of steps based on a developed protocol. This protocol contains the process adopted by the researchers, and prevents the introduction of biases, because without it, this SM could have been directed by researchers interests, resulting in unreliable results (MAFRA; TRAVASSOS, 2006). The process adopted to conduct this SM involves three main phases: planning, conduction and results publication (Figure 4), based on (KEELE, 2007). Particularly, this SM aims to identify, evaluate and interpret studies, which contain sensor plug-and-play or dynamic integration of sensors approaches for the Sensor Web. At first, we defined our Research Questions (RQs), which are the basis of the conducted research and helped to formulate the search string. This was the most important activity of this phase because it was difficult to define precise RQs, but we elaborated such questions based on the PICO criteria (Population, Intervation, Comparison and Outcome) (KEELE, 2007). PICO aimed to frame and structure our RQs since the Population can reduce the amount
37
2.3. Sistematic Mapping Method
Figure 4 – Research Method.
of primary studies perspectives, Intervention is the procedure that addresses a specific point, Comparison is not applied to SM, and Outcome are important factors that the intervention provides (KEELE, 2007). 1. Population: approaches to dynamically integrate sensors into the Sensor Web. 2. Intervention: plug-and-play. 3. Comparison: not applied. 4. Outcome: scalability, reusability, interoperability and standardizable of these approaches. For the conduction of this SM, we defined two RQs. RQ 1) Which approaches to plug-and-play have been deployed to dynamically integrate sensors into the Sensor Web? RQ 2) What are the challenges and limitations of these approaches? The search process of this SM involved different data sources such as electronic databases, conferences proceedings and journals. In the electronic databases search, also known as automatic search, it was applied a search string that represented the main points discussed in the RQs. In this sense, the strategy for defining the search string was composed of three steps. In the first step, we identified the main terms of the RQ. In the second step, we identified the synonyms for each selected term defined in the first step. In the last step, we used boolean operators to unify the identified terms in the second step (Figure 5). Although we search for approaches that dynamic integrate sensors into the Sensor Web, the search string contains the plug-and-play concept since integration and its synonymous did not give any relevance contribution to the results. Then after formulating the search string, we
38
Chapter 2. Dynamic integration of heterogeneous sensors into the Sensor Web: A Systematic Mapping of the Literature
Figure 5 – Search Key Terms.
identified electronic databases (Table 2) where we could applied the search string to find primary studies with potential to answer the RQs (BIOLCHINI et al., 2005). After searching for the primary studies within the electronic database, we applied the following inclusion and exclusion criteria to support this selection phase. The main objective of these criteria was to identify the relevance of each study that might become a candidate to answer the RQs. Inclusion Criteria: ∙ A study that approaches sensor plug-and-play for sensor web. ∙ A study that involves a middleware between Sensor Web and sensors. ∙ A study that approaches plug-and-play for web-accessible sensors. ∙ A study that approaches dynamic management of sensor networks. Exclusion Criteria: ∙ A study that is a presentation, poster, tutorials, dissertations, thesis and book chapters. ∙ A study that is not written in English or Portuguese. ∙ A study that is unavailable. ∙ A study that has a quality assessment below than 4 points. ∙ A study that focuses on lower level functionality. ∙ A study unrelated to Sensor Web and plug-and-play. ∙ A study related to Sensor Web and unrelated to any approach to connect sensors into the Sensor Web. ∙ A duplicated study.
39
2.3. Sistematic Mapping Method
Besides the inclusion criteria, we also proposed eight quality criteria to evaluate the studies after the full-text reading. For each criterion, we applied the following scale: Yes (S) = 1 point, No (N) = 0 point and Partially (P) = 0.5 points. Finally, we used the quality criteria pontuation as an exclusion criterion. We excluded the primary studies that reached a score lower than 4 points. Table 1 depicts these quality criteria. Table 1 – Quality Criteria.
ID QC1 QC2 QC3 QC4 QC5 QC6 QC7 QC8
Quality Criteria Were the goals clear? Was there a context description? Was the documentation proper? Were the results impartial analyzed? Were the results clear? Did it add results value to the research area? Did it use oriented-service architecture as a solution? Did it use OGC standards?
In the conduction phase, we executed our research plan using the electronic databases proposed by (BRERETON et al., 2007). Table 2 – Electronic Databases.
Electronic Database Electronic Address SCOPUS www.scopus.com ACM Digital Library www.portal.acm.org IEEE Xplore www.ieeexplore.ieee.org Springer Link www.springerlink.com Science Direct www.sciencedirect.com Web of Knowledge www.webofknowledge.com Evaluating the electronic database performance is also an important step within the search process. One way to investigate this performance is to verify if an engine search returned a set of previously selected primary studies. This set of primary studies is known as “gold standard” (ZHANG; BABAR; TELL, 2011), and also helped to refine the search string. In the first step of this SM, electronic databases returned 107 primary studies. Springer returned 74 studies, SCOPUS returned 15, ACM returned 11, IEEE Xplore returned 7 and Web of Knowledge returned 1, considering the duplicated studies. Science Direct returned no primary study. In the second step, we read the title and abstract of the 107 returned primary studies and applied the inclusion and exclusion criteria. Two researchers performed the reading of the title and abstract independently, and in case of disagreement, a third researcher read. In the third step, we read the introduction and conclusion of each study and applied the inclusion and exclusion criteria again. After this, only 14 primary studies left. In the fourth step, we read all selected studies chose in the previous step, and we included all of their data.
40
Chapter 2. Dynamic integration of heterogeneous sensors into the Sensor Web: A Systematic Mapping of the Literature
Figure 6 – Studies Search Details.
Besides the automatic search, we included 6 primary studies based on experts opinion and 5 searching by reference, as we can see in Figure 6. Then, based on the 25 primary studies, we extracted their objective and subjective results to answer the RQs. Study ID, Title, Author(s), Abstract, Year of Publication, Publication Vehicle, Institution Country, Electronic Database were objective results. While Research Context, Study Goals, Methodology, Architecture Approach, Sensor Activities, Hardware Components and Approach Evaluation were subjective results. We solved the disagreements about data extraction by consensus between the researchers. Table 3 – Summary of the approaches and their main functionalities. SWE X
1 ✗
2
✗
X X X X
X X
✗ ✗ ✗ ✗ ✗ ✗ ✗ ✗
✗
3 ✗
4 ✗
5 ✗
Main Functionalities 6 7 8 9 10 ✗ ✗ ✗ ✗ ✗
✗
✗
✗
✗
✗ ✗ ✗ ✗ ✗
✗ ✗
✗ ✗
✗ ✗
✗ ✗ ✗
✗ ✗
✗ ✗ ✗
✗
✗
✗
Research Group - References 11 ✗
12
13 ✗
✗ ✗
✗ ✗ ✗ ✗ ✗ ✗ ✗
✗ ✗ ✗
✗ ✗ ✗ ✗
✗ ✗ ✗
✗ ✗ ✗ ✗ ✗ ✗ ✗ ✗ ✗ ✗
✗ ✗ ✗
✗
✗ ✗ ✗ ✗ ✗ ✗ ✗ ✗ ✗ ✗ ✗
✗ ✗ ✗ ✗ ✗ * Functionalities 1. Sensor Registration 3. Data Publication 5. Service Registration 7. Sensor Tasking 9. Sensor Subscription 11. Semantic Correspondence between Sensors and Services 13. Access to Service Metadata
✗
✗
✗ ✗
✗ ✗ ✗ ✗
✗
(BROERING et al., 2010), (BRÖRING et al., 2009), (BRORING; FOERSTER; JIRKA, 2010), (BRÖRING et al., 2011), (FOERSTER et al., 2012), (MALEWSKI et al., 2013), (DÍAZ et al., 2013) (CIANCETTA et al., 2007), (CIANCETTA et al., 2010b), (CIANCETTA et al., 2008), (CIANCETTA et al., 2010a) (ABANGAR et al., 2010) (PANANGADAN et al., 2012) (TREVATHAN et al., 2010) (WANG et al., 2007) (ZEEB et al., 2009) (COULSON et al., 2008), (PORTER; COULSON, 2009), (COSTA et al., 2007) (LIANG; HUANG, 2013) (BEDER et al., 2013b) (HUGHES et al., 2009) (WOLFF et al., 2007) (HANSSON et al., 2004) (BRUNETON et al., 2006)
2. Selection of Specific Sensors 4. Observation Repository 6. Access to Sensor Metadata 8. Access to Sensor Historical Data 10. Access to Sensor Near Real-Time Data 12. Service Subscription
2.4. Discussion
2.4
41
Discussion
This section contains answers to the RQs shown in previously section. The RQs were:(1) Which approaches to plug-and-play have been deployed to integrate dynamically sensors into the Sensor Web?; (2) What are the challenges and limitations of these approaches?. In (CIANCETTA et al., 2010a), the authors address components responsible for loading the network and interacting with end devices. These components communicate with each other using web service interfaces. Although these web services interfaces helps to store component data and most likely mitigate data access failures, they cannot be provided in a dynamic manner, that is, if new services are added, removed or working properly is not clear. On the other hand, an unified interface is capable of loading new types of sensors to a running system, as well as abstracting sensor features. However, a sensor abstract layer based on this unified interface and a plug-in-based model did not provide good results considering good scalability and interoperability (TREVATHAN et al., 2010). Component models for wireless sensor networks can also be used to plug-and-play sensors into the Sensor Web (WOLFF et al., 2007; HANSSON et al., 2004; HUGHES et al., 2009; PORTER; COULSON, 2009; COSTA et al., 2007; BRUNETON et al., 2006; COULSON et al., 2008). These component mostly require further adaptation even though they seek to be as much generic and abstract as other approaches. Most of them adapt sensors only using their own mechanisms without considering any SWE standards. FlexFT overlaps all of these limitations, but it still makes the process to integrate sensors within the Sensor Web complex (BEDER et al., 2013b). Although several applications use service interfaces such as SWE standards and/or Devices Profile for Web Services (DPWS) to integrate dynamically sensors and applications, they still did not consider the high complexity involving Sensor Web (WANG et al., 2007; ZEEB et al., 2009; ABANGAR et al., 2010; PANANGADAN et al., 2012; LIANG; HUANG, 2013). Since it was not yet possible to connect dynamically sensor networks and Sensor Web, five interaction patterns were identified to enable sensor plug-and-play for the Sensor Web (BRORING; FOERSTER; JIRKA, 2010). Based on the interaction patterns, an intermediary layer of a standards-based messaging bus architecture was proposed to reduce the efforts to connect sensors and SWE services. This approach comprises of a common communication infrastructure, a set of adaptable interfaces and a well-defined protocol message (BROERING et al., 2010). Nevertheless, the tests involving this approach did not consider the use of SWE 2.0, which could have provided more advantages considering high dynamic and complex scenarios. Moreover, different standards and topologies, further semantics and sensor management in realworld scenarios should be more investigated and evaluated (BROERING et al., 2010; BRÖRING et al., 2009).
42
Chapter 2. Dynamic integration of heterogeneous sensors into the Sensor Web: A Systematic Mapping of the Literature
Considering semantics, a combination of real-world entities with features, stimuli with sensor inputs, and matching of sensor output with features properties still have to be concerned. (MALEWSKI et al., 2013) describes a mechanism for an automatic mediation between semantic sensors and Sensor Web. This mechanism consists of a sensor metadata translation into the service requirement description, a message protocol and a semantic matchmaking. In addition, there were enhancements of sensor registration and observation publication (DÍAZ et al., 2013), operations described within the interaction patterns, as well as for discovering Sensor Web data, considering spatial, temporal and thematic user context (FOERSTER et al., 2012). After analysing all existing approaches, we list their main functionalities in Table 3. These functionalities mostly correspond to important mechanisms to integrate dynamically sensors and Sensor Web. That is, these mechanisms should be provided to promote the integration of heterogeneous sensors with Sensor Web standards. The sensor and its metadata must be available on the web since it starts measuring at the first time. These sensors also publish data, and hence an observation repository is necessary. This repository must provide historical and near real-time sensor data. Moreover, selection of specific sensors based on thematic, spatial and temporal characteristics at a given time is important for decision-makers in a variety of applications. Receiving sensor data in a push-based manner without requesting are another cited functionality. This functionality is also known as subscription. Besides all these functionalities considering sensors, Sensor Web services must be managed too. Therefore, registers services, accesses their metadata and provide services subscription also facilitates the integration. A semantic correspondence between sensors and services can improve an automatic matchmaking among them. Therefore, since most of exiting approaches use almost the same functionalities, a large genericity considering interoperability and reusability is necessary since this can guarantee open service interfaces and mitigate the coupling among all the components involved. Furthermore, most of the approaches exchange data with a heavy format data which affect real-time application e.g. disaster management. This kind of application requires lots of heterogeneous sensors moving in and out of sensor field. This dynamic scenario requires scalability and adaptability as a high-priority mechanisms.
2.5
Final Remarks
Making sensor data available on the web through a set of open standard protocols and Application Programming Interfaces (APIs) aid approaches to access, discover, process and exchange sensor and sensor observation in a standardizable manner. These web-accessible
2.5. Final Remarks
43
sensors also known as Sensor Web help to integrate sensors with different applications. Integrating dynamically heterogeneous sensors into the Sensor Web, also known as sensor plug-and-play for the Sensor Web, still poses some challenges to the applications since this scenario hinder the control and access to their data once more and more applications are considering an automatic incorporation of new heterogeneous sensors, a deeply analysis in this research topic is interesting. So it was not clear how existing approaches perform this integration and what are their main functionalities, challenges and limitations. A systematic mapping helped to point out all the considerable configuration and adaptation of Sensor Web standards that applications must consider and which mechanisms are still missing within Sensor Web. Although these standards aim to increase interoperability, the findings indicated an increasing need for interoperability to facilitate heterogeneous sensor data exchanging in order to overlap different specifications and protocols. This interoperability does not guarantee services reuse, easily adaptation and composition so most of the existing approaches are still missing generic mechanisms since they solved their problems only using specific solutions. Service interfaces can also reduce the coupling between service providers and consumers by removing their dependence on all layers and encapsulating the service functionalities without impacting consumers. On the other hand, Sensor Web provides a semantic matchmaking correspondence between sensors and Sensor Web services, but a good performance at real-time purposes is still necessary. The varying amount of heterogeneous sensors implies in a constant need for the growing and shrinking of the approach, which must promote a scalability, consequently, high performance. Besides that, most of the approaches comprises functionalities to register sensors, publish their data, makes them available to access in real-time or as historical in an observation repository. These approaches also provide filters based on thematic, spatial and temporal characteristics to select sensors. Sensors can be subscribed too. Existing approaches also provide operations to register, access and subscribe Sensor Web services. Therefore, most of exiting approaches exchange data with a heavy format data which affect near real-time application e.g. disaster management. This kind of application requires lots of heterogeneous sensors moving in and out of sensor field. This dynamic scenario requires more specific mechanisms from Sensor Web to manage better its complex management.
45
CHAPTER
3 DYNAMIC SENSOR MANAGEMENT: EXTENDING SENSOR WEB FOR NEAR REAL-TIME MOBILE SENSOR INTEGRATION IN DYNAMIC SCENARIOS
3.1
Introduction
Wireless sensor networks (WSN) that are entirely composed of stationary sensor nodes, have been found occasionally to be unsuitable for a wide range of applications since they still require great effort to increase their lifetime (PATEL; KAUSHIK, 2009). Many WSN nodes are unable to cover important regions due to failures and, as a result, the network cannot deliver its desired services (FREITAS et al., 2011). For these reasons, mobile sensors have been used for covering the areas where these unstable or problematic nodes lie, whenever real-time data about them is needed. They can reach places where manned systems are unable to carry out safely, as well as can act either as a data relay node or data provider node, by collecting and forwarding data from isolated groups of nodes to connected parts of the WSN (FREITAS et al., 2011). Although stationary and mobile sensors have a great value when working together, the dynamic features of their integration still pose some challenges. Stationary sensors cover an area until they fail, while mobile sensors cover areas as they move through them and disclose them when they move away (LIU et al., 2013). This results in an intermittent connection between these nodes, which is difficult to manage due to the high dynamicity imposed on the data forwarding and the complexity of keeping track of the acquired data updates. In addition, such sensors have distinct protocols and interfaces, which can act as a paramount barrier to their control and access if no interoperability is considered. Most of the existing approaches only carry out this integration using either proprietary
Chapter 3. Dynamic Sensor Management: Extending Sensor Web for Near Real-Time Mobile Sensor Integration in 46 Dynamic Scenarios
mechanisms or a particular platform that targets specific hardware and software technologies. In order to improve the interoperability of this integration, an intermediary layer called Sensor Web was created to establish a clear and transparent communication between sensors and applications (BRÖRING et al., 2011). Open Geospatial Consortium (OGC1 ) has supported this approach by providing a set of standard activities, rules and guidelines for web-based sensors via the Sensor Web Enablement (SWE) initiative. However, one of the SWE limitations is that it cannot easily be modified and adapted to dynamic scenarios, specially problematic for mobile sensors, because a set of enhanced requirements must hold to control and access different sensor data flow rate and format (GEIPEL et al., 2015; CHEN et al., 2015b), keep the sensor updates available in near real-time (PARK; CHO; KIM, 2012; BAKILLAH et al., 2015), and enable the exchange of large volumes of data between applications and devices with limited capabilities (TAMAYO; GRANELL; HUERTA, 2012; ARNABOLDI et al., 2013). Dynamic scenarios are inherent to applications such as disaster management and surveillance. Focusing on disaster management, it is specially challenging and complex area due to several reasons, from which it is possible to highlight the following: (i) it needs flexible and adaptable “solution” techniques to integrate multiple information sources; (ii) it needs to handle requirements that change rapidly so that it can support decision-making in near real-time with accurate guidelines for fast and efficiently operations (TROPMANN-FRICK; ZIEBERMAYR, 2014). Dealing with all these issues is not a trivial task, since account must be taken of the following: (1) the different types of stationary sensors, which supply specific data from risky areas (e.g. the water level on the riverbed or volume of rain); (2) the different types of mobile sensors, which supply data from areas (e.g. hydrological) where appropriate stationary sensors have not been installed or areas with problematic or unstable sensors; (3) the management of all the heterogeneous data that might be provided in multiple formats (e.g. numerical, textual or images) at a different flow rates (e.g. periodically, sporadically or asynchronously); and (5) the management of sensor activities and updates in near real-time during hazard situations (JIRKA; BRÖRING; STASCH, 2009; CHEN et al., 2014). Since there is a lack of interoperability for automatically integrating an abundance of heterogeneous and near real-time sensors into the Sensor Web involved in dynamic scenarios such as disaster management, this work proposes an approach to support and overcome this need. The Sensor Observation Service (SOS) - an interoperable standard defined by the Open Geospatial Consortium (OGC) - is used to make data available for the Sensor Web in an interoperable fashion. Thus, the main contributions made by this work are the following: 1. Defining a general purpose architecture to dynamically integrate mobile sensor nodes 1
http://www.opengeospatial.org
3.2. Related Work
47
involved in dynamic scenarios into the Sensor Web in accordance with SWE standards; 2. Learning lessons from the application of the proposed approach in a realistic scenario of environmental monitoring systems for disaster management. This paper is structured as follows. Section 3.2 examines the related works. Section 3.3 outlines the problem definition. Section 3.4 describes the proposed approach. Section 3.5 provides details about the simulation scenarios. Section 3.6 depicts the acquired results, while Section 3.7 conducts a discussion about them. Finally, Section 3.8 concludes the paper and makes recommendations for future works.
3.2 3.2.1
Related Work The use of mobile sensors in WSN
Existing projects aim to integrate mobile sensors to WSN for a variety of purposes. AWARE project (ERMAN; HAVINGA, 2010) aims at integrating a sensor network of resource constrained ground nodes with mobile sensors, carried on the ground by Unmanned Ground Vehicle (UGVs) and in the air by Unmanned Aerial Vehicles (UAVs). This project handles different concerns from interoperability issues to cooperation protocols. The integration problem is handled by selecting certain nodes as gateways that are able to gather data from the stationary sensors. A middleware is responsible for the details involved in the sensor discovery and registration. Compared with our work, this study is not conducted in such general terms since the gateway-based approach is very specific to the types of sensors that are used. Moreover, they fail to carry out an easy integration with web-based applications, as we do by publishing data through the sensor web. In (OCHIAI et al., 2010), the concept of delay tolerant networks (DTN) is explored about how to support integration among stationary and mobile sensor nodes. The authors’ potentialbased routing mechanism gives a higher potential to data providers, an intermediary potential to the mobile sinks and a lower one to the central node. This potential-based mechanism is statically configured before the system runtime, while in our case, this assumption does not apply, since we employ a completely dynamic scenario in which no preconfigured parameter or setup is assumed. Moreover, their work does not provide data publication on the Web, while our proposal does. PLANET project consists of a platform to enable adaptive deployments and operations of large-scale and complex mobile and stationary sensors cooperation. The platform has been validated in scenarios in which communication and cooperation are difficult, as well as are very sensitive to the impact of pollution and with highly automated airfield2 . EC-SAFEMOBIL project also aims to facilitate the cooperation, coordination and traffic control management of 2
http://www.planet-ict.eu/
Chapter 3. Dynamic Sensor Management: Extending Sensor Web for Near Real-Time Mobile Sensor Integration in 48 Dynamic Scenarios
the UAVs deployment, by using methods and technologies of control and motion estimation3 . A proposal for using UAVs to overlap disjoint segments and isolated partitions of WSN is presented in (HEIMFARTH; ARAUJO, 2014). However, these proposals focus on the data collection without addressing the data delivery concerns towards publication on the Web.
3.2.2
Dynamically Integrating Sensors into the Sensor Web
Traditional WSNs are configured to gather data and transmit them to an uplink point, without any change in their behavior over time. In contrast, Sensor Web involves much more interaction between the sensors and their data since Sensor Web nodes act in line with the data that they and their neighbors have gathered. Most of the approaches aim to integrate sensors into the Sensor Web using their own mechanisms, which requires adaptation efforts since they do not consider interoperability and reuse properties. Such limitations can be addressed by adopting a generic approach based on existing standard interfaces such as SWE standards and/or Devices Profile for Web Services(DPWS) (LIANG; HUANG, 2013). Although several applications rely on standard protocols, the communication between sensors and the integration of sensors in highly dynamic scenario in near real-time still is not fully addressed. A message bus architecture containing a common communication infrastructure, a set of adaptable interfaces and a well-defined message protocol was built to ensure a semanticallyenabled sensor plug-and-play via an automatic mediation between sensors and SWE standards (MALEWSKI et al., 2014). However, this architecture, also known as Sensor Bus, does not take into account the following issues: (1) an automatically control and access of different sensor data flow rate and format (GEIPEL et al., 2015; CHEN et al., 2015b); (2) keep the sensor status available on the Web in near real-time (PARK; CHO; KIM, 2012; BAKILLAH et al., 2015); and (3) the use of lightweight standard protocols to exchange information between devices and sensor applications when both large volumes of data are exchanged, and devices have limited bandwidth and processing capabilities (TAMAYO; GRANELL; HUERTA, 2012; ARNABOLDI et al., 2013). Specifically for mobile sensors, existing approaches consider their management by improving SOS operations that act in a layer between the Sensor Web and Application layer (STASCH; BRÖRING; WALKOWSKI, 2008; MÜLLER; FABRITIUS; MOCK, 2011). Since mobile sensors can send different types of data streams, the approach in this paper was designed to handle this kind of data although they require a great deal of data throughput and compression. The goal in this project is not to synchronize or transform mobile sensor data streams (RIEKE; FOERSTER; BRÖRING, 2011), but to carry out mobile sensor integration into the Sensor Web in a fast and interoperable way considering scenarios where sensors: (1) create and retransmit 3
http://ec-safemobil-project.eu/
3.3. Problem Definition
49
heterogeneous data flow rate and format, and (2) are inserted and removed all the time inside a network.
3.3
Problem Definition
The major goal of this paper is to present a contribution on the dynamically integration of mobile sensors into the Sensor Web. This is performed by using the ability of these nodes to move throughout uncovered areas of a sensor field and to make their heterogeneous data available on the Web in near real-time. The sensor field in which these sensors are inserted and removed at any time can be seen in Figure 7.
Figure 7 – Example of four subsequent scenarios of the sensor field.
The sensor field is modeled as a time-series of graph G = {G0 ,...,Gn }. Gt = (St ,Ct ), where St = {s0 ,...,sn ,m0 ,...,mp } is a set of stationary sensors si and mobile sensors mj working in the sensor field at a time t, while Ct is a set of communication links between the stationary sensors si ∈ S and a mobile sensors mj ∈ S at a time t. Figure 7 depicts four scenarios (a), (b), (c) and (d) representing four subsequent instants T1, T2, T3 and T4 (G = {GT1 , GT2 , GT3 , GT4 }). In scenario (a), the mobile sensor m1 is connected to the stationary sensors s1 and s2 , while m2 is connected to s9 ; in scenario (b), a mobile sensor m3 starts working and is connected to s4 , m1 is connected to s3 , while m2 is connected to s8 ; in scenario (c), two stationary sensors (s6 and s7 ) stop working, while m2 is connected to s9 again; in scenario (d), s2 and m3 stop working. The communication links between the sensors will depend on the path planned for the mobile sensor. For each mobile sensor mj , its path consists of an array mj .a containing Points of Interests (POIs) ok in a visiting order (mj .a = [o1 ,...,oq ], where o ∈ R2 , q relates to the amount of POIs, o1 is the first point to be visited and oq is the last one). After a mobile sensor mj has
Chapter 3. Dynamic Sensor Management: Extending Sensor Web for Near Real-Time Mobile Sensor Integration in 50 Dynamic Scenarios
ensured the coverage its planning path mj .a, the graph Gt should contain all the communication links expected when the path was modeled considering operating range of the stationary sensors. The sensor field containing sensors with different trajectories and configurations over time, several types of hardware that hamper their effective management and unpredictable occurrence of events (POIs) represent a dynamic scenario. This dynamic scenario is represented as an ad hoc network monitoring the occurrence of events, in which the involved sensors act both as a data providers and as data forwarders.
3.4
Proposed Approach
An automated set of tasks is required to integrate mobile sensors into the Sensor Web. These tasks vary from access to control of the wide range of data and activity diversity that have to be handled. One of the reasons for that is due to the fact that before a sensor starts sending updates and observations, it needs to be registered on the Sensor Web in accordance with its specification. For this, it is necessary to get the capabilities of the Sensor Web service, and create a sensor description standard encoding depending on the sensor specification. This encoding has to be sent embedded with a sensor registration into the service. After this sensor registration, the sensor is able to insert both its observation and updates, by initially creating an observation standard encoding and updating its status inside the sensor description respectively. Then, again it is necessary to get the capabilities of the service to either insert the new observation or update the sensor description. Figure 8 aims to represent the required tasks to integrate mobile sensors acting both as a data providers and as data forwarders into the Sensor Web.
Figure 8 – Registering, Updating and Publicating Sensor Information into the Sensor Web.
However, it is difficult to accomplish the above mentioned tasks in dynamic scenarios since a large amount of heterogeneous data format and flow rate is exchanged by different sensor specifications, specially those that both have limitations and change their states very frequently. In this sense, this section aims at describing the proposed approach to integrate mobile sensors into the Sensor Web in dynamic scenarios, by presenting an enhanced message protocol (subsection 3.4.1) and a dynamic sensor management component (subsection 3.4.2). Figure 9 presents an overview of this whole process.
51
3.4. Proposed Approach
Figure 9 – A diagram of the approach overview.
3.4.1
Message Protocol
The message protocol extends an existing protocol (BROERING et al., 2010) by seeking to improve communication between sensors, keep the sensor status available in near real-time and enable sensors with limited capabilities to exchange a large number of data. The message protocol contains seven different messages that represent the following activities within the Sensor Web: 1) registering new sensors, 2) publish new observations, 3) start monitoring, 4) stop monitoring, 5) sleep monitoring, 6) wake up monitoring and 7) updating the current sensor position. Each message has a syntax, which is detailed in Table 4. Table 4 – Message Protocol. Message Register Sensor Publish Observation Start Monitoring Stop Monitoring Sleep Monitoring Wake up Monitoring Current Position
Syntax SensorRegister* PublishObservation** ** StartMonitoring*** StopMonitoring** SleepMonitoring** WakeUpMonitoring*** CurrentPosition***
The first message contained in the Table 4 is about registering new sensors on the Web. This message is responsible for carrying out important information to create the description of the sensor to be inserted into the Sensor Web. This description is a SensorML4 , a standard model that was designed to discover sensors and observations. Instead of providing a description of the hardware, SensorML provides a functional model of these sensors by handling each of its components as a process. Without SensorML, the observations from sensors that have not been 4
http://www.opengeospatial.org/standards/sensorml
Chapter 3. Dynamic Sensor Management: Extending Sensor Web for Near Real-Time Mobile Sensor Integration in 52 Dynamic Scenarios
registered are not published. Since this message includes only the sensor identifier, it enables a fast and efficiently sensor integration due to the lightness of the message. The service responsible for storing the sensor data into the Sensor Web is the Sensor Observation Service (SOS). SOS is an API to manage deployed sensors and recover sensor data related to their observations that contains a repository and a set of operations. Its main goal is to enable the access to the sensor observations in a standard way. For example, to insert a new sensor into the SOS, it is necessary to use a InsertSensor operation using SensorML. The second message of the protocol aims at publishing new observations from sensors already registered. An observation is an act of observing a property such as temperature, pressure, light, represented by numeric, text or binary values depending on the property. This observation is encoded as a Observations & Measurements (O&M5 ), which aims to provide a very general model that allows the packaging and linking of observations of different data format and structures from a wide variety of sensors types. It is important to emphasize that the dynamic sensor management component aid in the treatment of several type of observations. In case, mobile sensors provide images, the dynamic sensor management component can enable the conversion of the image into a binary chain and thus making them available on the Web. To make the observations from registered sensors available into the SOS, it is necessary to use a InsertObservation operation using O&M. All the other messages are about updating the sensor status. For example, sensors can have different mobilities (stationary or mobile), and in case they are mobile, they can have different positions (latitude, longitude) and states (active or not active) over time (timestamp). In order to make such sensor updates available on the Web in near real-time, every time a sensor changes, the update needs to be published. This is normally performed by updating the description of an existing sensor using a UpdateSensorDescription operation by means of a SensorML. This is the key to keep the sensor status (mobility, activity, timestamp and location) up-to-date.
3.4.2
Dynamic Sensor Management
In a real-world scenario, when either a stationary sensor is deployed or a mobile sensor flies for the first time, these sensors need to be registered in the Sensor Web. For this, they need to send a RegisterSensor message and retransmit to either another sensor nearby or directly to the dynamic sensor management component, which interprets and converts the data into the respective sensor activity. In addition, sensors may fail e.g., due to the lack of battery, then they need to be recharged (in cases in which the recharging is possible). In order to overcome this problem, the sensors need to send a command indicating that they are in a sleeping mode (SleepMonitoring 5
http://www.ogcnetwork.net/OM
3.5. Simulation Setup Scenarios
53
message). When the problem of sleeping is solved, the sensors are able to start monitoring again (WakeUpMonitoring message). In case, a sensor has just been registered or is beginning a new mission, it starts monitoring an area (StartMonitoring message). Conversely, as it stops monitoring, when it completes the mission, it sends a StopMonitoring message. Lastly, mobile sensors can fly over an area, thus keeping their track available on the Web can help stakeholders to quickly make decisions about new tracks, for example. These sensors use the CurrentPosition message to make that possible. For these reasons, controlling and accessing heterogeneous sensor data, keeping the sensor updates available in near real-time, and exchange large volumes of data are not only interesting features but also necessary, since critical applications require an abundance of on-thefly sensor data. These components and how they relate to each other are depicted in the dynamic sensor management represented in Figure 10.
Figure 10 – Dynamic Sensor Management Architecture of the approach.
3.5
Simulation Setup Scenarios
Due to the high cost and complexity of deploying real sensors, simulation was the chosen method to evaluate the proposal. The performed simulations are based on 2 scenarios that consider a real-world application of a wireless stationary sensor network to monitor a river water level (HORITA et al., 2015) and mobile sensors that are able to perform cooperative coordinated missions (DOERING et al., 2014). The stationary sensors have a small physical size and a lowcost long-range communication device, while the mobile sensors are small autonomous aircrafts (UAVs) containing a Mission and Vision Control Module composed of additional hardware as shown in Figure 11.
Chapter 3. Dynamic Sensor Management: Extending Sensor Web for Near Real-Time Mobile Sensor Integration in 54 Dynamic Scenarios
The performed simulations take into account important factors of supporting disaster management systems. They difficult the collection of updated information about the current state of rivers, as well as hamper the effectiveness of the risk management and resilience.
Figure 11 – A Mission and Vision Control Module composed of two Raspberry Pi boards with infrared and visible light cameras.
The UAVs used in the simulations are based on the APM platform6 , which uses an open source operating system and supports different types of aircraft (either with rotary or fixed wing). The platform supports communication with external devices through the Mavlink7 , which is a communication protocol used for communications among UAVs with a Vision and Mission Control module. APM platform also contains an open source flight simulator software that was used in this project to evaluate the path planning algorithm executed in the Mission Control Module. A typical flight mission corresponds to the inspection of critical POIs by one or more UAVs. Each aircraft can carry different types of sensor devices (e.g., either an IR or a visible light camera) which are better suited to a given type of POI. The shortest paths for the UAVs, which takes into account their specific inspection capabilities, are calculated by executing a Simulated Annealing (SA) algorithm in a single Mission and Vision Control Module. This procedure considers the path planning optimization as a complex problem for the Traveling Salesman Problem (TSP) based on (SONG; LEE; LEE, 2003). The algorithm considers a penalty factor, which is calculated for paths in which the corresponding UAV visits an unsuitable POI, i.e., a POI for which its sensor device is not the most suitable. This procedure takes the solutions of the SA algorithm to regions where the UAV specialty and POI type are likely to match. The first simulated scenario contained two mobile and five stationary sensor nodes, which provided data and changed their status and position over time (Figure 12). In the second scenario 6 7
http://ardupilot.com/ http://qgroundcontrol.org/mavlink/
55
3.5. Simulation Setup Scenarios
Figure 12 – Simulation Setup Scenario One.
the number of mobile and stationary sensor nodes were doubled (Figure 13). The white markers in the Figures represent simulated stationary sensors, while the colored markers represent each POI of UAVs path planning. The details of the simulations are depicted in Table 5. Table 5 – Parameters in simulation. Scenario 1 Parameters # mobile sensors # stationary sensors simulation area (km2 ) mobile sensor speed (km/h) # POIs
Values 2 5 0.1 6.5 17
Scenario 2 Parameters # mobile sensors # stationary sensors simulation area (km2 ) mobile sensor speed (km/h) # POIs
Values 4 10 1.98 6.5 36
Both scenarios contained different number of stationary and mobile sensors to facilitate the evaluation of both the latency and scalability of the proposal. During the simulations, mobile sensors of both scenarios published observations at every POI inspection, while stationary sensors publish at random time intervals (average mean of 120 seconds and standard deviation of 60 seconds). This helps to represent the dynamic scenario found in disaster situations. In this work, SOS framework8 was considered as an instance of Sensor Web standards. 8
http://52north.org/communities/sensorweb/sos/
Chapter 3. Dynamic Sensor Management: Extending Sensor Web for Near Real-Time Mobile Sensor Integration in 56 Dynamic Scenarios
Figure 13 – Simulation Setup Scenario Two
Its advantages are that it has an open source code (easily adapted) and it provides all of the required SOS operations, unlike other existing implementations.
3.6
Results
The conducted simulation involves:(1) the deployment of sensors in a dynamic scenario to simulate realistic conditions such as those involved in disaster management; (2) the performance (latency and scalability) analysis of the messages sent by the sensors to check near real-time data publication; and (3) the adoption of SOS standards to achieve genericity in the approach by handling sensor data in an interoperable way. One of the means to evaluate interoperability is through the syntactical interpretation and use of a message. Since the proposed message protocol is easily to be interpreted due to its simplicity and the low cost of a lexical analysis, when a message either misses a field or is incorrect, the dynamic sensor management component notices this as soon as it arrives. Then, the response to this request will point out that there is a mistake. However, if the message has a consistent structure it will be transmitted to the dynamic sensor management component. In addition, the fact of using an established set of standards such SOS services help to improve the interoperability analysis of the proposed approach. Considering the Sensor Layer, to exchange a
57
3.6. Results
large number of data using the message protocol, sensors need less complexity and size compared to SWE standards (Table 6). Table 6 – Size Comparison. message protocol register sensor publish observation stop monitoring start monitoring sleep monitoring wake up monitoring current position
size (bytes) 25 60 37 49 38 50 49
SWE standard insert sensor insert observation update sensor description
size (bytes) 3,431 1,498 2,955
To evaluate the performance, the elapsed time to receive, interpret and convert the sensor data contained within the message into a Sensor Web standard and publish them on the Web was calculated. In this evaluation, the SOS elapsed time ΔTSOS (SOS latency) was omitted since the interest was in evaluating only the time latency of the components implemented in this work to process the data, and not the one related to the existing SOS 2.0 implementations that are involved to perform the required operations. The SOS latency is defined as the elapsed time between the request sent to the SOS (SOS0 ) and the publication of the sensor data into the SOS repository (SOSf ). This time depends on the implementation of the SOS that is used, which is why it is not being considered in the performed evaluation. Therefore, the following mathematical formulation explains the performed evaluation: 3.1 represents the SOS time that is not being considered, while 3.2 represents the initial time when the dynamic sensor management component received the message (DSM0 ) and the final time when the dynamic sensor management published the sensor data into the Sensor Web (DSMf ).
△TSOS = SOS f − SOS0 ,
(3.1)
△TApproach = (DSM f − SOS f ) + (SOS0 − DSM0 ),
(3.2)
While the tests were being conducted, the simulated sensors were sending all kinds of messages as a realistic timeline of their operational behaviour in a dynamic scenario (as can be observed in Figures 14 and 15). Once the sensors are in time-of-flight or deployed for the first time, they send a RegisterSensor message. After that, they start sending StartMonitoring, SleepMonitoring, WakeUpMonitoring and StopMonitoring messages in an interchangeable way in accordance with a plausible sequence. The performed analysis also helped to observe no great impact of the different amount of sensors on the acquired results in both scenarios. However, as has been observed, since PublishObservation message requires further processing, it takes more time to be available, while the others are able to perform better near real-time data publication.
Chapter 3. Dynamic Sensor Management: Extending Sensor Web for Near Real-Time Mobile Sensor Integration in 58 Dynamic Scenarios
Figure 14 – Scenario One - Sent Messages
Figure 15 – Scenario Two - Sent Messages
3.7
Discussions
In the above described simulations, stationary and mobile sensors deployed in a given sensor field can send messages to each other so that their data can be published. Whenever a sensor message is received by the dynamic sensor management component, a standard is interpreted and used as a scalable container interface within the execution program. Although this standard template must be initially saved and operations of output/input are required, the proposed approach achieves a low latency since no entire format standard should be created every time during the execution program. Instead of having intensive work on the programming to control a unit software of a wide
3.8. Final Remarks
59
variety of sensor devices (GEIPEL et al., 2015; CHEN et al., 2015b), this project consider a generic mechanism to overcome this need. In addition, a small size and less complex message protocol helps to improve the performance of the sensor network when mobile sensors with processing capabilities limitations are deployed avoiding dependence on a stable network, with no Internet connection. This approach is not concerned with any enhancement of SOS operations in the interaction between the Sensor Web and Application layer (STASCH; BRÖRING; WALKOWSKI, 2008; MÜLLER; FABRITIUS; MOCK, 2011). Instead, it acts at a lower level of the Sensor Web layer and seeks to create mechanisms to improve the interoperability by an on-the-fly integration of the sensor data into the Sensor Web. The evaluated scenarios are more complex and dynamic than those that existing approaches can handle (BROERING et al., 2010). This is based on an assumption that all sensors can operate without any pre-existing infrastructure. Unlike (ERMAN; HAVINGA, 2010; OCHIAI et al., 2010), this approach automatically makes sensor data available on the Web and enables access to the current sensor updates in an interoperable way, publishing them on the Web. Moreover, this approach was designed to handle heterogeneous data without need for any complex preprocessing techniques. Although mobile sensor data streams are complex to manage (RIEKE; FOERSTER; BRÖRING, 2011), a fast and interoperable way in this project enables its management in scenarios in which sensors are inserted and removed all the time.
3.8
Final Remarks
The main contributions made by this work are the support for near real-time mobile sensor data integration into the Sensor Web, considering the use of interoperable and reusable mechanisms, as well as the ability of sensors to move in dynamic scenarios and act either as a data relay or data provider. Real-world application scenarios of environmental monitoring system for disaster management were considered for the proposal evaluation. Since the protocol is easy to interpret and convert, it helps to provide a standardized way of interoperability, and consequently a low latency to publish data on the Web, which is crucial for applications demanding near real-time data publication such as disaster management. The dynamic sensor management component generally takes less than one second to publish sensor data, which means the proposed approach can manage the heterogeneous sensor data flow rate and format, as well as can keep and publish sensor updates in dynamic scenarios with a very short delay. The scalability of the proposal could also be evaluated, which was done by varying the number of sensors in the evaluated scenarios. Future works aim to integrate mobile devices such as smart phones acting as sensors, exploring people roaming. Social network messages can be prioritized during disasters using the sensor data gathered in such scenarios (ASSIS et
Chapter 3. Dynamic Sensor Management: Extending Sensor Web for Near Real-Time Mobile Sensor Integration in 60 Dynamic Scenarios
al., 2015b). This could increase the diversity of the data sources besides exploring unexpected patterns according to people spontaneous movements. Moreover, other algorithms can be used by the mobile sensors to overlap the stationary sensors within a network.
61
CHAPTER
4 AUTOMATED GEOGRAPHICAL PRIORITIZATION OF SOCIAL NETWORK MESSAGES USING SENSOR DATA STREAMS: AN APPLICATION TO FLOODS
4.1
Introduction
The growing number of natural disasters such as floods has been leading for better preparation from vulnerable communities. In this sense, in-situ and mobile sensors are providing historical and updated information through the monitoring of environmental variables (e.g. temperature of the water or the volume of rainfall). Although these data are useful for supporting decision-making, further information is required for estimating the overall situation at an affected area (HORITA et al., 2015). Social networks like Twitter, Facebook, and Instagram, can overcome this issue either by providing information from areas which are not covered by sensors or complementing semantically the data provided by them (STARBIRD; STAMBERGER, 2010; VIEWEG et al., 2010; ZIELINSKI et al., 2013; HORITA et al., 2015). Despite the fact that the combination of sensor data streams and social network messages might provide better information for supporting decision-making in critical situations like floods (MOONEY; CORCORAN, 2011), it raises some challenges. On the one hand, the huge volume of messages shared through social network makes difficult the identification of relevant messages, i.e. decision-makers do not want to analyse thousands of messages, they need the most valuable in order to make faster their decision-making (VIEWEG; CASTILLO; IMRAN, 2014). On the other hand, the near real-time integration of sensor data and social network messages raises issues regarding the combination of distinct data streams (e.g. per second or per minute) and different data formats (e.g. numbers and texts) (DOLIF et al., 2013).
62
Chapter 4. Automated geographical prioritization of social network messages using sensor data streams: an application to floods
In this context, this paper aims to present an approach for supporting flood risk management by means of the near real-time combination of social network messages and sensor data streams. It extends our previous works (ASSIS et al., 2015a; ALBUQUERQUE et al., 2015) by adopting a workflow analysis which structures and defines an automated near real-time prioritization of social network messages based on the sensor data stream. Furthermore, it describes the formal representation of the problem statement, and makes an evaluation of the approach through case studies. In summary, the main contributions of this work are described below: 1. To define an approach to combine a sensor data stream with social network messages, aiming at identifying high value messages in near real-time for flood risk management; 2. To learn lessons from the application of the proposed approach in a real-world flood scenario in our application case study. The remainder of this paper is structured as follows. Section 4.2 examines the related works. Section 4.3 sketches the background of the basic concepts and introduces the approach and methodology employed in this work. Section 4.4 describes the evaluation of the approach and their results are analyzed in Section 4.5. Finally, 4.6 draws conclusions and recommends some future works.
4.2
Related Works
Several applications have attempted to combine authoritative and non-authoritative data to improve the limitations of each other. Existing approaches integrate authoritative and non-authoritative data to provide location-based eventful visualization, statistical analysis and graphing capabilities in near real-time (WAN et al., 2014; SCHNEBELE et al., 2014). The combination of information provided by a collaborative platform (esp. Ushahidi) and sensor data collected via a wireless sensor network have been built for decision-making in flood risk management (HORITA et al., 2015). Several other studies aim at analyzing the large amount of information provided by social networks (EDIGER et al., 2010; GAO; BARBIER; GOOLSBY, 2011), exploring e.g., relations between spatial information from both social network messages and knowledge about flood phenomena (ALBUQUERQUE et al., 2015). An algorithm for monitoring social network messages (esp. tweets) and detecting upcoming events is another eminent approach (SAKAKI; OKAZAKI; MATSUO, 2010). This algorithm classifies tweets using their keywords, number of words, and context. There are also systems for processing and analyzing social network messages in near real-time (SONG; KIM, 2013). The results of its application to monitor Korean presidential elections showed that social network can support the detection and prediction in the changing of communities’ behaviour. Finally, examining earliest social network messages that
63
4.3. Problem Statement and Approach
have produced a trend with the aim at identifying and creating a classification schema allows a categorization of messages, and thus a discovery of potential trends in near real-time (ZUBIAGA et al., 2015). Although some studies have been done in the field, none of them tackles the combined use of social network messages and data collected from sensor streams in near real-time. In this manner, the processing of different data flows and data formats still pose challenges for the the use of sensor data as an alternative to support the filtering and extraction of high value social network messages in near real-time.
4.3 4.3.1
Problem Statement and Approach Prioritization of Location-based Social Network Messages
Problem Statement. Due to the high volume of social network messages, the process of extracting relevant messages has been becoming more complex. This is because most of these messages are shared from several platforms (e.g. Flickr and Twitter) in distinct formats (e.g. photos and texts) with different data flows (e.g. per hour or per second). Research Question. Is a sensor data stream able to support the near real-time identification of relevant social network messages in flood risk management? Hypothesis. Given a set of catchments C, sensor data stream S and location-based social network messages M, we assume that the n-messages M = {m1 ,...,mn } nearest to the m-flooded areas Ftr = {f1 ,...,fm } available at a time tr tend to be more flood-related than the more distant (p-n)-messages M = {mn+1 ,...,mp }, where n, m, p and r ∈ N, and t is a timestamp. F is defined here as a time series of flooded areas. F = {Ft1 , ..., Ftr }. Definition 1. This paper uses a set of georeferenced catchments C = {c1 ,...,cn } ⊆ R2 . Each cj denotes a two-dimensional Euclidean space that can either contain sensors or not. A sensor data stream S = {s1 ,...,sm } contains a set of continuous sensor data sk = [i, v, t, p, c]. Each sensor data has an id sk .i, a water level value sk .v at a timestamp sk .t, a geographic position sk .p = (x; y) and a s.c catchment. In case a sensor data sk contains sk .v equal to “high” at a timestamp sk .t, and a sk .p within a catchment cj , this catchment cj become a flooded area fp ∈ Fsk .t ⊆ C. The fp is available until that sk .v and any other sensor value contained in the catchment cj are not “high” anymore at a subsequent timestamp to sk .t.
F = {F t1 , ..., F tr }
F tr = { f 0 , ..., f p } | ∃ sk ∈ S and f p ∈ F tr , where sk .v = “high′′ and sk .c = f p and sk .t = t r .
(4.1)
(4.2)
64
Chapter 4. Automated geographical prioritization of social network messages using sensor data streams: an application to floods
Location-based social network users U = {u1 ,...,un } produce georeferenced messages represented by M = {m1 ,...,mn }. Each message mi = [u, t, v, g] contains a value text mi .v, as well as is produced by an user mi .u at a timestamp mi .t in a geographic location mi .g. If there is a flooded area fp , for each new incoming message mi , a distance d is computed by the nearest neighbour (Euclidean) distance of the mi .g position to every element of the set Ftr ) = { f p }np=0 at a timestamp tr . Definition 2. In general, the cartesian minimum distance between two points p (message location) and p’ (the nearest point contained in a flooded area) in a Euclidean space Rn is given by:
′
d(p, p ) =
4.3.2
s
n
∑
|pi − p′ j |2 , where i, j ∈ N.
(4.3)
i, j=1
Sensor Data Stream and Social Network Message Workflows
Given the extent of the flood phenomena, spatiotemporal characteristics of both sensor data stream and social network can be combined and more explored. Social networks messages can be used to complement sensor data stream with semantic information, while sensor data stream can add reliability to the social network messages. For this reason, this approach is designed to suit an on-the-fly prioritization for different levels of data availability that are require to ensure an effective flood risk management. The proposed workflow is performed in a pipeline way that contains both a sensor data stream S and a social network messages stream M. In the sensor data stream part (see Figure 16), there are three possible kinds of data availability. The first alternative is to have highly qualitative information about the extent of the flood phenomena, which can be provided by Unmanned Aerial Vehicles (UAVs). Although they provide the best degree of accuracy for detecting events in near real-time, they are rarely gathered.
Figure 16 – Sensor Data Stream Workflow.
If no direct sensor data is able to show the existence of a flooded area fp , thus it is
4.4. Case Studies and Experimental Setup
65
analyzed if they can either provide a flood hazard area or not. Local data about the affected areas e.g., maps of risks can potentially provide this kind of information. In the last stage of the verification, if neither the flooded area fp nor the flood hazard area are initially available, a digital elevation model (provided by an user) is used to calculate a flood hazard area. After calculating this flood hazard area, they are used as an input (along with threshold data) to calculate the flooded area fp . The flooded area fp in this part, is used to calculate the prioritization-based distance P(mj ) when a new social network message mj arrives (see Equation 4.4). In case more than one flooded area is available, the nearest flooded area distance is assign to the message prioritization.
p(mj ) = min(d(mj , f p )), where mj ∈ M, f p ∈ F and j, p ∈ N.
(4.4)
Social network messages mj and sensor data sk should gathered simultaneously so that even delayed flood-related messages can be acquired. In the social network message stream part (see Figure 17), for each new incoming social network message mj , prioritization-based distance is computed according to the nearest existing flooded area available produced by the sensor data stream part of the workflow. After calculating this prioritization-based distance, the messages are filtered to find messages that are likely to refer to a flood event. At first, our aim is to store all the messages since the specific keywords for floods might change during a flood. In this way, the filtering process can be easily adjusted without losing any flood-related messages.
Figure 17 – Social Network Message Workflow.
4.4
Case Studies and Experimental Setup
The approach was evaluated by means of an application case study of floods in Brazil, since it is currently taking measures to cope with and alleviate flood situations. This set of measurements includes activities that involves pre-flood planning, managing emergency situations and post-flood recovery (AHMAD; SIMONOVIC, 2006). Updated knowledge of river conditions plays an important role at supporting decisionmaking, since several technical factors can prevent this kind of information from being obtained. Countries such as Brazil where there are flash floods caused by heavy rain or the overflow
66
Chapter 4. Automated geographical prioritization of social network messages using sensor data streams: an application to floods
of streams and narrow gullies needs this kind of management to mitigate the damage to the local infrastructure. This means that emergency agencies have to cope with the risk of human casualties and the extent of flood damage in their decision-making. In this application case study, we considered as data source, authoritative static data (shapefiles), authoritative dynamic data (sensor data streams), and social network messages (Twitter).
4.4.1
Case Study: Flash Floods in Brazil
The analysis is confined to São Paulo as a single region within Brazil so that it is easier to compare and link the results of the case study. The shapefile of the State of São Paulo was produced using geotools1 operations and geo-referenced data sets provided by HydroSHEDS2 . It contains 315 small catchments. The sensor data streams was obtained from the national center for monitoring disasters and issuing warnings in Brazil (Cemaden). This agency operates by continuously installing new stations and providing their data through a Rest API. In the State of São Paulo, Cemaden provided data from 465 stations. Each station and measurement of Cemaden are combined at the same file. The provided measurements from all the stations regarded the last four hours, considering an offset. This is the difference between the distance of the installation position and the real water level. As soon as it starts raining, the stations measure the rainfall every 10 minutes, otherwise they measure every 60 minutes. The floods in Brazil are represented at their most extreme by flash floods. The catchments, stations and flooded areas are depicted in Figure 18, while a density map of the prioritized tweets is shown in Figure 19.
4.4.2
Experimental Setup
Runtime Environment: The implementation to retrieve Cemaden data was based on a simple Java toolkit for JSON3 , while tweets were retrieved using a Java library for Twitter API called Twitter4j 4 . Both of them were implemented in a pipelined fashion as a data stream. The experiments were run on a server with 2GHz AMD Opteron(tm) Processor 4171 HE and 3.4 GB RAM memory running Ubuntu 12.04.5 LTS (64 bit). Dataset: Twitter Streaming API and Cemaden Rest API were used to retrieve data in the period from April to May 2015. 1 2 3 4
http://www.geotools.org http://hydrosheds.cr.usgs.gov/index.php https://code.google.com/p/json-simple/ http://twitter4j.org/en/index.html
4.5. Results and Analysis
67
Figure 18 – São Paulo - An analysis of Brazilian Stations and Catchments.
Figure 19 – São Paulo - An analysis of Prioritized Tweets during periods of floods.
4.5
Results and Analysis
In our case study, only 6% (68,195) of the tweets were prioritized mainly due to the flash floods. Such application case study helped to represent the scenarios when flood occur, since a large number of tweets were posted at critical moments. At first, all the flood-related tweets (403) were filtered by making a selection of the prioritized tweets (1,136,583) based on specific keywords and their synonyms. This “keyword selection” was based on the Brazilian words in the
68
Chapter 4. Automated geographical prioritization of social network messages using sensor data streams: an application to floods
dictionary for “flood”, taking into account differences of case sensitive letters without spelling mistakes. The Brazilian keywords were “enchente”, “inundação” and “alagamento”. Table 7 – Keyword-based filtering description of the location-based social network messages # all the tweets 1,136,583 (100%)
# prioritized tweets 68,195 (6%)
# prioritized flood-related tweets 403 (0,04%)
# prioritized non flood-related tweets 67,792 (5.96%)
All the stations provided 284,663 measurements, which included 311 distinct stations that measured 1,030 high values. These values set for up to 59 distinct catchments areas that are considered to be flooded. A detailed description of the data provided by stations and their measurements is depicted in Table 8. Table 8 – Sensor measurement description of Cemaden stations. # catchments (flooded areas) 59 (18.7%)
# stations (high values) 311 (66.9%)
# measurements 284,663 (100%)
# all the measurements (high values) 1,030 (0.0037%)
We also decided to calculate the time that our approach takes to prioritize all the tweets. The latency of the tweets was considered to be acceptable for the prioritization of social network messages for floods. This latency was the difference in time between the arrival from the Streaming API and the storage at the database. The latency was only calculated for the prioritized tweets. The processing average time per minute of all the prioritized tweets was less than one second. Tweets containing relevant information presented not only flood-related text, but also georreferenced images that can help in flood risk management. As can be seen, exemplary prioritized tweets containing relevant messages are shown in Table 9 and Figure 20. Table 9 – Examples of prioritized Tweets containing flood-related keywords without images (On Topic, Relevant). Flood-Related Prioritized Tweets “tá td alagado aq na marquês” “Ta alagado aqui” “Nações alagada” “Alagamento na av dos Tajuras (at @AG2 Nurun in São Paulo, SP)” https://t.co/r7ECeAtiFB” “@VCnoSPTV chuva de 30 minutos e alagamento na região do Brás, pra variar http://t.co/wWVqIKtz3z" “5min de chuva e rua já fica alagada"
Translation “everything is flooded here in the Marquês” (name of a place or avenue name) “It is flooded here” (the georeference of the tweet can supplement this information) The “Nações (Avenue Name) is flooded” “There is a flood in Tajuras avenue” (the georeference of the tweet can suplement this information) “@VCnoSPTV (Twitter account of a TV program) it has been raining for 30 minutes and the region of Bras is flooded, as always http://t.co/wWVqIKtz3z” “After 5 minutes of rain, the street is already flooded” (the georeference of the tweet can supplement this information)
In addition, a statistical hypothesis test was conducted to check whether flood-related tweets are closer to hazard areas than those that are non- flood-related during floods. The MannWhitney U-test was employed for the samples of prioritized flood-related and non-flood related tweets. The test returns the p-value of a two-sided Wilcoxon rank sum test, which tests the null hypothesis that the distance of independent samples with different lengths from continuous
4.5. Results and Analysis
69
Figure 20 – Examples of flood-related tweets containing images that can help in flood risk management.
distributions of flood-related and non-flood related tweets are with equal medians, against the alternative that they are not. The p-value of 7.2940e-016 indicates a rejection of the null hypothesis of equal medians at a 5% significance level. That means, the sample of tweets which contain flood-related keywords are not equally nearer to the hazard areas to the ones that not contain flood-related keywords. The median distance of the sample of non- flood-related tweets was 10,905 meters away from those areas, while the sample of flood-related tweets was 3,027 meters away. Figure 21 shows the two distribution of non flood-related and flood-related tweets based on their prioritization (distance in km to flooded areas).
Figure 21 – Median, Average and Outliers of flood-related and non flood-related tweets.
70
Chapter 4. Automated geographical prioritization of social network messages using sensor data streams: an application to floods
4.6
Final Remarks
This paper presents an approach for supporting flood risk management by means of a near real-time prioritization of social network messages based on sensor data streams. One case study was used for evaluating the approach. The results confirmed that the geographical relations are useful for prioritizing social network messages related to floods. They showed that there are about 3,6 times more flood-related social network messages near to flood-affected areas than non-flood-related messages. Although our approach was evaluated in a specific context of floods and using Twitter messages, it can be used to other types of disasters (e.g. droughts and landslide) and social network (e.g. Instagram and Flickr), i.e. considering images or videos instead of only texts messages. Our approach gathered the messages per minute during a flood at an average processing time of less than one second. Given the large number of messages (time peaks should be treated as critical periods since more messages tend to be posted), such processing time to prioritize does not significantly change. This work has shown that social networks messages and sensor data streams can complement each other. Sensor data streams are accurate, dynamic, heterogeneous and continuous, although they are scarce and hard to implement and maintain. On the other hand, social network messages can enhance semantic sensor data, but their large number is not easy to handle since they can be misleading, outdated or inaccurate. Despite the lack of user experience and knowledge, social networks have been used in crisis management revealing their remarkable and positive features. Although most of the existing approaches are still insufficient for near real-time decisionmaking since they fail to take note of the fact that data in disasters should be analyzed on-the-fly and automatically. Our approach searches for georeferenced social network messages using a grid 5x5 bounding box based on the catchments dimension. Although most of the messages are not flood-related (and do not contain any important keywords such as “floods” or “inundation”), they were stored at the database after first being filtered because a keyword search is arbitrary, especially for near real-time event detection. All the social network messages located within a flooded area were prioritized with zero meters “0 m” as distance, which is the main value-based prioritization. Some of the prioritized messages have images embedded in them, which were really useful when they were geolocated because they could show the exact situation of a particular place and sometimes helped more than simply by the words. During our analysis, a few of the total amount of available messages were both georeferenced and considered to be flood-related. Furthermore, heavy rains might affect the connection infrastructure (e.g. cellphone services or wi-fi), which in turn may reflect on the unavailability of information sharing. Although this issue is important when dealing with social network messages, it is beyond the scope of this work. In this sense, a better time resolution and spatial distribution of the sensor measurements
4.6. Final Remarks
71
would improve the availability of information provided by sensors. In situations that sensors are measuring high values all the time, machine learning techniques would be an useful way to check whether the sensors are really in a flood situation or only measuring high values all the time because of its position on the river. Future work lines should take account of using the prioritization of social network messages as one step to further filtering and classifying the quality of crowdsourcing. Besides that, it can serve as basis to improve machine learning models that consider geographical links.
73
CHAPTER
5 TOWARDS A MIDDLEWARE TO DYNAMICALLY MANAGE HETEROGENEOUS GEOSENSORS IN NEAR REAL-TIME FOR DISASTER MANAGEMENT
5.1
Introduction
According to Munich Re (NatCatSERVICE), about 7,700 people lost their lives in 980 disasters worldwide last year, which was much higher than the average yearly rate for the last 30 years. 92% of them were due to weather events, and resulted in more than US$ 140 billion worth of losses and damage. With the aim of mitigating the damage caused by such events, National Agencies, have provided sensor data to enhance community resilience and allow decision-makers to make rapid and up-to-date decisions. However, unevenly distributed discrete sensors are still insufficient to mitigate the impact of the disasters because they only provide historical datasets with segmented measurements, which are not enough to carry out a disaster prediction and a risk assessment. In addition to the stationary sensors, mobile sensors such as Unmanned Aircraft Systems (UAS) can also be used since they are able to monitor disasters (VALAVANIS, 2008). Collectively, these heterogeneous geosensors have a great potential, although one of the main challenges is how to manage them dynamically so that they can offer better decision-making for disaster management. Furthermore, the problems of combining all the data sources mentioned above, include the following: (i) the wide variety of sensor protocols and interfaces; (ii) the fact that most applications still only perform this integration by relying on their own mechanisms; and (iii) the set of services required for storing, processing and providing the combined sensor data. In an attempt to isolate the applications from the idiosyncrasies contained in the imple-
Chapter 5. Towards a middleware to dynamically manage heterogeneous geosensors in near real-time for disaster 74 management
mentation of these heterogeneous geosensors, an initiative called Sensor Web Enablement (SWE) was developed to enable the interoperable use of heterogeneous geosensor resources. Although this ensures that sensors perform a number of tasks such as making observations and providing access (BOTTS et al., 2008), SWE is unable to fully manage situations where sensors can be embedded or removed dynamically, which is a really common problem during disasters. An alternative to this problem is to develop an approach based on a service-oriented middleware for dynamic and near real-time management of heterogeneous geosensors by leveraging re-use and open components, supporting both near real-time sensor data publication and discovery on the Web in compliance with SWE standards in a dynamic scenario. A dynamic scenario consists of a sensor field containing e.g., sensors failing owing to a lack of battery power, or mobile sensors with an ability to provide distinct geographic information continuously. These situations are inherent to applications such as disaster management. This paper is structured as follows: section 5.2 sketches a literature review of the main concepts used in this project; Section 5.3 sets out the proposed approach; Section 5.4 conducts an analysis and evaluation of the scenarios tested for this study; Section 5.5 includes a discussion about the findings and summarizes the conclusions.
5.2
Related Works
Middleware is known as an interface responsible for hiding from the application layer both the complexity and heterogeneity involved in the low-level hardware components. Furthermore, a middleware needs to manage the scalability, mobility, heterogeneity, usability and transparency of the hardware components (HADIM; MOHAMED, 2006a). Likewise, a middleware should handle the sensor network changes regardless of place and time, as well as encapsulate the complexity of its resources. Apart from not having any reusable and open components, there are middleware that still lack interoperable services such as SWE standards in order to be as generic and abstract as other approaches (HUGHES et al., 2011). These middleware require further adaptations to integrate sensors and applications since they carry out their needs by using only their own mechanisms. A middleware that relies on service interfaces such as SWE standards is also not sufficient to take account of the highly dynamic scenario involved when integrating and publishing sensor data into the Sensor Web (BEDER et al., 2013a). As already mentioned, dynamic scenarios are inherent to applications such as disaster management. In this context, it is necessary to build flexible and adaptable “solution” techniques to integrate different data sources and handle requirements that change rapidly. Following this concept, a mechanism based on a message bus architecture containing a common infrastructure, a set of adaptable interfaces and well-defined protocol message was developed to ensure an on-the-fly semantically-enabled sensor integration with the Sensor Web (MALEWSKI et al.,
5.3. AGORA - DYNAMIC SENSOR MANAGEMENT APPROACH
75
2014; BRöRING; FOERSTER; JIRKA, 2010). However, this mechanism still need enhancements of sensor registration, observation publishing and Sensor Web data discovery in a spatial, temporal and thematic user context since these are important factors of the dynamic management of geosensors involved in disaster management (LIANG; HUANG, 2013; JIRKA; NÜST; PROSS, 2013; BARTHE-DELANOË et al., 2013). In summary, some research has been done on the use of middleware for managing heterogeneous geosensors. However, none of them aim to make the sensor data available in an interoperable manner considering dynamic scenarios with distinct sensor data formats and different data streams.
5.3
AGORA - DYNAMIC SENSOR MANAGEMENT APPROACH
The proposed approach to manage dynamically heterogeneous geosensors in near realtime for disaster management is presented in this section. This middleware can be seen as an extension of (BRöRING; FOERSTER; JIRKA, 2010) because (1) it seeks to improve communication between sensors involved in dynamic scenarios; (2) to use lightweight standard protocols to exchange information between sensors and disaster web applications, when both large volumes of data are exchanged, and sensors have limited bandwidth and processing capabilities (TAMAYO; GRANELL; HUERTA, 2012; ARNABOLDI et al., 2013); (3) to provide an automatically control and access of different sensor data flow rate and format (GEIPEL et al., 2015; CHEN et al., 2015a); (4) to keep the sensor status available on the Web in near real-time (PARK; CHO; KIM, 2012; BAKILLAH et al., 2015); (5) and to reuse implemented components by avoiding greater efforts to integrate geosensors into disaster applications. The approach is called AGORA - Dynamic Sensor Management (AGORA-DSM) and consists of source adapters, a protocol message, a dynamic sensor management component and SWE standards. It is located in the Middleware Layer, between Sensor and Application Layers. Figure 22 displays the conceptual architecture of the AGORA-DSM. The adapters from the AGORA-DSM are responsible for interpreting the data source formats and converting them into messages that the middleware can understand. These messages are part of a protocol that helps to translate necessary sensor activities involved in disaster management into the Sensor Web operations. The sensor activities are inside the dynamic sensor management component, which interfaces to the Sensor Observation Service (SOS). Therefore, whenever a disaster web application desire to access up-to-date available sensor data, it need to interact to SOS. The next sections give further information about the Middleware Layer as well as its
Chapter 5. Towards a middleware to dynamically manage heterogeneous geosensors in near real-time for disaster 76 management
Figure 22 – Conceptual Architecture of AGORA-DSM.
operations for the dynamic sensor management.
5.3.1
Sensor Layer
The Sensor Layer consists of the data sources, which might comprise of traditional sensor networks (e.g. stationary and mobile sensors) providing different types of data format and flow rate to the Middleware Layer. The data format and flow rate depend on the sensor specification and purpose. For example, stationary sensors normally measure temperature, pressure and rain gauge, while mobile sensors such as UAS might flight over hazard areas by taking photo for environmental monitoring. The trajectory of mobile sensors over time and the frequency sensor makes observations are exemplary specifications that can vary according to the sensor implementation. The Middleware Layer also should take into account that sensors communicate with each other in these kind of scenarios by either using an access point or without any infrastructure.
5.3.2
Middleware Layer
AGORA-DSM is part of the Middleware Layer and interfaces to Sensor and Application Layer. AGORA-DSM contains adapters responsible for interpreting the different sensor data formats and flow rate provided by the sensors. Every time a new sensor is connected to or removed from the network, its update information needs to be published on the Web. The adapters helps to improve the generalization and re-utilization of such publication implementation. Each adapter makes the sensor data available on the Web in an automatically manner by means of a conversion of a lightweight message into a necessary sensor activity for disaster
5.3. AGORA - DYNAMIC SENSOR MANAGEMENT APPROACH
77
management. The sensor activities are inside the dynamic sensor management component, and they help to encapsulate the complexity of the SWE standards involved to integrate new information. The following three activities are considered here: (i) registering new sensors, (ii) publishing observations, and (iii) updating existing sensors. Each one is described in detail in the next subsections. The dynamic sensor management component is responsible for storing the sensor data into the Sensor Observation Service (SOS). SOS is an API to enable the access to the sensor observations in a standard way by means of a repository and a set of operations. 5.3.2.1 Sensor Registration When a sensor wants to communicate with the middleware for the first time, it must initially be registered on the Web. This is because it is not allowed to insert observations from sensors that have not been registered on the Sensor Web. The adapter thus converts the sensor data to the registerSensor message, which in turn, is interpreted and converted into a Sensor Web standard by the Sensor Registration activity component. In Listing 1, an example of a registerSensor message produced by the adapter is depicted. Source code 1: registerSensor message 1 { 2
"message": "registerSensor", "sensor_id": "urn:ogc:object:feature:Sensor:sensor-6", "sensor_name": "Porto Ferreira" "property": "urn:ogc:def:phenomenon:OGC:1.0.30:waterlevel", "sensor_place_name": "Mogi river", "coordinates": [-22.0, -47.5], "agency":CEMADEN,
3 4 5 6 7 8 9 }
The Sensor Registration aims to insert new sensors into the SOS repository. This is performed by means of the Sensor Model Language (SensorML), a standard model for both describing sensor metadata and providing sensor model, rather than the hardware description. When an observation is sent without having its sensor registered, the middleware checks if the sensor is within the SOS repository by using the sensor identifier contained in the observation, as a parameter of the DescribeSensor operation. In case the sensor is not inside the SOS repository, the middleware uses the InsertSensor operation and follows the parameters of the sent observation to register new sensors. After that, the observation is published. The mandatory parameters to register sensors in the Sensor Web are: an identifier, a name, an observation offering (which is a logical way to group observations offered by a service), a parent sensor system, a feature of interest to represent the identifiable object, an initial location (latitude, longitude), a description of the property that is observed (e.g. temperature, water level),
Chapter 5. Towards a middleware to dynamically manage heterogeneous geosensors in near real-time for disaster 78 management
a type of observation (e.g. O&M, Text, Geometry, Boolean), and a type of feature of interest (e.g. a point or curve). 5.3.2.2 Publish Observation After the adapter has registered the respective sensors, if the sensors submit any observation, the adapter converts this information to the publishObservation message, which is shown in Listing 2. Source code 2: publishObservation message 1 { 2
"message": "publishObservation", "sensor_id": urn:ogc:object:feature:Sensor:sensor-7, "timestamp": 2015-10-31 23:25:31, "property: urn:ogc:def:phenomenon:OGC:1.0.30:windspeed, "sensor_place_name": "Mogi river", "type": "numeric", "unit": "m/s", "value": 7.00,
3 4 5 6 7 8 9 10 }
The Publish Observation activity is responsible for interpreting and converting the message by adhering to the Sensor Web standards necessary so that a new observation can be included in the SOS repository. The InsertObservation operation is used to include an observation. In this case, an observation is an act of observing a property (e.g., temperature, pressure or light) represented by values (e.g., numerical, textual or binary) following Observation & Measurements (O&M) specifications, which aims to provide a very general model that allows the packaging and linking of observations of different data format and structures from a wide variety of sensors types. The mandatory parameters for publishing observations in the Sensor Web are as follows: an observation identifier; a sensor identifier; an observation offering; an observed property; a phenomenon and result time; a unit of measure and value result; and a feature of interest identifier, name, geometry and type. Before including new observations, a GetObservation operation is requested, by using the observation identifier as a parameter to check whether the observation is already in the repository or not. This is recommended because observations cannot be included in the SOS repository twice. 5.3.2.3 Sensor Updating Owing to mechanical problems, high mobility, and uncovered areas, sensors have to change their status (such as their activity, position and mobility) over a period of time. For example, mobile sensors change their positions when they start monitoring and move about actively above a hazardous area during a disaster. On the other hand, they may be de-activated
5.4. Deployment and Analysis
79
when they stop monitoring due to low battery power. These situations illustrate the need to update the sensor status in the Sensor Web after the sensors have already been registered. In these cases, sensors send their updated status so that the adapter can convert it to the protocol message. After that, the Sensor Updating activity is responsible for converting the message into the UpdateSensorDescription standard of the SOS. As well as carrying out the Sensor Registration, the Sensor Updating makes changes in the sensor status within the Sensor Web based on theSensorML. For this, the updateSensor message is presented in Listing 3. This message contains the updated information of the sensors. For example, mobile sensors will have different positions (latitude, longitude) and states (active or passive) over a time (timestamp). Thus, the sensors must publish this information in the Sensor Web so that it can be updated whenever it changes. Source code 3: updateSensor message 1 { 2
"message": "updateSensor", "sensor_id": "urn:ogc:object:feature:Sensor:sensor-8", "sensor_name": "Porto Ferreira" "property": "urn:ogc:def:phenomenon:OGC:1.0.30:temperature", "sensor_place_name": "Mogi river", "coordinates": [-22.0, -47.5], "agency":CEMADEN,
3 4 5 6 7 8 9 }
Listing 3. updateSensor message.
5.3.3
Application Layer
The Application Layer consists of the disaster web applications interested on analysis, process or visualize sensor data gathered by the AGORA-DSM. Such sensor data help stakeholders to act in a fast and effectively way when they are inside hazard areas at a particular period of time.
5.4
Deployment and Analysis
The deployment analysis of AGORA-DSM aims at analyzing the performance of acquired sensor data and the adoption of SOS standards to achieve interoperability among heterogeneous geosensors.
5.4.1
Deployment of AGORA-DSM in the Flood Risk Management
Floods frequently occur around the world, so an ability to manage flood risks can help to reduce their effects. Flood risk management includes a set of activities that involves pre-flood
Chapter 5. Towards a middleware to dynamically manage heterogeneous geosensors in near real-time for disaster 80 management
planning, managing emergency situations and post-flood recovery. The purpose of these activities is to mitigate social, economic, and environmental impact (AHMAD; SIMONOVIC, 2006). Pre-flood planning is designed to reduce the extent of the damage caused by a flood, e.g. by drawing up evacuation plans. Emergency management ensures that planned tasks are executed during floods. Post-flood recovery enables communities to return and adapt to their circumstances as they were before floods (SIMONOVIC, 1999). Different types of sensors (e.g. hydrological stations and rainfall gauges) have been deployed as a way of gathering and monitoring environmental variables (e.g. water level, river pollution, or volume of rainfall), and thus providing updated information for supporting flood risk management. However, these heterogeneous geosensors raise problems regarding the management of their idiosyncrasies, mainly because they provide data using different formats (e.g. a photo or a numeric value) in distinct data streams (e.g. per hour or per minute). In order to tackle these problems, the AGORA-DSM was evaluated in two different context of managing heterogeneous geosensors for flood risk management: the ”Pegel Online” in Germany and CEMADEN in Brazil. ”Pegel Online” is the water and ship propulsion management agency of the Federal government of Germany. ”Pegel Online” Rest API is a resource-oriented interface to retrieve hydrographic data in different formats without any authentication. The users are able to access stations and measurements attributes continuously. The access to the stations can be done by using the station UUID, name and number, or even the water parameters. Special queries allow the access to the station considering a radius of (in km): a geographic location (coordinates in WGS84), a station name or within a given river name. The measurements are provided by using filters based on either the timestamp (encoded as ISO-8601) or a station name. The measurements of the last 30 days can be gathered. The time interval of the measurements can vary from 2 minutes to 1 hour depending on the station implementation. The measurements contains a time encoded in an ISO-8601 format, a decimal unit value, a tendency to increase the value, a current water level (low, normal, high, unknown, noted or out-of-date) both with the lowest average values (mnw) and the highest average values (mhw). During the analyzed period, ”Pegel Online” provided 644 stations (identifier and name). For performing the evaluation, a measurement from each station was gathered. The National Center for Monitoring and Early Warning of Natural Disasters (CEMADEN) in Brazil, which provides sensor data by means of Web service. Unlike ”Pegel Online”, the station and measurement metadata from CEMADEN are combined. The station measurements structure is delivered as a JavaScript Object Notation (JSON) due to the lightness and ease use of its format. It contains ten fields, which are the following: the station code, the location (latitude and longitude) in decimal degrees, city name, station name, data type, UF acronym of the city, the rain gauge, the water level and the date time (UTC). The measurements are provided every 10 minutes if it is raining, otherwise every hour. The value contained in the
81
5.4. Deployment and Analysis
Parameters Values # of registered sensors 644 average time (in seconds) 0.0741 median time (in seconds) 0.0470 Table 10 – Parameters for registering sensors from ”Pegel Online”.
water level takes into account a difference between the distance of the station installation to the measuring level, while the value contained in the rain gauge is calibrated to be the exactly data measured. When CEMADEN Web service is working, only the measurements from the last four hours can be accessed, otherwise only the measurements from the last three hours. During the analyzed period, CEMADEN provided 8989 stations, as well as the same number of measurements. The deployment has run on a computer with 2.10GHz Pentium(R) Dual-Core CPU T4300 and 4 GB RAM memory running Windows 7 Home Premium Service Pack 1 (64 bit), on 25th October 2015. We used an interoperable service-enabler sensor node, as well as a Postgres database with a PostGIS spatial extension, a servlet container (Apache Tomcat 8) and 52 North SOS 4.1. The implementation was performed using Java language and Apache Axis2 for the webservice engine. Moreover, the SOS framework provided by the 52 North German initiative for Geospatial Open Source software was deployed as an instance of Sensor Web standards. Its advantages are that it has an open source code (that is easily adapted) and provides all of the SOS operations required in this work, unlike other implementations. The framework consists of an application, that is implemented with the aid of Java Servlet and the Apache Tomcat web server, and a data server, based on a PostgreSQL database management system containing an extension of a geographic database called PostGIS.
5.4.2
Performance Evaluation
The deployment involves: (1) the performance (latency and scalability) analysis of the acquired sensor data; and (2) the adoption of SOS standards to achieve interoperability. The performance was measured by evaluating the elapsed time ΔAGORA-DSM (AGORA-DSM latency), defined as the time between the acquisition of the sensor data and the publication of the sensor data into the SOS repository. This time also depends on the implementation of the SOS that is used. The performed analysis showed no great impact of the different amount of geosensors on the acquired results. The processing time to register sensors takes generally less than one second, which is still acceptable for a flood risk management. In Figure 23, the time processing to register 644 hundreds sensors in sequence is depicted. The median and average time can be seen in Table 10. In Figure 24, the time processing to publish the observations from all the ”Pegel Online”
Chapter 5. Towards a middleware to dynamically manage heterogeneous geosensors in near real-time for disaster 82 management
Figure 23 – Latency for registering sensors.
Parameters Values # of registered sensors 644 average time (in seconds) 1.0916 median time (in seconds) 1.0348 Table 11 – Parameters for publishing observations from Cemaden.
Parameters Values # of registered sensors 8989 average time (in seconds) 0.2227 median time (in seconds) 0.2025 Table 12 – Parameters for registering sensors and publishing observations from Cemaden.
sensors is shown. The Table 11 contains the amount of observations, as well as the median and average processing time to publish them. In Figure 25, the amount of 8989 messages to register sensors and publish observations from CEMADEN is depicted. Table 12 contains the median and average processing time to perform that.
83
5.5. Final Remarks
Figure 24 – Latency for publishing observations.
5.5
Final Remarks
Sensor networks have been increasingly deployed for environmental monitoring to provide a larger amount of available data in near real-time. There are stationary sensors that can measure water levels and temperature, and there are also mobile sensors that can be used to increase the coverage area. This paper provides a service-oriented middleware for near real-time management of heterogeneous geosensors in disaster management, which is called AGORADSM. Our main goal is to define a middleware that is capable of the following: re-usability and interoperability of components, offering support for near real-time heterogeneous sensor data publication on the Web in accordance with the OGC standards, and discover sensors in a dynamic context. The approach consists of a protocol message, adapters, a dynamic sensor management component, and a Sensor Observation Service (SOS). The evaluation was based on acquiring sensor data from two government agencies that monitor floods. Three important contributions made by this work to the research field should be highlighted: the first is the support for near real-time sensor data publication on the Web, the second is the interoperable and re-usable components of SWE for integrating heterogeneous geosensors into the Sensor Web, and the third is a deployment of the middleware for a dynamic integration of sensors involved in flood risk management.
Chapter 5. Towards a middleware to dynamically manage heterogeneous geosensors in near real-time for disaster 84 management
Figure 25 – Latency for registering sensors and publishing observations.
This work also aims to improve the interoperability between the sensor networks and Sensor Web. The protocol message is easy to interpret, which results in the AGORA-DSM low latency evaluation. Both features are crucial for near real-time applications such as flood risk management. The number of sensors varied in the conducted tests so that the scalability of the proposal could also be evaluated. Unlike other approaches that are not considering the intensive work on the implementation to control a wide variety of sensor devices (GEIPEL et al., 2015; CHEN et al., 2015a), our approach aims to provide less complexity and size to developers, also avoiding dependence on a stable network, with no Internet connection. However, because of this, a hardware description of the sensors are not complete covered. The AGORA-DSM does not require any enhancement of SOS operations. Instead, our approach takes place between the Sensor and Application Layerl. Furthermore, the evaluated testes are more complex and dynamic than those that existing approaches can handle (BRöRING; FOERSTER; JIRKA, 2010). This is based on an assumption that all sensors can operate without any pre-existing infrastructure. In the future work lines, we intend to design adapters for citizens as sensors, specially for crowdsourcing platforms. We also aim to integrate the SOS with the Sensor Event Service (SES), a publish-subscribe mechanism, so that it can help decision-makers to gather sensor data in a streaming way. All of this future implementation will be deployed as a Web Processing
5.5. Final Remarks
85
Service (WPS) to improve the interoperability involved. More tests would help to ensure the performance and importance of the middleware.
87
CHAPTER
6 CONCLUSION
6.1
Discussion and Final Considerations
Providing interoperable mechanisms for heterogeneous geosensors to enable their integration, makes it easier to publish their data on the Web in near real-time. In addition, a set of open standard protocols, (also known as Sensor Web Standards), can improve the accessibility, discovery and exchange of sensor data. However, a further stage is required to dynamically integrate them, which is the complex question of controlling and gaining a access to this data. This project set out by conducting a systematic mapping of the literature since it was not yet clear how existing approaches are able to integrate heterogeneous geosensors and what their main functionalities are. This systematic mapping was a means of pointing out all the considerable configurations and adaptations that were necessary to use Sensor Web standards in this context, and determine which mechanisms were still missing from the Sensor Web. Although Sensor Web standards are designed to increase the range of geosensor activities, our findings showed that there was a need for interoperability to facilitate the exchange of heterogeneous geosensor data to overcome the problem of different specifications and protocols. In addition to the interoperability issue, it is also necessary to provide a simple service for reuse, adaptation and composition, since most of the existing approaches depend on specific features to solve their problems. New service interfaces could reduce the coupling between sensors and applications by freeing them from their dependence on all the layers and encapsulating the service functionalities without having an impact on the applications. On the other hand, existing services such as Sensor Web standards can form a semantic matchmaking correspondence between geosensors and Sensor Web services, although a good performance is still required for real-time purposes. The varying number of heterogeneous geosensors involved in these kinds of applications means that there is a constant need for managing both a small and large number of sensors, which
88
Chapter 6. Conclusion
requires greater scalability, and hence, a high-level performance. In addition, functionalities should enable the application to register new sensors, publish new observations, and make sensor data available so that they can be accessed in near real-time or historically through an observation repository. Unlike our approach, when most of the other approaches exchange sensor observation, they only make use of heavy format data which affects the near real-time issue. The main benefits of the plug-and-play for the Sensor Web were first to support a near real-time data publication in a standardized way, and then to extend a protocol message to dynamically manage sensor data and activities and ensure that they comply with the Sensor Web standards. Since the protocol message was easy to interpret and translate, the proposed approach helps to improve both the interoperability, and latency. The sensor data and activity management generally take less than one second, which means the proposed system is able to keep track of sensors in dynamic scenarios. As demonstrated in this project, publishing observations in the Sensor Web took longer than the other messages because further processing was necessary to store them on the web. The conducted tests were carried out in two situations that were designed to represent flood scenarios. The number of sensors varied so that the scalability of the proposal could also be evaluated. An existing SOS 2.0 implementation was used that contains most of the SOS operations needed to handle all the sensor data available, although it raised problems over scalability and near real-time issues. In our tests, a real-world application scenario was employed to evaluate the middleware. This application involves prioritizing location-based social network messages for flood risk management based on sensor data provided by the AGORA-DSM. Social network messages can be a valuable source of information for flood risk management, but since there are a large number of provided messages, there remains the problem of how to manually filter the messages that are useful and accurate. The shortest distance between a social network message and a hazardous area is used as a priority parameter. This area of risk is a catchment zone where a sensor measures the high rate of the water level. The implementation and analysis showed that automatically giving priority to social network messages by using near real-time sensor data, can assist the estimates of the overall situation in vulnerable areas, and improve decision-making in flood risk management.
6.2
Future Works
The future works outlines the final version of the AGORA-DSM. In this section, a future version of the design of the service-oriented middleware for dynamic, near real-time management of heterogeneous geosensors in flood risk management containing the following open standard protocols: SensorML, O&M, SOS, SES and WPS. The middleware will consist of a sensor management and adapters of the sources within
6.2. Future Works
89
a WPS component. All the data sources will be stored in a standardized way into the a repository by using SOS services, as well as forwarded to the applications by means of SES services. The sources comprises of traditional sensor networks (stationary and mobile sensors) and citizen as sensors (crowdsourcing platforms). Our aim is to overcome the lack of standardization between sensors and applications by integrating automatically sensors into the Sensor Web and providing sensor data to the decisionmakers in a streaming way using an API. This composition of SWE services contained in the AGORA-DSM boosts the reusability of efforts involved to integrate geosensors and flood web applications.
6.2.1
Citizen as Sensors
Over the years, people with different levels of education have started playing a role that formerly only belonged to government departments. Their activities are carried out on a voluntary basis, but do not always lead to accurate results. However, these people have had a great impact on Geographic Information Systems (GIS), when acting collectively. The information they obtain is called Voluntereed Geographic Information (VGI) (GOODCHILD, 2007). OpenStreetMap1 and Wikimapia2 are examples of VGI, and its work involves users in providing descriptions of locations throughout the world. Hence, technologies such as Web 2.0, georeferencing, geotags, GPS and broadband communication are important factors. (GOODCHILD, 2007) highlights three types of sensor networks: 1) a stationary sensor network designed to pick up specific measurements in the environment; 2) a mobile network, in which sensors can move; and finally, 3) a network consisting of humans, or ”humans as sensors”, which is equipped with five senses and intelligence, for registering and interpreting what they feel. These ”humans as sensors” contain over 6 billion components, and are based in local communities which collate and interpret the information. This network can be seen as a concrete example of VGI. In the light of these concepts, a crowdsourcing platform used for obtaining volunteered information for flood risk management, (also known as Citizen Observatory for floods), can be integrated into AGORA-DSM. Since citizens are in a position to submit reports of the environmental variables, i.e. the water level of the river bed and wetlands, this platform can lead to an integration between the Citizen Observatory and AGORA-DSM and thus configure an additional new type of data source. The volunteers there must provide information such as a title, description, date, time and category, and other optional information (name, surname, email, photo, etc.). In addition, they can look at reports submitted by other volunteers. Inside the platform, the categories represent 1 2
http://www.openstreetmap.org/ http://wikimapia.org/
90
Chapter 6. Conclusion
different mechanisms that can help the volunteers to gauge the water level in the river bed. Each mechanism corresponds to a different scenario, namely a controlled point, a semi-controlled point or a non- controlled point. A controlled point is a mechanism that relies on a limnimetric rule deployed in the riverbed. When reporting the level of water with the aid of this mechanism, the volunteer must select the category of the water level and then indicate which of the markers is the water. A semi-controlled point contains two mechanisms that can assist the volunteers: a doll, similar to a human body, and colored bands (red, orange, yellow and green), which represent a risk index (i.e. warning system) of a flood occurrence. In this case, the volunteer must determine the category of the water level by examining the doll and then select the sub-category that characterizes the doll (water level above the neck, up to the neck, waist, knee or ankle). The same applies to the colored bands system, which requires the volunteers to select the category for the water level. Finally, there is the uncontrolled point which has no mechanisms to assist the volunteer which means that they have to determine the water level by deduction (e.g. high, normal or low).
6.2.2
Publish-Subscribe Mechanism
SOS contains a repository that can act as a producer of sensor information, then a publish-subscribe mechanism to provide them would be helpful for decision-makers interested on such information. Sensor Event Service (SES) is a broker which forwards information from a producer, in this case the SOS, to a consumer (any service or application). SES can act as an event notification system by registering a sensor using its SensorML, receiving its notifications in a O&M specification, and transfering all the data to the applications that subscribed for sensor observations available at the service, based on certain filter criteria that fit to the parameters previously established by the applications. The service performs three levels of filtering criteria of sensor data (streams): (1) the first level is required and uses XPath to set the filter to be applied in each of the notifications separately; (2) the second level is optional and uses a combination of comparison operators and arithmetic temporal, spatial and logical for each of the notifications; and (3) the last level can handle queries on data streams, operating in all the events that arrive at the broker (EVERDING, 2008). Such filters are used to match discovered sensor data so that notifications can be sent to the subscriber in an push-based manner. Furthermore, SES aims to support event-driven and service-oriented architectures, both sensor data fusion and mining inside SDIs, as well as scenarios where a dynamic and near real-time management of sensor data is required. SES also helps to complement mechanisms for exchanging messages between applications and services. The service provide information about the responsible for the service, which operations
6.2. Future Works
91
are supported, which level is supported, whether registration of producers is supported, how lifetime of registrations and subscriptions are handle, which producers are registered, and reliable communication management. Furthermore, SES provides to the applications operations to subscribe, notify, renew, unsubscribe considering a subscription.
6.2.3
AGORA-GeoDashboard - Flood Web Application
However, there is another application that could be integrated with the AGORA-DSM. The AGORA-GeoDashboard is a digital control panel that is employed to access and display data from different types of sensors in the city of São Carlos - Brazil. This application consists of a test-bed of distributed sensors that has been designed to assist emergency agencies and communities engaged in flood risk management. The key features are: (1) a web map; (2) a spatial database; and (3) indicators of the current state of the rivers. The web map shows the geographically distributed sensors that are required to monitor critical flooded areas in the city of São Carlos. The database consists of sensor data, which can be seen by selecting both a sensor and a specific period of the sensor data (in days). The indicators consist of the following: (1) a comparison between the water level (in cm) where the sensors are deployed and the possible flood level in that region; (2) the volume of rainfall measured by a pluviometer located near the base station; (3) the risk index, which assesses the vulnerability of people situated in the river flow region (river flow depth/the speed of the flow at a given time) (MENDIONDO; SOUZA, 2013); (3) and an image of the river, updated a fixed intervals of time, and picked up by the sensors.
93
BIBLIOGRAPHY
ABANGAR, H.; BARNAGHI, P.; MOESSNER, K.; NNAEMEGO, A.; BALASKANDAN, K.; TAFAZOLLI, R. A service oriented middleware architecture for wireless sensor networks. In: Proceedings of future network and mobile summit conference. [S.l.: s.n.], 2010. Cited 2 times on pages 40 and 41. ABDELZAHER, T.; BLUM, B.; CAO, Q.; CHEN, Y.; EVANS, D.; GEORGE, J.; GEORGE, S.; GU, L.; HE, T.; KRISHNAMURTHY, S. et al. Envirotrack: Towards an environmental computing paradigm for distributed sensor networks. In: IEEE. Distributed computing systems, 2004. proceedings. 24th international conference on. [S.l.], 2004. p. 582–589. Cited on page 27. ABDULRAZAK, B.; HELAL, A. Enabling a plug-and-play integration of smart environments. In: IEEE. Information and Communication Technologies, 2006. ICTTA’06. 2nd. [S.l.], 2006. v. 1, p. 820–825. Cited on page 35. ABERER, K.; HAUSWIRTH, M. Middleware support for the" internet of things". 2006. Cited on page 27. AHMAD, S.; SIMONOVIC, S. P. An Intelligent Decision Support System for Management of Floods. Water Resources Management, Kluwer Academic Publishers, v. 20, n. 3, p. 391–410, 2006. ISSN 0920-4741. Cited 3 times on pages 25, 65, and 80. ALBUQUERQUE, J. P.; ZIPF, A. Collaborative information systems for disaster management: Building resilience against disasters by combining participatory environmental monitoring and vulnerability communication. In: Alumni Seminar Natural Hazards. [S.l.: s.n.], 2012. p. 71–74. Cited on page 28. ALBUQUERQUE, J. P. de; HERFORT, B.; BRENNING, A.; ZIPF, A. A geographic approach for combining social media and authoritative data towards identifying useful information for disaster management. International Journal of Geographical Information Science, Taylor & Francis, v. 29, n. 4, p. 667–689, 2015. Cited on page 62. ARNABOLDI, V.; CONTI, M.; DELMASTRO, F.; MINUTIELLO, G.; RICCI, L. Sensor mobile enablement (sme): A light-weight standard for opportunistic sensing services. In: IEEE. Pervasive Computing and Communications Workshops (PERCOM Workshops), 2013 IEEE International Conference on. [S.l.], 2013. p. 236–241. Cited 4 times on pages 27, 46, 48, and 75. ASSIS, L. F. F. G.; HERFORT, B.; STEIGER, E.; HORITA, F. E. A.; ALBUQUERQUE, J. ao P. A geographic approach for on-the-fly prioritization of social-media messages towards improving flood risk management. In: Proceedings of the 4th Brazilian Workshop on Social Network Analysis and Mining (BraSNAM). [S.l.: s.n.], 2015. p. 1–12. Cited 3 times on pages 30, 32, and 62. . Geographical prioritization of social network messages in near real-time using sensor data streams: an application to floods. 2015. Cited 3 times on pages 30, 32, and 60.
94
Bibliography
ASSIS, L. F. F. G. d.; BEHNCK, L. P.; DOERING, D.; FREITAS, E. P.; PEREIRA, C. E.; HORITA, F. E. A.; UEYAMA, J.; ALBUQUERQUE, J. P. Dynamic sensor management: Extending sensor web for near real-time mobile sensor integration in dynamic scenarios. In: 30th IEEE International Conference on Advanced Information Networking and Applications (AINA). [S.l.: s.n.], 2016. Cited on page 31. BAHARIN, S.; SHIBGHATULLAH, A.; OTHMAN, Z. Disaster management in Malaysia: An application framework of integrated routing application for emergency response management system. In: Proceedings of the 2009 International Conference of Soft Computing and Pattern Recognition (SOCPAR). Washington, USA: [s.n.], 2009. p. 716–719. Cited on page 26. BAKILLAH, M.; LIANG, S. H.; ZIPF, A.; MOSTAFAVI, M. A. A dynamic and context-aware semantic mediation service for discovering and fusion of heterogeneous sensor data. Journal of Spatial Information Science, n. 6, p. 155–185, 2015. Cited 4 times on pages 27, 46, 48, and 75. BARR, R.; BICKET, J. C.; DANTAS, D. S.; DU, B.; KIM, T.; ZHOU, B.; SIRER, E. G. On the need for system-level support for ad hoc and sensor networks. ACM SIGOPS Operating Systems Review, ACM, v. 36, n. 2, p. 1–5, 2002. Cited on page 27. BARTHE-DELANOË, A.-M.; BÉNABEN, F.; TRUPTIL, S.; PINGAUD, H. A flexible network of sensors: case study. In: Proceedings of the 10th International ISCRAM Conference, Baden-Baden, Germany. [S.l.: s.n.], 2013. Cited on page 75. BEDER, D. M.; UEYAMA, J.; ALBUQUERQUE, J. a. P. de; CHAIM, M. L. FlexFT: A Generic Framework for Developing Fault-Tolerant Applications in the Sensor Web. International Journal of Distributed Sensor Networks, p. 1–12, 2013. ISSN 1550-1329. Disponível em: . Cited on page 74. BEDER, D. M.; UEYAMA, J.; ALBUQUERQUE, J. P. de; CHAIM, M. L. Flexft: A generic framework for developing fault-tolerant applications in the sensor web. International Journal of Distributed Sensor Networks, Hindawi Publishing Corporation, v. 2013, 2013. Cited 3 times on pages 24, 40, and 41. BIOLCHINI, J.; MIAN, P. G.; NATALI, A. C. C.; TRAVASSOS, G. H. Systematic review in software engineering. System Engineering and Computer Science Department COPPE/UFRJ, Technical Report ES, v. 679, n. 05, p. 45, 2005. Cited on page 38. R Sensor Web Enablement BOTTS, M.; PERCIVALL, G.; REED, C.; DAVIDSON, J. OGC ○ : Overview And High Level Architecture . In: OPEN GEOSPATIAL CONSORTIUM. AUTOTESTCON. Baltimore, 2007. p. 372 – 380. Cited on page 24. R sensor web enablement: Overview and high level architecture. In: GeoSensor . Ogc○ networks. [S.l.]: Springer, 2008. p. 175–190. Cited 3 times on pages 33, 35, and 74.
BRERETON, P.; KITCHENHAM, B. A.; BUDGEN, D.; TURNER, M.; KHALIL, M. Lessons from applying the systematic literature review process within the software engineering domain. Journal of systems and software, Elsevier, v. 80, n. 4, p. 571–583, 2007. Cited on page 39. BROERING, A.; BELOW, S.; FOERSTER, T. Declarative sensor interface descriptors for the sensor web. In: WebMGS 2010: 1st International Workshop on Pervasive Web Mapping, Geoprocessing and Services. [S.l.: s.n.], 2010. p. 26–32. Cited on page 36.
Bibliography
95
BROERING, A.; FOERSTER, T.; JIRKA, S.; PRIESS, C. Sensor bus: An intermediary layer for linking geosensor networks and the sensor web. 2010. Cited 6 times on pages 27, 31, 40, 41, 51, and 59. BRÖRING, A.; ECHTERHOFF, J.; JIRKA, S.; SIMONIS, I.; EVERDING, T.; STASCH, C.; LIANG, S.; LEMMENS, R. New generation sensor web enablement. Sensors, Molecular Diversity Preservation International, v. 11, n. 3, p. 2652–2699, 2011. Cited 3 times on pages 25, 35, and 46. BRORING, A.; FOERSTER, T.; JIRKA, S. Interaction patterns for bridging the gap between sensor networks and the sensor web. In: IEEE. Pervasive Computing and Communications Workshops (PERCOM Workshops), 2010 8th IEEE International Conference on. [S.l.], 2010. p. 732–737. Cited 3 times on pages 26, 40, and 41. BRöRING, A.; FOERSTER, T.; JIRKA, S. Sensor Bus : An Intermediary Layer for Linking Geosensors and the Sensor Web. 2010. 8 p. Cited 2 times on pages 75 and 84. BRÖRING, A.; JANOWICZ, K.; STASCH, C.; KUHN, W. Semantic challenges for sensor plug and play. In: Web and wireless geographical information systems. [S.l.]: Springer, 2009. p. 72–86. Cited 2 times on pages 40 and 41. BRÖRING, A.; MAUÉ, P.; JANOWICZ, K.; NÜST, D.; MALEWSKI, C. Semantically-enabled sensor plug & play for the sensor web. Sensors, Molecular Diversity Preservation International, v. 11, n. 8, p. 7568–7605, 2011. Cited 2 times on pages 34 and 40. R SenBRöRING, A.; STASCH, C.; ECHTERHOFF, J. Open Geospatial Consortium OGC ○ sor Observation Service Interface Standard. 2012. 163 p. Cited 3 times on pages 15, 107, and 108.
BRUNETON, E.; COUPAYE, T.; LECLERCQ, M.; QUÉMA, V.; STEFANI, J.-B. The fractal component model and its support in java. Software: Practice and Experience, Wiley Online Library, v. 36, n. 11-12, p. 1257–1284, 2006. Cited 2 times on pages 40 and 41. BUDGEN, D.; TURNER, M.; BRERETON, P.; KITCHENHAM, B. Using mapping studies in software engineering. In: Proceedings of PPIG. [S.l.: s.n.], 2008. v. 8, p. 195–204. Cited on page 36. BUEHLER, G.; REED, C. OGC Orientation Slides. 2011. 1–128 p. Cited 2 times on pages 24 and 33. CHEN, N.; WANG, K.; XIAO, C.; GONG, J. A heterogeneous sensor web node meta-model for the management of a flood monitoring system. Environmental Modelling & Software, Elsevier, v. 54, p. 222–237, 2014. Cited 2 times on pages 25 and 46. CHEN, N.; XIAO, C.; PU, F.; WANG, X.; WANG, C.; WANG, Z.; GONG, J. Cyber-physical geographical information service-enabled control of diverse in-situ sensors. Sensors, Multidisciplinary Digital Publishing Institute, v. 15, n. 2, p. 2565–2592, 2015. Cited 2 times on pages 75 and 84. CHEN, N.; ZHANG, X.; CHEN, Z.; YAN, S. Integrated geospatial sensor web for agricultural soil moisture monitoring. In: IEEE. Agro-Geoinformatics (Agro-geoinformatics), 2015 Fourth International Conference on. [S.l.], 2015. p. 28–32. Cited 4 times on pages 27, 46, 48, and 59.
96
Bibliography
CIANCETTA, F.; BUCCI, G.; FIORUCCI, E.; LANDI, C. A plug-n-play wireless sensor network based on web service for monitoring climatic parameters. In: IEEE. Virtual Environments Human-Computer Interfaces and Measurement Systems (VECIMS), 2010 IEEE International Conference on. [S.l.], 2010. p. 72–76. Cited 2 times on pages 40 and 41. . An rfid plug-n-play smart sensors for monitoring forest fires. In: Proc. IMEKO TC-4 and TC-19 Symposium and IWADC Instrumentation for the ICT Area, Kosice. [S.l.: s.n.], 2010. Cited on page 40. CIANCETTA, F.; D’APICE, B.; GALLO, D.; LANDI, C. Plug-n-play smart sensor based on web service. Sensors Journal, IEEE, IEEE, v. 7, n. 5, p. 882–889, 2007. Cited on page 40. . Plug-n-play smart sensor network with dynamic web service. Instrumentation and Measurement, IEEE Transactions on, IEEE, v. 57, n. 10, p. 2136–2145, 2008. Cited on page 40. COSTA, P.; COULSON, G.; GOLD, R.; LAD, M.; MASCOLO, C.; MOTTOLA, L.; PICCO, G. P.; SIVAHARAN, T.; WEERASINGHE, N.; ZACHARIADIS, S. The runes middleware for networked embedded systems and its application in a disaster management scenario. In: IEEE. Pervasive Computing and Communications, 2007. PerCom’07. Fifth Annual IEEE International Conference on. [S.l.], 2007. p. 69–78. Cited 2 times on pages 40 and 41. COULSON, G.; BLAIR, G.; GRACE, P.; TAIANI, F.; JOOLIA, A.; LEE, K.; UEYAMA, J.; SIVAHARAN, T. A generic component model for building systems software. ACM Transactions on Computer Systems (TOCS), ACM, v. 26, n. 1, p. 1, 2008. Cited 2 times on pages 40 and 41. DELIN, K. A. The sensor web: A macro-instrument for coordinated sensing. Sensors, Molecular Diversity Preservation International, v. 2, n. 7, p. 270–285, 2002. Cited on page 34. . Sensor webs in the wild. Wireless Sensor Networks: A Systems Perspective. Artech House, v. 238, 2005. Cited on page 35. DELIN, K. A.; JACKSON, S. P. Sensor web: a new instrument concept. In: INTERNATIONAL SOCIETY FOR OPTICS AND PHOTONICS. Symposium on Integrated Optics. [S.l.], 2001. p. 1–9. Cited on page 35. DÍAZ, L.; BRÖRING, A.; MCINERNEY, D.; LIBERTÁ, G.; FOERSTER, T. Publishing sensor observations into geospatial information infrastructures: A use case in fire danger assessment. Environmental Modelling & Software, Elsevier, v. 48, p. 65–80, 2013. Cited 2 times on pages 40 and 42. DOERING, D.; BENEMANN, A.; LERM, R.; FREITAS, E. P.; MÃ1/4LLER, I.; WINTER, J. M.; PEREIRA, C. E. Design and optimization of a heterogeneous platform for multiple uav use in precision agriculture applications. In: World Congress. [S.l.: s.n.], 2014. v. 19, n. 1, p. 12272–12277. Cited on page 53. DOLIF, G.; ENGELBRECHT, A.; JATOBÁ, A.; SILVA, A. J. D. da; GOMES, J. O.; BORGES, M. R.; NOBRE, C. A.; CARVALHO, P. V. R. de. Resilience and brittleness in the alerta rio system: a field study about the decision-making of forecasters. Natural hazards, Springer, v. 65, n. 3, p. 1831–1847, 2013. Cited on page 61.
Bibliography
97
DUNBAR, M. Plug-and-play sensors in wireless networks. Instrumentation & Measurement Magazine, IEEE, IEEE, v. 4, n. 1, p. 19–23, 2001. Cited on page 35. EDIGER, D.; JIANG, K.; RIEDY, J.; BADER, D.; CORLEY, C.; FARBER, R.; REYNOLDS, W. Massive social network analysis: Mining twitter for social good. In: Proceedings of the 39th International Conference on Parallel Processing (ICPP). [S.l.: s.n.], 2010. p. 583–593. Cited on page 62. ERMAN, A. T.; HAVINGA, P. Data dissemination of emergency messages in mobile multi-sink wireless sensor networks. In: Ad Hoc Networking Workshop (Med-Hoc-Net), 2010 The 9th IFIP Annual Mediterranean. [S.l.: s.n.], 2010. p. 1–8. Cited 2 times on pages 47 and 59. EVERDING, T. Sensor Event Service Interface Specification. 2008. Cited on page 90. FALCK, T.; BALDUS, H.; ESPINA, J.; KLABUNDE, K. Plug’n play simplicity for wireless medical body sensors. Mobile Networks and Applications, Springer-Verlag New York, Inc., v. 12, n. 2-3, p. 143–153, 2007. Cited on page 35. FOERSTER, T.; NÜST, D.; BRÖRING, A.; JIRKA, S. Discovering the sensor web through mobile applications. [S.l.]: Springer, 2012. Cited 2 times on pages 40 and 42. FRADEN, J.; KING, J. Handbook of modern sensors: physics, designs, and applications. American Journal of Physics, American Association of Physics Teachers, v. 66, n. 4, p. 357–359, 1998. Cited on page 34. FREITAS, E. Pignaton de; HEIMFARTH, T.; NETTO, I. F.; PEREIRA, C. E.; FERREIRA, A. M.; WAGNER, F. R.; LARSSON, T. Handling failures of static sensor nodes in wireless sensor network by use of mobile sensors. In: IEEE. Advanced Information Networking and Applications (WAINA), 2011 IEEE Workshops of International Conference on. [S.l.], 2011. p. 127–134. Cited on page 45. GAO, H.; BARBIER, G.; GOOLSBY, R. Harnessing the crowdsourcing power of social media for disaster relief. IEEE Intelligent Systems, IEEE Computer Society, v. 26, n. 3, p. 10–14, 2011. Cited on page 62. GEIPEL, J.; JACKENKROLL, M.; WEIS, M.; CLAUPEIN, W. A sensor web-enabled infrastructure for precision farming. ISPRS International Journal of Geo-Information, Multidisciplinary Digital Publishing Institute, v. 4, n. 1, p. 385–399, 2015. Cited 6 times on pages 27, 46, 48, 59, 75, and 84. GOODCHILD, M. F. Citizens as Voluntary Sensors: Spatial Data Infrastructure in the World of Web 2.0. Internation Journal of Spatial Data Infrastructures Research, v. 2, p. 24–32, 2007. Cited on page 89. HADIM, S.; MOHAMED, N. Middleware for Wireless Sensor Networks : A Survey. In: The First International Conference on Communication System Software and Middleware (COMSWARE). New Delhi, India: [s.n.], 2006. Cited on page 74. . Middleware for wireless sensor networks: A survey. In: IEEE. Communication System Software and Middleware, 2006. Comsware 2006. First International Conference on. [S.l.], 2006. p. 1–7. Cited on page 27. . Middleware: Middleware challenges and approaches for wireless sensor networks. IEEE distributed systems online, IEEE, n. 3, p. 1, 2006. Cited on page 26.
98
Bibliography
HANSSON, H.; AKERHOLM, M.; CRNKOVIC, I.; TORNGREN, M. Saveccm-a component model for safety-critical real-time systems. In: IEEE. Euromicro Conference, 2004. Proceedings. 30th. [S.l.], 2004. p. 627–635. Cited 2 times on pages 40 and 41. HEIMFARTH, T.; ARAUJO, J. P. D. Using unmanned aerial vehicle to connect disjoint segments of wireless sensor network. In: IEEE. Advanced Information Networking and Applications (AINA), 2014 IEEE 28th International Conference on. [S.l.], 2014. p. 907–914. Cited on page 48. HEINZELMAN, W. B.; MURPHY, A. L.; CARVALHO, H. S.; PERILLO, M. et al. Middleware to support sensor network applications. Network, IEEE, IEEE, v. 18, n. 1, p. 6–14, 2004. Cited 2 times on pages 26 and 27. HOHPE, G.; WOOLF, B. Enterprise integration patterns: Designing, building, and deploying messaging solutions. [S.l.]: Addison-Wesley Professional, 2004. Cited on page 27. HORITA, F. E.; ALBUQUERQUE, J. P. de; DEGROSSI, L. C.; MENDIONDO, E. M.; UEYAMA, J. Development of a spatial decision support system for flood risk management in brazil that combines volunteered geographic information with wireless sensor networks. Computers & Geosciences, Elsevier, v. 80, p. 84–94, 2015. Cited 3 times on pages 53, 61, and 62. HORITA, F. E.; ASSIS, L. F.; CASTANHARI, R. E.; ISOTANI, S.; CRUZ, W. M.; ALBUQUERQUE, J. P. de. A gamification-based social collaborative architecture to increase resilience against natural disasters. 2014. Cited on page 29. HORITA, F. E. A.; DEGROSSI, L. C.; ASSIS, L. F. F. G.; ZIPF, A.; ALBUQUERQUE, J. a. P. de. The use of Volunteered Geographic Information ( VGI ) and Crowdsourcing in Disaster Management : a Systematic Literature Review. In: Proceedings of the Nineteenth Americas Conference on Information Systems. Chicago, Illinois.: [s.n.], 2013. p. 1–10. Cited on page 29. HUGHES, D.; THOELEN, K.; HORRÉ, W.; MATTHYS, N.; CID, J. D.; MICHIELS, S.; HUYGENS, C.; JOOSEN, W. Looci: a loosely-coupled component infrastructure for networked embedded systems. In: ACM. Proceedings of the 7th International Conference on Advances in Mobile Computing and Multimedia. [S.l.], 2009. p. 195–203. Cited 2 times on pages 40 and 41. HUGHES, D.; UEYAMA, J.; MENDIONDO, E.; MATTHYS, N.; HORRÉ, W.; MICHIELS, S.; HUYGENS, C.; JOOSEN, W.; MAN, K. L.; GUAN, S.-U. A middleware platform to support river monitoring using wireless sensor networks. Journal of the Brazilian Computer Society, Springer, v. 17, n. 2, p. 85–102, 2011. Cited 2 times on pages 27 and 74. JIRKA, S.; BRÖRING, A.; STASCH, C. Applying ogc sensor web enablement to risk monitoring and disaster management. In: GSDI 11 World Conference, Rotterdam, Netherlands. [S.l.: s.n.], 2009. Cited 4 times on pages 24, 25, 34, and 46. JIRKA, S.; NÜST, D.; PROSS, B. Sensor web and web processing standards for crisis management. 2013. Cited on page 75. KEELE, S. Guidelines for performing systematic literature reviews in software engineering. [S.l.], 2007. Cited 3 times on pages 34, 36, and 37.
Bibliography
99
KING, J.; BOSE, R.; YANG, H.-I.; PICKLES, S.; HELAL, A. Atlas: A service-oriented sensor platform: Hardware and middleware to enable programmable pervasive spaces. In: IEEE. Local Computer Networks, Proceedings 2006 31st IEEE Conference on. [S.l.], 2006. p. 630–638. Cited on page 35. KITCHENHAM, B.; CHARTERS, S. Guidelines for performing Systematic Literature Reviews in Software Engineering. [S.l.], 2007. 65 p. Cited on page 30. LEE, K. Ieee 1451: A standard in support of smart transducer networking. In: IEEE. Instrumentation and Measurement Technology Conference, 2000. IMTC 2000. Proceedings of the 17th IEEE. [S.l.], 2000. v. 2, p. 525–528. Cited on page 35. LEVIS, P.; CULLER, D. Maté: A tiny virtual machine for sensor networks. In: ACM. ACM Sigplan Notices. [S.l.], 2002. v. 37, n. 10, p. 85–95. Cited on page 27. LEYH, W.; GUTIERREZ, L. A. R.; BRESSIANI, D. d. A.; MENDIONDO, E. M.; ALBUQUERQUE, J. a. P. de. SDI - GEO - WEB - SERVICES FOR RESEARCH, ADMINISTRATION AND SHARING OF ENVIRONMENTAL DATA AND INFORMATION OF DIFFERENT CLIMATE CHANGE SCENARIOS AT PERI-URBAN RIVER BASIN SCALES. In: 5th International Seminar on Environmental Planning and Management Urban Responses for Climate Change. [S.l.: s.n.], 2012. Cited on page 23. LIANG, S. H.; HUANG, C.-Y. Geocens: A geospatial cyberinfrastructure for the world-wide sensor web. Sensors, Multidisciplinary Digital Publishing Institute, v. 13, n. 10, p. 13402–13424, 2013. Cited 4 times on pages 40, 41, 48, and 75. LIU, B.; DOUSSE, O.; NAIN, P.; TOWSLEY, D. Dynamic coverage of mobile sensor networks. Parallel and Distributed Systems, IEEE Transactions on, IEEE, v. 24, n. 2, p. 301–311, 2013. Cited on page 45. LIU, T.; MARTONOSI, M. Impala: A middleware system for managing autonomic, parallel sensor systems. In: ACM. ACM SIGPLAN Notices. [S.l.], 2003. v. 38, n. 10, p. 107–118. Cited on page 27. MAFRA, S. N.; TRAVASSOS, G. H. Estudos primários e secundários apoiando a busca por evidência em engenharia de software. Relatório Técnico: RT-ES-687/06–Programa de Engenharia de Sistemas e Computação-COPPE/UFRJ–Rio de Janeiro, 2006. Cited on page 36. MALEWSKI, C.; BRORING, A.; MAUÉ, P.; JANOWICZ, K. Semantic matchmaking & mediation for sensors on the sensor web. IEEE, 2013. Cited 2 times on pages 40 and 42. . . Selected Topics in Applied Earth Observations and Remote Sensing, IEEE Journal of, IEEE, v. 7, n. 3, p. 929–934, 2014. Cited 2 times on pages 48 and 75. MENDIONDO, E. M. Reducing vulnerability TI water-related disasters in urban areas of the humid tropics. In: PARKINSON, J. N.; GOLDENFUM, J. A.; TUCCI, C. E. M. (Ed.). Integrated Urban Water Management. Paris: UNESCO-IHP, CRC Press, 2010. p. 109–127. Cited on page 25. MENDIONDO, E. M.; SOUZA, V. C. B. Simulação de instabilidade humana em inundações: primeiras considerações. In: XX Simpósio Brasileiro de Recursos Hídricos. Bento Gonçalves, Brasil.: [s.n.], 2013. p. 1–8. Cited on page 91.
100
Bibliography
MILLER, B. A.; NIXON, T.; TAI, C.; WOOD, M. D. Home networking with universal plug and play. Communications Magazine, IEEE, IEEE, v. 39, n. 12, p. 104–109, 2001. Cited on page 36. MOONEY, P.; CORCORAN, P. Can Volunteered Geographic Information be a participant in eEnvironment and SDI? In: Environmental Software Systems. Frameworks of eEnvironment. [S.l.]: Springer, 2011. p. 115–122. Cited on page 61. MÜLLER, R.; FABRITIUS, M.; MOCK, M. An ogc compliant sensor observation service for mobile sensors. In: Advancing Geoinformation Science for a Changing World. [S.l.]: Springer, 2011. p. 163–184. Cited 2 times on pages 48 and 59. OCHIAI, H.; ISHIZUKA, H.; KAWAKAMI, Y.; ESAKI, H. A field experience on dtn-based sensor data gathering in agricultural scenarios. In: Sensors, 2010 IEEE. [S.l.: s.n.], 2010. p. 955–958. ISSN 1930-0395. Cited 2 times on pages 47 and 59. O’FLYRM, B.; MARTINEZ, R.; CLEARY, J.; SLATER, C.; REGAN, F.; DIAMOND, D.; MURPHY, H. Smartcoast: a wireless sensor network for water quality monitoring. In: IEEE. Local Computer Networks, 2007. LCN 2007. 32nd IEEE Conference on. [S.l.], 2007. p. 815–816. Cited on page 35. OSTERMANN, F. O.; SPINSANTI, L. A Conceptual Workflow For Automatically Assessing The Quality Of Volunteered Geographic Information For Crisis Management. In: Proceedings of the 14th International Conference on Geographic Information Science (AGILE). [S.l.: s.n.], 2011. Cited on page 26. PANANGADAN, A.; MONACOS, S.; BURLEIGH, S.; JOSWIG, J.; JAMES, M.; CHOW, E.; TALUKDER, A.; CHU, K.-D. A system to provide real-time collaborative situational awareness by web enabling a distributed sensor network. In: ACM. Proceedings of the First ACM SIGSPATIAL Workshop on Sensor Web Enablement. [S.l.], 2012. p. 24–31. Cited 2 times on pages 40 and 41. PARK, C.-H.; CHO, J.; KIM, D.-H. Sensor web for supporting mobility in sensor networks. In: Computer Applications for Web, Human Computer Interaction, Signal and Image Processing, and Pattern Recognition. [S.l.]: Springer, 2012. p. 203–208. Cited 4 times on pages 27, 46, 48, and 75. PATEL, R.; KAUSHIK, B. Rifmas: River flow management system using wireless sensing agents. In: IEEE. Advance Computing Conference, 2009. IACC 2009. IEEE International. [S.l.], 2009. p. 853–857. Cited on page 45. PATHAN, M.; TAYLOR, K.; COMPTON, M. Semantics-based plug-and-play configuration of sensor network services. In: CITESEER. SSN. [S.l.], 2010. Cited 2 times on pages 34 and 36. PORTER, B.; COULSON, G. Lorien: a pure dynamic component-based operating system for wireless sensor networks. In: ACM. Proceedings of the 4th International Workshop on Middleware Tools, Services and Run-Time Support for Sensor Networks. [S.l.], 2009. p. 7–12. Cited 2 times on pages 40 and 41. RIEKE, M.; FOERSTER, T.; BRÖRING, A. Unmanned aerial vehicles as mobilemulti-sensor platforms. In: The 14th AGILE International Conference on Geographic Information Science. [S.l.: s.n.], 2011. Cited 2 times on pages 48 and 59.
Bibliography
101
SAKAKI, T.; OKAZAKI, M.; MATSUO, Y. Earthquake shakes twitter users: Real-time event detection by social sensors. In: Proceedings of the 19th International Conference on World Wide Web. [S.l.: s.n.], 2010. p. 851–860. Cited on page 62. SAMUNDISWARY, P.; PRIYADARSHINI, P.; DANANJAYAN, P. Performance evaluation of heterogeneous sensor networks. In: Future Computer and Communication, 2009. ICFCC 2009. International Conference on. [S.l.: s.n.], 2009. p. 264–267. Cited on page 33. SCHNEBELE, E.; CERVONE, G.; KUMAR, S.; WATERS, N. Real time estimation of the calgary floods using limited remote sensing data. Water, Multidisciplinary Digital Publishing Institute, v. 6, n. 2, p. 381–398, 2014. Cited on page 62. SGROI, M.; WOLISZ, A.; SANGIOVANNI-VINCENTELLI, A.; RABAEY, J. M. A servicebased universal application interface for ad hoc wireless sensor and actuator networks. In: Ambient Intelligence. [S.l.]: Springer, 2005. p. 149–172. Cited on page 27. SIMONIS, I. OGC Sensor Web Enablement Architecture. 2008. 72 p. Cited on page 35. SIMONOVIC, S. P. Decision Support System for Flood Management in the Red River Basin. Canadian Water Resources Journal, v. 24, n. 3, p. 203–223, 1999. Cited 2 times on pages 25 and 80. SONG, C.-H.; LEE, K.; LEE, W. D. Extended simulated annealing for augmented tsp and multi-salesmen tsp. In: IEEE. Neural Networks, 2003. Proceedings of the International Joint Conference on. [S.l.], 2003. v. 3, p. 2340–2343. Cited on page 54. SONG, M.; KIM, M. C. Rtˆ2m: Real-time twitter trend mining system. In: Proceedings of the 2013 International Conference on Social Intelligence and Technology. [S.l.: s.n.], 2013. p. 64–71. Cited on page 62. SRISATHAPORNPHAT, C.; JAIKAEO, C.; SHEN, C.-C. Sensor information networking architecture. In: IEEE. Parallel Processing, 2000. Proceedings. 2000 International Workshops on. [S.l.], 2000. p. 23–30. Cited on page 27. STARBIRD, K.; STAMBERGER, J. Tweak the tweet: Leveraging microblogging proliferation with a prescriptive syntax to support citizen reporting. 2010. Cited on page 61. STASCH, C.; BRÖRING, A.; WALKOWSKI, A. C. Providing mobile sensor data in a standardized way-the sosmobile web service interface. In: 11th AGILE International Conference on Geographic Information Science. [S.l.: s.n.], 2008. Cited 3 times on pages 24, 48, and 59. TAMAYO, A.; GRANELL, C.; HUERTA, J. Using swe standards for ubiquitous environmental sensing: a performance analysis. Sensors, Molecular Diversity Preservation International, v. 12, n. 9, p. 12026–12051, 2012. Cited 4 times on pages 27, 46, 48, and 75. TREVATHAN, J.; ATKINSON, I.; READ, W.; JOHNSTONE, R.; BAJEMA, N.; MCGEACHIN, J. Establishing low cost aquatic monitoring networks for developing countries. In: Communications: Wireless in Developing Countries and Networks of the Future. [S.l.]: Springer, 2010. p. 39–50. Cited 2 times on pages 40 and 41. TROPMANN-FRICK, M.; ZIEBERMAYR, T. Generic approach for dynamic disaster management system component. In: IEEE. Database and Expert Systems Applications (DEXA), 2014 25th International Workshop on. [S.l.], 2014. p. 160–164. Cited on page 46.
102
Bibliography
TU, Y.; LI, Q.; LIU, R. A geospatial information portal for emergency management of natural disasters. In: Proocedings of the IEEE International Geoscience and Remote Sensing Symposium (IGARSS). Cape Town, South Africa: [s.n.], 2009. p. 404 –407. Cited on page 26. VALAVANIS, K. P. Advances in unmanned aerial vehicles: state of the art and the road to autonomy. [S.l.]: Springer Science & Business Media, 2008. v. 33. Cited on page 73. VIEWEG, S.; CASTILLO, C.; IMRAN, M. Integrating social media communications into the rapid assessment of sudden onset disasters. Social Informatics, v. 8851, p. 444–461, 2014. Cited on page 61. VIEWEG, S.; HUGHES, A. L.; STARBIRD, K.; PALEN, L. Microblogging during two natural hazards events: what twitter may contribute to situational awareness. In: ACM. Proceedings of the SIGCHI Conference on Human Factors in Computing Systems. [S.l.], 2010. p. 1079– 1088. Cited on page 61. WALTER, K.; NASH, E. Coupling wireless sensor networks and the sensor observation service—bridging the interoperability gap. In: Proceedings of 12th AGILE International Conference on Geographic Information Science 2009. [S.l.: s.n.], 2009. Cited on page 36. WAN, Z.; HONG, Y.; KHAN, S.; GOURLEY, J.; FLAMIG, Z.; KIRSCHBAUM, D.; TANG, G. A cloud-based global flood disaster community cyber-infrastructure: development and demonstration. Environmental Modelling & Software, v. 58, p. 86–94, 2014. Cited on page 62. WANG, M.-M.; CAO, J.-N.; LI, J.; DASI, S. K. Middleware for wireless sensor networks: A survey. Journal of computer science and technology, Springer, v. 23, n. 3, p. 305–326, 2008. Cited on page 26. WANG, Y.; HE, Y.; GONG, J.; SHENG, J. A framework of spatial sensor web. In: IEEE. Signal-Image Technologies and Internet-Based System, 2007. SITIS’07. Third International IEEE Conference on. [S.l.], 2007. p. 148–155. Cited 2 times on pages 40 and 41. WOLFF, A.; MICHAELIS, S.; SCHMUTZLER, J.; WIETFELD, C. Network-centric middleware for service oriented architectures across heterogeneous embedded systems. In: IEEE. EDOC Conference Workshop, 2007. EDOC’07. Eleventh International IEEE. [S.l.], 2007. p. 105– 108. Cited 2 times on pages 40 and 41. WU, C.-H.; CHUNG, Y.-C. Heterogeneous wireless sensor network deployment and topology control based on irregular sensor model. In: Advances in Grid and Pervasive Computing. [S.l.]: Springer, 2007. p. 78–88. Cited on page 33. YICK, J.; MUKHERJEE, B.; GHOSAL, D. Wireless sensor network survey. Computer networks, Elsevier, v. 52, n. 12, p. 2292–2330, 2008. Cited on page 34. YU, X.; NIYOGI, K.; MEHROTRA, S.; VENKATASUBRAMANIAN, N. Adaptive middleware for distributed sensor environments. IEEE distributed systems online, IEEE, n. 5, 2003. Cited on page 27. ZEEB, E.; BEHNKE, R.; HESS, C.; TIMMERMANN, D.; GOLATOWSKI, F.; THUROW, K. Generic sensor network gateway architecture for plug and play data management in smart laboratory environments. In: IEEE. Emerging Technologies & Factory Automation, 2009. ETFA 2009. IEEE Conference on. [S.l.], 2009. p. 1–8. Cited 2 times on pages 40 and 41.
Bibliography
103
ZHANG, H.; BABAR, M. A.; TELL, P. Identifying relevant studies in software engineering. Information and Software Technology, Elsevier, v. 53, n. 6, p. 625–637, 2011. Cited on page 39. ZIELINSKI, A.; MIDDLETON, S. E.; TOKARCHUK, L.; WANG, X. Social media text mining and network analysis for decision support in natural crisis management. Proc. ISCRAM. BadenBaden, Germany, p. 840–845, 2013. Cited on page 61. ZUBIAGA, A.; SPINA, D.; MARTíNEZ, R.; FRESNO, V. Real-time classification of twitter trends. Journal of the Association for Information Science and Technology, v. 66, n. 3, p. 462–473, 2015. ISSN 2330-1643. Disponível em: . Cited on page 63.
105
APPENDIX
A IMPLEMENTATION DETAILS
AGORA-DSM interacts with the SOS by means of several operations, aiming to connect the geosensors into the applications. In this section, it will be presented the most important terms and definitions contained in the specification of the heterogeneous sensor data sources, SOS, adapters, the dynamic sensor management component and the flood web application.
Heterogeneous Sensor Data Source Pegelonline Rest API Pegelonline Rest API is a resource-oriented interface to retrieve hydrographic data in different formats without any authentication. The users are able to access stations and measurements attributes (Tables 13 and 14). Table 13 – Pegelonline stations attributes.
Attribute uuid number shortname longname km agency longitude latitude water
Description unique ID immutable station number staltion name station name river kilometer water and shipping authority longitude in WGS84 decimal notation latitude in WGS84 decimal notation information about the water
The access to the stations can be done by using the station UUID, name and number, or even the water parameters. Special queries allow the access to the station considering a radius of (in km): a geographic location (coordinates in WGS84), a station name or within a given river name.
106
APPENDIX A. Implementation Details Table 14 – Pegelonline stations measurements attributes.
Attribute timestamp value trend stateMnwMhw and stateNswHsw
Description date encoded in ISO-8601 format as a decimal value expresses numerically, whether the value is a tendency to increase, falling or be constant the current water level either with the average lowest values (MNW) and the highest average values (MHW) in relation (stateMnwMhw) or the highest navigable water level (stateNswHsw)
The measurements are provided by using filtering based on either the timestamp (encoded as ISO-8601) or a station name. The measurements of the last 30 days can be gathered.
CEMADEN Web Service The National Center for Monitoring and Alerts Natural Disasters in Brazil (CEMADEN) Web service can be found by the following user friendly URL: http:// 150.163.255.240/ CEMADEN/ resources/ parceiros /[UF] /[T], where UF is the federal unit acronym of the State, the data will be gathered, and T represents the type of the desired data (pluviometer or hydrological). In this URL, the user can decide where and which data will be retrieved. An exemplary station measurement of the State of São Paulo is seen below. 1 { 2
"codestacao":"3456781A", "latitude":-14.231456, "longitude":-36.156784, "cidade":"BAURU", "nome":"Nac Unidas", "tipo":"Pluviometrica", "uf":"SP", "chuva":10.0, "nivel":null, "dataHora":"2015-10-09 14:00:00.0"
3 4 5 6 7 8 9 10 11 12 }
The station measurements structure is delivered as a JavaScript Object Notation (JSON) due to the lightness and ease use of its format. It contains ten fields, which are the following: the station code, the location (latitude and longitude) in decimal degrees, city name, station name, data type, UF acronym of the city, the rain gauge, the water level and the date time (UTC). The measurements are provided every 10 minutes if it is raining, otherwise every hour. The value contained in the water level takes into account a difference between the distance of the station installation to the measuring level, while the value contained in the rain gauge is calibrated to be the exactly data measured. If CEMADEN web service is working, only the
107
measurements from the last four hours can be accessed, otherwise only the measurements from the last three hours.
Sensor Observation Service Standard Interface A Sensor Observation Service (SOS) provides a standardizable interface to manage, recover and discover either near real-time or historical deployed sensor metadata and observations. SOS defines horizontally a common model for all domains that use sensors in such a way they can be grouped into several constellations (see Figure 26).
Figure 26 – Sensor Constellations (BRöRING; STASCH; ECHTERHOFF, 2012).
The specific details of each domain is encapsulated by some parameters of the SOS operations, which are used to promote the interaction between clients and a sensor observation repository. The clients can request sensor data by using Key Value Pairs (KVP), as well as HTTP GET and HTTP POST. The parameters of the SOS operations to comprise a sensor observation are: time (phenomenon and result time), procedure, observed properties, feature of interest and response format (result and unit of measure) (see Figure 27). The procedure is a computational unit that has performed the observation (e.g., procedure id equal to DAVIS_123). The feature of interest is a representation of a real-world phenomena that carries the property which is observed. It can reference a feature ID or a spatial constraint (e.g., a river or a sensor name). The observed property is a description of the property which is observed (e.g, wind speed). The result consists of the result value of the observation and its unit of measure (e.g. 23 m/s). The phenomenon time is timestamp that the event occurred (16.9.2010 13:45). Besides the above-mentioned parameters, an offerings is also important for observation since it aims to organize them without overlapping spatially or temporally. Each offering is used to characterize observations from specific: sensor(s), time period(s), phenomena, geographical region that contains sensors or observation features.
108
APPENDIX A. Implementation Details
Figure 27 – Observation components (BRöRING; STASCH; ECHTERHOFF, 2012).
An offering can be used to distinguish observations from different sensors that observe different properties. For example, if sensors are located at the same station, either they can have the same offering with the name of the station or can have an own offering with the name of each observed property. If they are located at different stations, they should have different offerings. If one sensor observes one property in different locations, then either they can have only one offering corresponding to the observed property or many offerings corresponding to the many locations. This helps to group observations with same offering id, although the new specification of SOS allows only one procedure per offering. All of these parameters are used in the SOS operations, which are categorized into four main groups: the core, the transactional, profile and extensions. The core contains the main operations and serves as a basis to the other groups. a) The core operations are: - DescribeSensor: used to request information about a certain sensor, encoded as a SensorML. It allows the query of sensor metadata available in the SOS repository. - GetCapabilities: used to request a self-service description, which provides metadata and detailed information about operations available for an SOS repository. - GetObservation: promotes access to the observations by using spatial, temporal and thematic filters. It is used to request raw sensor data, encoded as a Observations & Measurements 2.0 (O&M). b) The transactional extension contains the following operations:
109
- InsertSensor: it is used to register new sensors in the SOS repository. - UpdateSensorDescription: it is used to update the description of the sensors. - DeleteSensor: it is used to delete a registered sensor and all its observations from the SOS repository. - InsertObservation: it is used to insert observations from sensors into the SOS repository. c) The improved operations extension contains the following operations: - GetFeatureOfInterest: it is used to request a representation, encoded as a GML, the target feature observation (English, feature of interest) that the SOS offers. - GetObservationById: it is used to request the raw sensor data using observation identifier. In addition to these operations, the improved operations extension contains: a GetResult, a GetFeatureOfInterestTime, the DescribeFeatureOfInterest, the DescribeObservationType, and DescribeResultModel. d) The result handling extension contains the following operations: - InsertResultTemplate: it is used to insert a result model in an SOS server, which describes the structure of the values of a InsertResult at the request of a GetResult. This operation is required for later inserts the results of observations. - InsertResult: it is used to charge pure values according to defined structure and coding a request InsertResultTemplate. To perform this operation it is necessary that there is a model with the observation metadata on the server. - GetResultTemplate: it is used to capture the structure of the result returned. This operation is used after the invocation of the operation GetResult. - GetResult: it is used to capture results of observations without metadata information about the observations and results of the structure.
Adapters The adapters were built to ensure the correct matching between the heterogeneous data source and SOS. In this sense, the following SOS parameters will be filled out by the following PEGELEONLINE (Table 15) and CEMADEN (Table 16) parameters:
Dynamic Sensor Management The Dynamic Sensor Management was structured initially by defining the path for all the necessary components (repositories, observations, performance). Then, functions to update the
110
APPENDIX A. Implementation Details Table 15 – SOS parameters vs PEGELEONLINE stations measurements attributes.
SOS ProcedureID ParentProcedure LocationLongname LocationShortname Latitude Longitude ObservedProperty FeatureOfInterest OfferingID PhenomenonTime ResultTime Result ObservationID
PEGELEONLINE uuid PEGELONLINE longname shortname latitude longitude rain_gauge number ’offering’+uuid timestamp timestamp value uuid+timestamp
Table 16 – SOS parameters vs CEMADEN stations measurements attributes.
SOS ProcedureID ParentProcedure LocationLongname LocationShortname Latitude Longitude ObservedProperty FeatureOfInterest OfferingID PhenomenonTime ResultTime Result ObservationID
CEMADEN codestacao CEMADEN longname shortname latitude longitude tipo nome ’offering’+codestacao dataHora dataHora value uuid+dataHora
sensor measurements performance, to read and convert a wide variety of sensor data format (e.g., image to binary), and to publish them via HTTP POST into the SOS repository are parameterized. At first, the request HTTP POST is prepared. Then, the request body is retrieved from the input stream so that it can be buffered when its length is not specified. Both the content type and encoding are also specified when they are not explicitly provided. After that, the HTTP client is retrieved and executed into the SOS repository. If the request is an observation, its type is managed before both the execution and releasing of the current connection between the SOS repository and the client. The requests involve three SOS operations: publish observations, as well as register and update sensors. They are depicted in detail in the next subsections.
111
Register Sensors At a first moment, all the variables assigned to fields of the message protocol are initialized. After that the file of the SOS operation responsible for describing the sensor is read and each field of the message is assigned to the respective SOS parameter. 1 { 2
"request": "DescribeSensor", "service": "SOS", "version": "2.0.0", "procedure": "http://www.52north.org/test/procedure/11", "procedureDescriptionFormat": "http://www.opengis.net/sensorML/1.0.1"
3 4 5 6 7 }
In this case, the sensor is described using the procedure id as a parameter. After replacing the field procedure with the sensor id, the DescribeSensor operation is submitted to the SOS using an HTTP POST request. If the SOS responds the request successfully, then the SOS operation responsible for inserting new sensors is read and assigned to a variable within the execution program in case the sensor is not registered yet. 1 { 2 3 4 5 6
"request": "InsertSensor", "service": "SOS", "version": "2.0.0", "procedureDescriptionFormat": "http://www.opengis.net/sensorML/1.0.1", "procedureDescription": "< sml:Term definition=\"urn:ogc:def:identifier:OGC:1.0:uniqueID\">http:// www.52north.org/test/procedure/952North Initiative for Geospatial Open Source Software GmbH (http://52north.org)< sml:value>52North GmbH< swe:field name=\"Offering for sensor 9\">http://www.52north.org/test/offering/9http://www.52north.org/test/procedure/1http://www.52north.org/test/ featureOfInterest/97.65196881225419451.93510110010491652.0< sml:outputs>", "observableProperty": [ "http://www.52north.org/test/observableProperty/9_1" ], "observationType": [ "http://www.opengis.net/def/observationType/OGC-OM/2.0/OM_Measurement", "http://www.opengis.net/def/observationType/OGC-OM/2.0/OM_CategoryObservation", "http://www.opengis.net/def/observationType/OGC-OM/2.0/OM_CountObservation", "http://www.opengis.net/def/observationType/OGC-OM/2.0/OM_TextObservation", "http://www.opengis.net/def/observationType/OGC-OM/2.0/OM_TruthObservation", "http://www.opengis.net/def/observationType/OGC-OM/2.0/OM_GeometryObservation" ], "featureOfInterestType": "http://www.opengis.net/def/samplingFeatureType/OGC-OM/2.0/ SF_SamplingPoint"
7 8 9 10 11 12 13 14 15 16 17 18 19 }
The sensor is inserted using the parameters carried by the message forwarded by the adapter. At first, the SensorML is read and converted to a easier format so that the sensor_id, agency, sensor_name, sensor_place_name, location (latitude and longitude) can be inserted. Then, the observable properties and the feature of interest, as well as the new SensorML are published into the SOS using the InsertSensor operation.
Update Sensors After initializing all the variables necessary to update the sensors in the SOS, the sensor is updated using the parameters carried by the message forwarded by the adapter. Again, the sensor_id is used as a parameter to check if the sensor is already published. 1 { 2 3 4
"request": "UpdateSensorDescription", "service": "SOS", "version": "2.0.0",
113
5
"procedure": "http://www.52north.org/test/procedure/11", "procedureDescriptionFormat": "http://www.opengis.net/sensorML/1.0.1", "procedureDescription": "< sml:Term definition=\"urn:ogc:def:identifier:OGC:1.0:uniqueID\">http:// www.52north.org/test/procedure/952North Initiative for Geospatial Open Source Software GmbH (http://52north.org)< sml:value>52North GmbH< swe:field name=\"Offering for sensor 9\">http://www.52north.org/test/offering/9http://www.52north.org/test/procedure/1http://www.52north.org/test/ featureOfInterest/97.65196881225419451.93510110010491652.0< sml:outputs>"
6 7
8 }
Again, the SensorML is updated using the the sensor_id, agency, sensor_name, sensor_place_name, location (latitude and longitude) as a parameter within the UpdateSensorDescription operation. Then, the new information about an exiting sensor is published.
114
APPENDIX A. Implementation Details
Publish Observations At first, the variables assigned to each field of the protocol message are initialized. After that the file of the SOS operation responsible for getting the observation is read and assigned to a variable. 1 { 2
"request": "GetObservationById", "service": "SOS", "version": "2.0.0", "observation": "http://www.52north.org/test/observation/1"
3 4 5 6 }
In this operation, the observation is checked within the repository using the observation id as a parameter. After replacing the field observation with the sensor_id+timestamp, the GetObservationById operation is submitted to the SOS using an HTTP POST request. If the SOS responds to the request successfully, then the SOS operation responsible for inserting a new observation is read and assigned to a variable within the execution program. 1 { 2 3 4 5 6 7 8 9 10 11 12 13 14 15 16 17 18 19 20 21 22 23 24 25 26 27 28
"request": "InsertObservation", "service": "SOS", "version": "2.0.0", "offering": "http://www.52north.org/test/offering/19", "observation": { "identifier": { "value": "http://www.52north.org/test/observation/21", "codespace": "http://www.opengis.net/def/nil/OGC/0/unknown" }, "type": "http://www.opengis.net/def/observationType/OGC-OM/2.0/OM_Measurement", "procedure": "http://www.52north.org/test/procedure/19", "observedProperty": "http://www.52north.org/test/observableProperty/19_3", "featureOfInterest": { "identifier": { "value": "http://www.52north.org/test/featureOfInterest/19", "codespace": "http://www.opengis.net/def/nil/OGC/0/unknown" }, "name": [ { "value": "52 North", "codespace": "http://www.opengis.net/def/samplingFeatureType/OGC-OM/2.0/ SF_SamplingPoint" } ], "sampledFeature": [ "http://www.52north.org/test/featureOfInterest/19" ], "geometry": {
115
29
"type": "Point", "coordinates": [ 51.935101100104916, 7.651968812254194 ], "crs": { "type": "name", "properties": { "name": "EPSG:4326" } }
30 31 32 33 34 35 36 37 38 39 40
} }, "phenomenonTime": "2014-11-19T17:45:15+00:00", "resultTime": "2014-11-19T17:45:15+00:00", "result": { "uom": "test_unit_19_3", "value": 0.3 }
41 42 43 44 45 46 47 48
}
49 }
The observation is inserted using the parameters carried by the message forwarded by the adapter. At first, the Observation&Measurements is read and converted to a easier format so that the sensor_id, observed property, timestamp, unit of measure, value and sensor_place_name can be inserted. Then, the they are published into the SOS within the InsertObservation operation.
Flood Web Application Twitter Streaming API The Twitter Streaming API was implemented using JAVA and the twitter4j library. The implementation of the Streaming API helps to push tweets in a persistent manner with an open HTTP connection. It provides data with a low latency access and without overhead, but the library still requires the configuration by using a builder of its desired settings. Parsing, filtering and/or aggregation are possible processing steps before storing the tweets. In this project, only the geolocated tweets are considered. Since some tweets contain special characters, the parsing is performed to replace them in order to make easier to store the data into the database. Every time a tweet arrives, it is checked within the database whether it is already inside or not. This because due to the bounding box filtering, some tweets come repeatedly. The bounding box filtering has also some limitations. Small bounding box are more
116
APPENDIX A. Implementation Details
accurate than larger bounding box because only 1% of tweets are gathered by the streaming. However, it is only possible to add 25 bounding box per streaming, which makes complex the use of bounding box. For these reasons, the implementation of the bounding box for São Paulo and Germany were developed as described in the Listing below. 1 2 3 4 5 6 7 8 9 10 11 12 13 14 15 16 17 18 19 20 21 22 23 24 25 26 27 28 29 30 31 32 33 34 35 36 37 38 39 40
// calculating bounding box List rowList = new ArrayList(); double xmin = 4.50029, ymin = 47.191, xmax = 15.383, ymax = 54.9049; double xmin\_i, ymin\_i, xmax\_i, ymax\_i; for (int i=0; i