The House 2 green roof is physically similar to House 1, with vegetation representing 418 m2. (50% of total roof area) ..... Dewey, D., Johnson, P. and Kjelgren, R., 2004. Species ... Durhman, A.K., Rowe, D.B. and Rugh, C.L., 2007. Effect of ...
6R: A Look at Resilient Vegetation and Growing Media GROWING RESILIENCE: LONG-TERM PLANT DYNAMICS AND GREEN ROOF PERFORMANCE Stephanie Carlisle, Max Piana KieranTimberlake
Abstract The benefits of green roofs are derived from their existence as functional, living ecosystems. While the architectural elements of a green roof assembly can be thought of as fixed, the biological components of a roof, its vegetation and growing media, are dynamic. This study presents findings from two mature intensive green roofs surveyed six to seven years after installation in Ithaca, New York. While the two green roofs are located on buildings of similar design in close proximity, the roofs vary in initial planting, detailing, and biophysical and microclimatic conditions. Vegetative surveying was utilized to explore changes in plant community structure and establish spatially explicit performance indicators, including species richness, cover, and biodiversity. Additionally, this data was paired with modeling of solar radiation exposure, exploring how site context influences community dynamics.
Introduction Green roofs are complex dynamic systems capable of performing a wide range of ecosystem services—managing flows of water, energy, waste, nutrients and organisms—and demonstrating value over the lifetimes of the buildings on which they grow (26,39,43). As designers, landscape architects, engineers, building owners, and policy makers have become more aware of both the benefits of green roofs and the variability of project-specific returns, there has been an increased interest in the ability to assure the overall quality and performance of green roofs through the optimization of green roof assemblies and detailing (including plant selection, media mix design, trays, fabrics, drainage layers, irrigation techniques) (1,17,32). 1 CitiesAlive 11th Annual Green Roof and Wall Conference 2013 Conference Proceedings
For over a decade, researchers have approached green roofs as a “horticultural or engineering challenge” (10,33), and studies of green roof vegetation have primarily focused on short-term, controlled experiments evaluating single or limited species assemblies in replicated tray systems and small-scale deployments (13,21,29). While such research is empirically valuable, it is difficult to transfer the results of this research to practice. Green roofs installed on actual buildings bear little resemblance to the highly controlled and extensively maintained small-scale plots utilized by researchers, many of which are abandoned before plant communities are fully established (34). While green roofs are carefully engineered to function as high-performance infrastructural elements, they are also living systems. No matter how well a green roof is initially designed and specified, all living systems grow and change over time. Over the life cycle of a building, plants installed on a green roof become established, mature, die, and regenerate as the roof is exposed to disturbances. The environmental context and conditions on green roofs are also spatially and temporally variable. Solar radiation is rarely evenly distributed over a site. Surrounding built context changes as neighborhood and landscape elements grow. Climate varies from year to year. Even growing media and roof drainage are not perfectly stable over the life of a green roof installation. If such changes in green roof context and composition are inevitable, what is their effect on performance? Adopting an ecological perspective can provide insight into growth dynamics of these living systems over time. Even as an ecological perspective on green roofs has gained traction within the research community, our understanding of plant composition, functional diversity, and the long-term dynamics of green roof vegetation and resultant system function and performance is limited (7,33). Greenhouse studies reveal that plant composition affects different performance attributes, such as stormwater management (12,46), in controlled environments. However, efforts to accurately predict the performance of green roofs over a building’s lifetime are challenged by a lack of long-term data on real buildings, as well as a shortage of research on the long-term dynamics of green roof plant communities (7). Using the case study of two mature green roofs, each with more than five years of undisturbed growth, this study presents a unique opportunity to examine changes to vegetation communities, and the resilience of green roof communities. This research is part of a larger green roof monitoring agenda, from which a methodology has been established and applied to six roofs, ranging from two to ten years in age. The two roofs presented in this paper have been selected for comparison given their similarity in location and scale, but difference in initial plant composition. Within this context of understanding, the objectives of this study are threefold: 1) to describe the growth trajectories of two green roofs from establishment to maturity, 2) to establish a methodology for evaluating vegetative change and performance attributes, and 3) to discuss performance and resilience as they relate to species dynamics and the relationship between initial planting and emergent species. Ultimately, such an understanding of green roofs as adaptive, ecological systems will aid in predicting performance over time, and better inform the design and maintenance of resilient, high-performance roofscapes.
2 CitiesAlive 11th Annual Green Roof and Wall Conference 2013 Conference Proceedings
Study Site The two green roofs examined in this study are located on the Cornell University campus in Ithaca, New York, atop separate dormitory buildings: the Alice H. Cook House (House 1) and the Carl L. Becker House (House 2). The two roofs were constructed one year apart, in 2005 and 2006 respectively, while census of green roof vegetation was completed in August 2012. Ithaca, located in upstate New York, experiences a moderate continental climate, defined by warm, humid summers (average temperature July=20.4oC) and cold winters (average temperature January=-5.2oC) (31). The study area typically experiences 163-183 “freeze-free” days annually (8) and is located in a region that borders Plant Hardiness Zones 5b and 6a (41). Annual precipitation for the region is 93.98 cm and is distributed evenly over the year. During the summer of 2012, Ithaca experienced drought and historic temperature highs (31), conditions that are expected to have significantly impacted this study. The House 1 green roof is an intensive green roof system covering 329 m2 (47% of total roof area) divided by elevated skylights running east to west, which effectively establish four separate bays of vegetation. Originally planted with 16 species, the roof was designed to include a warm-season meadow mix of grasses and herbaceous forbs. The green roof has a total depth of 24.13 cm (including drainage layer) with approximately 20.32 cm of growing media, above a combination of Fabrene fabric, PVC membrane, and tapered rigid insulation. Two four-story dormitories to the north and south of the roof effectively “canyonize” the roof. The House 2 green roof is physically similar to House 1, with vegetation representing 418 m2 (50% of total roof area) divided by elevated skylights into four separate bays. Unlike House 1, this roof is an extensive green roof, originally designed to include only five species and to be primarily defined by three succulent plant species. The green roof features 12.70 cm of growing media on top of a sheet water retention layer and filter fabric. Adjacent buildings similarly canyonize the roof, reducing solar radiation and increasing shading from skylights. Unlike House 1, the eastern edge features a knee wall that acts as a significant wind block.
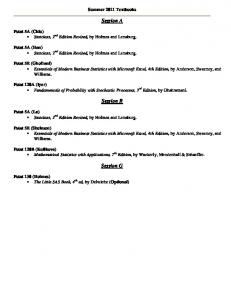
Figure 1 Research site. House 1 (left) is an intensive roof, and House 2 (right) is an extensive roof, both situated at Cornell University in Ithaca, New York. Campus image from Google Earth.
3 CitiesAlive 11th Annual Green Roof and Wall Conference 2013 Conference Proceedings
Methods To assess green roof plant dynamics and vegetative performance, this study utilizes a spatially explicit survey methodology of plant species and roof conditions. The study method is based on the comparison of annual surveys to the original green roof installation, creating snapshots of the vegetative composition and associated performance characteristics. Data Collection The field methodology utilized in this study is based on the Relevé Method (Table 2), the most accepted method for vegetative surveys in Europe and the United States (22,37,44). In the field, each roof was segmented into 2 m2 quadrants, and location and identity of plants were recorded through field diagrams of species footprints per quadrant. Quantitative analysis was captured and analyzed according to cover classes designated by the Braun-Blanquest cover/abundance scale (30,45), allowing the survey to accurately document growth and coverage by a mixture of plant types, including easily identifiable individuals and clonal species. Percent cover was recorded by calculating relative area occupied by the vertical projection of all aerial parts of plants, expressed as a percentage of the surface area of the sample plot at time of survey. Species names were identified and recorded for each plant species making up at least 5 percent of the cover in any one quadrant. Data Analysis Data from the surveys was assembled to identify roof composition and establish basic vegetation performance metrics. Analysis considered percent area of vegetative cover, plant type and species presence, distribution and sociability, species richness, and biodiversity. Vegetative cover, species richness, biodiversity, and sociability were computed across the entire roof as well as for each plot, allowing for a compiled plot-based view of the roof. Vegetative cover and sociability were considered at a species-specific level. Analysis of census results was primarily focused at a species-specific level, but also considered plant type and family. Plant type distribution for each roof was calculated for the original plant selection and the census results. Species were categorized into one of eight plant types, including Grasses, Herbaceous Forbs, Shrubs, Trees, Vines, Succulents, and Bryophytes, according to USDA Plant Database plant type designations. Plant life forms represent different resource use patterns, adaptations to the external environment, and life history strategies; such plant forms can be considered a coarse proxy for functional diversity within a plant community (25), a method previously used in green roof studies (27). Sociability is a plot scale measure of a species’ tendency to exclude other species and form large groups or patches, or conversely to integrate with neighboring species through distributed or less dense growth patterns (18). Sociability scores represent the percent coverage of a species when present in a plot, relative to other species within that same plot, such that the higher the sociability score, the more likely that species is to occur in homogenous patches. Species diversity was calculated using the Shannon Index (35) and converted to true diversity (TD=eShannon Index) (19). While precedent is limited, the Shannon Index has been used previously by researchers (2,3,20) as an indicator of relative biodiversity and recognized for its ability to allow for a summary and comparison of biodiversity over time or across multiple roofs (2). 4 CitiesAlive 11th Annual Green Roof and Wall Conference 2013 Conference Proceedings
In order to assess microclimatic conditions on the roof related to solar access, a 3-dimensional context model of the building site was created in Rhinoceros3D and used to calculate the shading conditions on a plot basis for each green roof. A custom Grasshopper plugin was developed to calculate the average hours of direct solar radiation per day across peak growing season (May 1-October 1) by determining on an hourly basis whether the sample plot is occluded by context geometry (adjacent buildings or skylights) from direct sunlight. The Grasshopper plugin utilizes NOAA’s solar angle calculator to determine solar angles appropriate for Ithaca, New York (42). Model results were averaged within each census plot and linearly regressed with plot-level vegetative cover and biodiversity scores using R software (38). A general comparison of House 1 and House 2 solar radiation was calculated with a one-way ANOVA test. Precedent for solar radiation studies on green roofs is limited (15) and often based on coarse regional data or even qualitative observation (9,24). Furthermore, while the consideration of variable light conditions in selection plants has emerged, the relationship between solar microclimates and compositional changes in rooftop vegetation have not been explored with rigor. The methodology utilized in this paper matches a resolution of analysis commonly employed in the design of other building elements, which has the potential to be extended to green roofs. Data Interpretation Data interpretation was achieved through traditional quantitative analysis and visually based diagramming of spatial relationships, at a species-specific or plot-level analysis. Survey notes were compiled and transcribed to produce a general map of the vegetative composition, as well as a plot-based map of the vegetation performance metrics (coverage, richness, diversity). The combination of quantitative and graphic processing of survey results allows one to observe plant community relationships over time and focus on specific zones or growth patterns that may not be apparent from numerical outputs alone. The ability to isolate discrete populations of plants— for example, by species, function group, or point of emergence—also provides a unique opportunity to examine changes in the roof system and begin a dialogue that considers resiliency and performance, from design intent to present day conditions. Results In the seven years since initial planting, House 1 has transitioned from a mixed meadow roof to a single-species dominated roof system, in which the designed planting zones have been obscured by the colonization of Schizachyrium scoparium. While the 2012 census results found the roof to include 39 distinct species, including 14 of the original 16 species, S. scoparium presently represents more than 55% of total vegetative coverage on the roof. Of the other originally planted species, none were found to contribute more than 5% to total roof vegetation. The second most abundant species was an emergent, Melilotus officinalis, which represented 13.76% of all vegetative cover at time of survey. Collectively, ruderal or emergent species represented 31.25% of all vegetative cover. As such, while the species richness of the roof has more than doubled, species biodiversity calculations reveal that, as a system, the House 1 green roof was less diverse in 2012 (True Diversity (TD) = 6.74) then at time of planting in 2005 (TD=8.67). Still, despite these dramatic changes in species representation, the roof maintains nearly full coverage (93%). 5 CitiesAlive 11th Annual Green Roof and Wall Conference 2013 Conference Proceedings
Figure 2 House 1 was initially planted with 16 species in three distinct zones (evergreen cover, low meadow, and high meadow). At the time of survey, 39 species were identified on the roof, including 14 of the original species.
Conversely, the dynamics of the House 2 green roof vegetation over the past seven years are defined by the resilience and persistence of designed planting zones, which have effectively supported increased diversity and ecological complexity across the roof. Originally planted with only five species (including three species of sedum, one warm season grass, and one herbaceous forb), the roof now features 65 distinct species, representing 30 plant families. The roof census reveals that sedum plantings still dominate the system and have maintained coverage in designated planting zones, but they have allowed for the integration of a variety of ruderal species, including forbs, shrubs, and trees, throughout the roof. The House 2 green roof exhibits nearly full coverage (95%), with multi-strata communities appearing as succulents that occupy area beneath emergent forbs and trees. Additionally, House 2 species diversity increased dramatically from original planting (TD=3.67) to 2012 (TD=14.80). Species diversity on House 2, while more evenly distributed across House 2 True Species Percent the roof, was found to be greater on the Diversity Presence Coverage southernmost bay (Bay 1=16.78 P Bay 1 16.78 31 99.68% value). Upon further investigation, this Bay 2 4.20 28 96.11% trend appears to be the result of microhabitat conditions associated in Bay 3 4.54 30 91.03% part with solar exposure and increase in Bay 4 5.54 24 86.88% shelter from the adjacent building. Note: Bays are numbered 1-4 from south to north.
6 CitiesAlive 11th Annual Green Roof and Wall Conference 2013 Conference Proceedings
Figure 3 House 2 was initially planted with five species (four succulents and one herbaceous forb). At the time of survey, 65 species were identified on the roof, including all five original species. Building House 1 House 2
Year 2005 2012 2006 2012
Percent Coverage NA 93% NA 95%
Species Richness 16 39 5 65
Plant Families 7 17 3 30
True Diversity (e 8.41 6.98 3.67 14.89
Shannon
)
Comparisons between the mapping of vegetative composition (species level) and vegetation performance metrics (percent coverage, species presence, and diversity) portray both roofs as diverse, heterogeneous landscapes. At a plot level, species richness and biodiversity were variable across both roofs (Fig. 4) with concentrated pockets of high diversity and richness. Floristic relationships and performance indicators may be the result of microhabitat heterogeneity related in part to the uneven distribution of resources (light, nutrients, and moisture) and the contribution of context features (adjacent buildings, skylights, and site walls) in mitigating disturbances by acting as wind breaks and shading devices. Mapping of performance measures pulls these features into focus, with areas of highest biodiversity, species richness, and percent cover occurring in bays closest to an adjacent building face (to the north and south of House 1, and to the south and west of House 2). At a smaller scale, the shading and thermal protection offered by the elevated skylights consistently produce a microhabitat zone capable of supporting a unique collection of emergent trees and herbaceous forbs not found in other areas of the roof. 7 CitiesAlive 11th Annual Green Roof and Wall Conference 2013 Conference Proceedings
Figure 4 Vegetative performance measures expressed across sample plots, summer 2012 survey.
Solar Analysis Microclimate analysis revealed that solar radiation for both houses is variable, as a result of neighboring buildings and elevated skylights. Comparatively, House 1 (Mean=10.18) receives more hours of sunlight than House 2 (Mean=7.48), F(1,209)=90.22, p=0.000. Qualitatively, it is readily apparent that in areas of greatest solar exposure (typically more than 10 hours per day), vegetative coverage and species diversity decrease for both House 1 and House 2. Given that previous studies have related moisture stress and solar exposure to plant performance broadly and specifically (10,15,28), it is not surprising that areas with greater solar access exhibited less plant diversity and lower vegetative coverage. House 2 regression analyses found increased solar exposure to negatively impact species diversity (R2=20.79, p