WATER RESOURCES RESEARCH, VOL. 47, W07601, doi:10.1029/2010WR009482, 2011
Shade estimation over streams using distributed temperature sensing A. C. Petrides,1 J. Huff,1 A. Arik,1 N. van de Giesen,2 A. M. Kennedy,3 C. K. Thomas,3 and J. S. Selker1 Received 26 April 2010; revised 8 April 2011; accepted 12 May 2011; published 13 July 2011.
[1] The characterization of temporal and spatial distribution of sunlight is essential for understanding energy transport in natural ecosystems. Fiber‐optic distributed temperature sensing (DTS) allows meter resolution measurements of temperature at subminute resolution. The difference in temperature due to absorption and reflection of a pair of helically twisted black and white fiber‐optic cables was measured with a DTS to document areas exposed to sunlight over the Walla Walla River. A high correlation (R2 = 0.99) was found between DTS‐based results and manual field observations of effective shade. These preliminary results provide proof of the concept that this method can be used for estimating the effective shade at fine spatial resolutions. Potential shortcomings and the need for a more quantitative physical model are suggested for further research. Citation: Petrides, A. C., J. Huff, A. Arik, N. van de Giesen, A. M. Kennedy, C. K. Thomas, and J. S. Selker (2011), Shade estimation over streams using distributed temperature sensing, Water Resour. Res., 47, W07601, doi:10.1029/2010WR009482.
1. Introduction [2] The use of distributed temperature sensing (DTS), with fiber‐optic cables to measure temperature with high spatial (1 m) and thermal (10 km), has created great potential to study environmental dynamics [Selker et al., 2006a]. DTS fiber optics recently have been used to study streams, wetlands, mine shafts, lakes, snowpacks and soil moisture [Selker et al., 2006b; Lowry et al., 2007; Moffett et al., 2008; Tyler et al., 2009; Sayde et al., 2010]. This note presents a proof‐of‐ concept of a technique to quantify meter‐by‐meter exposure to solar radiation using differences in temperature between white‐ and black‐jacketed fiber‐optic cables due to their difference in short‐wave albedo. [3] Effective shade is the percentage of the total solar radiation available above a canopy that does not reach the surface of interest. Effective shade is of great importance in stream temperature modeling since solar radiation represents the most significant input of energy [Ringold et al., 2003; Westhoff et al., 2007]. Several methods have been employed to measure effective shade over streams [see Boyd and Kasper, 2004]. Methods include manual delineation (e.g., Solar Pathfinder, Linden, Tennessee), analog recorders (e.g., Campbell‐Stokes Pattern Sunshine Recorder, NovaLynx, Grass Valley, California) as well as canopy closure using hemispherical canopy photography (e.g., WinScanopy, Regent Instruments, Canada). 1 Department of Biological and Ecological Engineering, Oregon State University, Corvallis, Oregon, USA. 2 Faculty of Civil Engineering and Geosciences, Delft University of Technology, Delft, Netherlands. 3 College of Oceanic and Atmospheric Sciences, Oregon State University, Corvallis, Oregon, USA.
Copyright 2011 by the American Geophysical Union. 0043‐1397/11/2010WR009482
[4] The aforementioned methods for estimating effective shade lack fine spatial resolution. They also provide static values rather than documenting time‐varying conditions. Effective solar radiation is not uniformly distributed in natural systems, particularly when most of the provided shade comes from vegetation. Effective shade changes during the day and across seasons because of changes in canopy closure, leaf area (e.g., deciduous trees), and solar angles. The objective of this paper is to demonstrate the feasibility of this approach to temporal delineation of solar radiation over river reaches.
2. Material and Methods [5] An experiment was conducted on the Walla Walla River (45°59′N, 118°22′W) as it passes through Milton Freewater, Oregon, a third‐order stream on the northeast side of the state. The stream has a well‐developed woody species riparian system with stream bank of about 2 m in height. These conditions generally lead to very low winds speeds above the stream. The average wind speed for the day was 1.4 m s−1. The near‐stream vegetation is mainly deciduous, with 5% of dry land bordering the river free of vegetation (large gravel bars), 10% grass and herbs, 20% shrubs, 65% trees. The dominant tree species are cottonwood, white alder and willow [U.S. Army Corp of Engineers, 2008]. Air temperatures were measured with fiber optics connected to a SensorTran model 5100 DTS controller (see http:// www.sensortran.com), recording for 24 h at 11 min and 0.5 m resolution. SensorTran reported a DTS accuracy of less than 0.25°C for a distance of 4 km and 0.5°C for a distance of 10 km, both being averaged over a 5 min time period. The fiber‐optic cable assembly consisted of two (one black and one white) 900 mm diameter subcables helically wound with 10 wraps per meter. The helical winding assured symmetric environmental conditions for the two subcables.
W07601
1 of 4
W07601
W07601
PETRIDES ET AL.: TECHNICAL NOTE
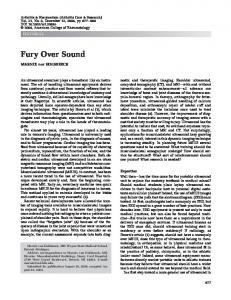
Figure 1. (a) Distribution of difference in temperature, averaged in time over 30 min (vertically) and averaged over 2 m in space (horizontally) on the Walla Walla River. (b) Effective shade along the river segment. Four single‐point measurements obtained manually with Solar Pathfinder are indicated. [6] Each subcable consisted of a sheathed multimode fiber (250 mm outer diameter elastomeric tight buffered 50/125 mm multimode graded index fiber) with an aramid strength member contained in a polyurethane outer jacket (part number: 56 AFL Telecommunications, Duncan, North Carolina) (Figure S1 in the auxiliary material).1 The installed cables were supported on 1 m tall “pigtailed” electric fence posts (Figure S2 in the auxiliary material). The posts were placed 20 m apart from each other in the center of the river. The actual height of the cables above the stream was on average 65 cm. During the experiment, the cables were severed by wildlife, shortening the original installation for the cable length from 1.2 km to 260 m. Solar radiation, reference air temperature, and wind data were obtained from a weather station of the Pacific Northwest Cooperative Agricultural Weather Network (AgriMet; http://www.usbr. gov/pn/agrimet) located approximately 1,600 m from the sampling site. This station is equipped with Air Temperature Thermistor Model 44030, YSI, Inc., Pyranometer Model LI‐200, Licor, Inc. and Wind Monitor Model 05103, R. M Young, Inc. For the first 260 m, four manual observations of effective shade were made with a Solar Pathfinder™ as single‐point measurements. The locations were chosen randomly and GPS surveyed with an average separation distance of 50 m along the river. The single‐point measurements were taken the same day that the DTS system was running. The Solar Pathfinder works by delineating the panoramic view in a convex plastic dome. The percentage of the available solar radiation is then calculated using a specific latitude sun path diagram for each month in the northern hemisphere. More information on the Pathfinder can be found at http://www.solarpathfinder.com. [7] Generally, DTS measurements require in situ calibration of offset, gain, and slope parameters. In this experiment, we were particularly concerned with the accuracy of 1 Auxiliary materials are available in the HTML. doi:10.1029/ 2010WR009482.
the differences in temperature between the white and black cables rather than absolute temperatures, thus precise offset values were not required. The global offset was computed on the basis of measurements of nighttime air temperature from nearby weather stations. For the purposes of this analysis, an area was considered to receive direct beam solar radiation when Solar radiation measured at the nearby weather station exceeded 100 W/m2. [8] First, the period of the day was established during which there was a difference between the black and white cables. In this case, this was the period between 8:00 and 16:00 on 16 September 2008. The minimum and maximum total (diffuse plus direct beam) solar radiation during this period was 194 and 704 W m−2, respectively. The average and standard deviation of temperature difference between the black and white cables was 0.39 and 0.45°C over the course of the daylight period. The white cable can become warmer than the black cable because of random noise of the DTS at low irradiances (200 m). The data provided at such fine resolution is useful for stream temperature modeling and other biological assessments. This work describes a proof of concept. One potential shortcoming of this method is its sensitivity to changes in wind speed along the fiber as it modulates the effective transfer coefficient of sensible heat to the air and thus the temperature difference between the fibers. However, solar radiation will be the dominant driver of temperature differences leading only to small uncertainty in estimation of effective shade. Further research and a more quantitative physical model are required to precisely esti-
mate these effects. In this experiment we selected the lightest weight cables available that could be employed, however, we are interested in determining the relationship between cable diameter and response to see if there may be an optimal geometry. Here, we employed helically wound cables, which had the advantage of simplicity of handling, and assurance that the cables were in identical locations, however, having the cables touch, and shade each other reduced the signal strength. The effect of having the black and white cables touching versus having an air gap separation deserves further study because of undetermined effects of heat transfer between the cables. Other areas of useful development would include the influence of cable composition and pigment; the effects of solar aging and the accumulation of particulate matter on the cables; and methods to enhance durability and reduced need for maintenance. For the foreseeable future, we believe that the method will require colocated wind, temperature, and solar radiation measurement at a minimum of one full‐sun location, and ideally at an additional full‐shade location. The method is not inexpensive, with the DTS unit costing >$20,000 and the cable about $2 m−1. Installation and operation are labor intensive at about one person day per 500 m. Also a continuous power supply is required. Finally, data analysis is involved and time consuming. In spite of the aforementioned research requirements, this method opens the potential for studies that could benefit from the measurement of effective shade at fine spatial resolutions. It should be noted that newer DTS equipment now can provide the level of precision obtained here in temperature integrating over 44 min every second and on 0.25 m resolution in place of the 2.0 m resolution obtained here (e.g., see http://CTEMPS.org), pointing out the rapid rate of improvement of performance in this quickly evolving branch of instrumentation. [13] Acknowledgments. This research was supported in part by the Walla Walla Watershed Council, the Oregon Watershed Enhancement Board, and the National Science Foundation (NSF EAR‐0711594). Field work at the Walla Walla site was provided by Troy Baker and Nella Parks.
3 of 4
W07601
PETRIDES ET AL.: TECHNICAL NOTE
References Boyd, M., and B. Kasper (2004), Analytical methods for dynamic open channel heat and mass transfer, methodology for HEATSOURCE model version 7.0, manual, Watershed Sci., Portland, Oreg. Lowry, C. S., J. Walker, R. Hunt, and M. Anderson (2007), Identifying spatial variability of groundwater discharge in a wetland stream using distributed temperature sensor, Water Resour. Res., 43, W10408, doi:10.1029/2007WR006145. Moffett, K. B., S. W. Tyler, T. Torgersen, M. Menon, J. S. Selker, and S. M. Gorelick (2008), Processes controlling the thermal regime of saltmarsh channel beds, Environ. Sci. Technol., 42, 671–676, doi:10.1021/ es071309m. Ringold, A. L., J. Van Sickle, K. Rasar, and J. Schacher (2003), Use of hemispheric imagery for estimating stream solar exposure, J. Am. Water Resour. Assoc., 39, 1373–1384, doi:10.1111/j.1752-1688.2003.tb04424.x. Sayde, C., C. Gregory, M. Gil‐Rodriguez, N. Tufillaro, S. Tyler, N. van de Giesen, M. English, R. Cuenca, and J. S. Selker (2010), Feasibility of soil moisture monitoring with heated fiber optics, Water Resour. Res., 46, W06201, doi:10.1029/2009WR007846. Selker, J., N. Van De Giesen, M. Wethoff, W. Luxemburg, and M. B. Parlange (2006a), Fiber optics opens window on stream dynamics, Geophys. Res. Lett., 33, L24401, doi:10.1029/2006GL027979. Selker, J. S., L. Thevenaz, H. Huwald, A. Mallet, W. Luxemburg, N. van de Giesen, M. Stejskal, J. Zeman, M. Westhoff, and M. B. Parlange (2006b),
W07601
Distributed fiber‐optic temperature sensing for hydrologic systems, Water Resour. Res., 42, W12202, doi:10.1029/2006WR005326. Tyler, S. W., J. S. Selker, M. B. Hausner, C. E. Hatch, T. Torgersen, C. E. Thodal, and S. G. Schladow (2009), Environmental temperature sensing using Raman spectra DTS fiber‐optic methods, Water Resour. Res., 45, W00D23, doi:10.1029/2008WR007052. U.S. Army Corp of Engineers (2008), Walla Walla River watershed study reconnaissance report, Walla Walla, Wash. [Available at http://www. nww.usace.army.mil/planning/er/studies/WWRBASIN/RECONRPT/ default.htm#2.05a.] Westhoff, M. C., H. H. G. Savenije, W. M. J. Luxemburg, G. S. Stelling, N. C. van de Giesen, J. S. Selker, L. Pfister, and S. Uhlenbrook (2007), A distributed stream temperature model using high resolution temperature observations, Hydrol. Earth Syst. Sci., 11, 1469–1480, doi:10.5194/ hess-11-1469-2007. A. Arik, J. Huff, A. C. Petrides, and J. S. Selker, Department of Biological and Ecological Engineering,116 Gilmore Hall, Oregon State University, Corvallis, OR 97331‐3906, USA. (
[email protected]) A. M. Kennedy and C. K. Thomas, College of Oceanic and Atmospheric Sciences, 104 COAS Admin Bldg., Oregon State University, Corvallis, OR 97331‐5503, USA. N. van de Giesen, Faculty of Civil Engineering and Geosciences, Delft University of Technology, PO Box 5048, NL‐2600 GA Delft, Netherlands.
4 of 4