Shear Resistance of Tire-Derived Aggregate Using Large-Scale Direct Shear Tests
Downloaded from ascelibrary.org by PENN STATE UNIV on 12/31/14. Copyright ASCE. For personal use only; all rights reserved.
Ming Xiao, M.ASCE 1; Martin Ledezma 2; and Corbin Hartman 3
Abstract: This paper presents a large-scale direct shear testing of tire-derived aggregate (TDA) of large sizes (25–75 mm). The objective of this research is to obtain and compare the shear resistances of large-sized TDA and TDA in contact with sand, concrete, and geosynthetics. TDAs are pieces of processed and shredded waste tires that can be used as lightweight and quick fills for embankments, subgrades, and retaining walls. A large-scale direct shear apparatus was designed and constructed. The shear box dimensions were 79 cm wide, 80 cm long, and 122 cm tall. The lower shear box was driven by a hydraulic piston, while the upper shear box remained stationary. The horizontal shear forces, shear displacements, and vertical forces were recorded by an automatic data acquisition system. Three normal loads were applied on the TDA to simulate overburden pressures of 24, 48, and 96 kPa (or 500, 1,000, and 2,000 lb=ft2 ). Duplicate tests were performed to verify the repeatability. The control tests using sand proved that the equipment could obtain comparable and slightly conservative shear strength. The Mohr-Coulomb failure criterion was used to obtain the cohesion (or adhesion) and friction angles of the TDA. The shear testing revealed the difference of failure mechanisms of TDA and sand. For TDA, no peak shear resistance was observed during the entire shearing, and shear resistance continued to increase until the test was terminated at sufficient shear displacement. Further analysis revealed that the shear strength parameters of TDA increase with shear deformation; this represents a challenge in selecting the design parameters of TDAs. The shear strengths of TDA and TDA in contact with other materials are dictated primarily by friction. The friction angles of TDA, TDA on sand, and TDA on concrete are very similar (in a range of 35–39°). DOI: 10.1061/(ASCE)MT.1943-5533.0001007. © 2014 American Society of Civil Engineers. Author keywords: Tire-derived aggregate (TDA); Shear strength; Large-scale direct shear test.
Introduction The U.S. Federal Highway Administration (FHWA) has estimated that approximately 280 million tires were discarded each year by American motorists, 40% of which were disposed in landfills, stockpiles, or illegal dumps (FHWA 1997). In California, for example, approximately 44.8 million reusable and waste tires were generated annually, with nearly 250,000 waste tires remaining in stockpiles throughout California (CalRecycle 2010). These stockpiles pose a potential threat to public health, safety, and environment. Tire shreds, also known as tire-derived aggregate (TDA), are pieces of processed and shredded waste tires that have a “basic geometrical shape and range between 2 in. (50 mm) and 12 in. (305 mm) in size and are intended for use in civil engineering applications” [ASTM D6270-08 (ASTM 2012)]. Some of the applications include lightweight and quick fills for embankments and subgrades and retaining wall backfills. Two types of TDA are commonly categorized in the practice: Type A, with a maximum size of 75 mm (3 in.), and Type B, with a maximum size of 305 mm (12 in.). TDA of different sizes has been widely studied as alternative backfills in the past 20 years, 1 Associate Professor, Dept. of Civil and Environmental Engineering, Pennsylvania State Univ., University Park, PA 16802 (corresponding author). E-mail:
[email protected] 2 Graduate Student, Dept. of Civil and Environmental Engineering, Pennsylvania State Univ., University Park, PA 16802. 3 Staff Engineer, LGC Geotech, San Clemente, CA 92672. Note. This manuscript was submitted on July 10, 2013; approved on December 16, 2013; published online on December 18, 2013. Discussion period open until December 8, 2014; separate discussions must be submitted for individual papers. This paper is part of the Journal of Materials in Civil Engineering, © ASCE, ISSN 0899-1561/04014110(8)/$25.00.
© ASCE
and a large body of literature is available (e.g., Humphrey and Manion 1992; Bosscher et al. 1992; Tweedie et al. 1998; Strenk et al. 2007; Tandon et al. 2007). These studies have expanded the knowledge on the mechanical characteristics and in situ performances of embankments and retaining walls using tire shreds or chips. In a recent study, Pando and Garcia (2011) summarized the shear strengths of tire crumbs (2–13 mm or 0.08–0.5 in.) under various confining pressures obtained by previous researchers. Moreover, they reported the ranges of effective cohesion (0–11.4 kPa) and effective friction angle (8.2–14.9°) of crumbs of maximum size of 4.5 mm (0.18 in.) at 20% strain when the material was subjected to confining pressures ranging from 25 to 100 kPa. A mixture of shredded tires and sand is another backfill alternative, and its static responses (stress, deformation, strength) have also been investigated (e.g., Tatlisoz et al. 1998; Bosscher et al. 1997; Lee et al. 1999; Wartman et al. 2007). Large-scale direct shear tests were also conducted on TDA and TDA–sand mixtures. Table 1 summarizes a few notable TDA shear testing studies in the literature. These studies provided comparable shear resistances of TDA of large sizes. Bernal et al. (1997) noted that the rubber–sand and tire shred specimens did not develop welldefined peak shear resistance within the allowable shear displacement of 6 cm. A shear device with larger dimension and larger displacement may provide a better understanding of the shear resistance developments of TDA of large sizes (25–75 mm) under a wide range of vertical overburden stresses (e.g., 20–100 kPa). Moreover, in civil engineering applications involving TDA, the TDA may be in contact with other civil engineering materials, such as soil, concrete, and geosynthetics. A comprehensive experimental study of the relative shear resistances of TDA and TDA with other materials may provide a useful reference for the practice. Therefore, the objective of this research is to obtain and compare the
04014110-1
J. Mater. Civ. Eng. 2015.27.
J. Mater. Civ. Eng.
100
Table 1. Summary of Previous Studies on Large-Scale Shear Testing of TDA
Downloaded from ascelibrary.org by PENN STATE UNIV on 12/31/14. Copyright ASCE. For personal use only; all rights reserved.
Shear box dimensions Total box height (cm) Maximum shear box displacement (cm) Shearing rate (mm= min) Maximum TDA size (cm) TDA density (kN=m3 ) Maximum normal pressure (kPa) Internal friction angle (deg) Apparent cohesion (kPa)
30 × 30 cm, square box 22.9 3.5
28 cm diameter 27.5 9.0
30 × 30 cm, square box 22.5 6.0
7.6 7.6 5.2–5.8 68 19–26 4.3–11.5
1.3 15 5.9 80 30 3
N/A 5 5.9 54 35 0
80 Percent Finer (%)
Test parameters and results
Humphrey Foose Bernal et al. (1993) et al. (1996) et al. (1997)
90 70 60 50 40 30 20 10 0 1000
1
100 10 Aggregate Size (mm)
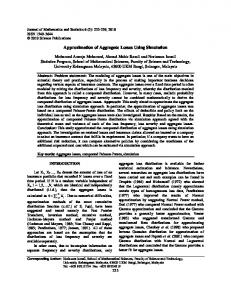
Fig. 2. TDA size distribution
Note: TDA = tire-derived aggregate; N/A = not available.
shear resistances of large-sized TDA and TDA in contact with sand, concrete, and geosynthetics using a large-scale shear testing device. The shear device can accommodate specimens that are 79 cm wide, 80 cm long, and 122 cm tall; the maximum horizontal shear displacement is 18 cm, and the vertical pressure can be up to 96 kPa.
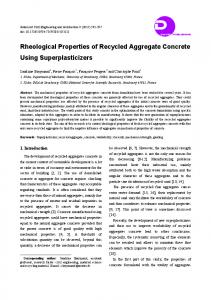
Materials, Experimental Setup, and Instrumentation Materials The TDA was provided by the California Dept. of Resources Recycling and Recovery (CalRecycle). Fig. 1 shows a photo of the TDA, and Fig. 2 shows the size distribution. The TDA was categorized as Type A. Two types of geosynthetics were tested: geotextile and geogrid. The geotextile was nonwoven and needlepunched. The geogrid was uniaxial (with design tensile strength in one direction only) and was obtained from Tensar International, which labeled the geogrid as LH800. It is a low-tensile-strength geogrid, with an ultimate tensile strength of 35 kN=m. The sand used in this research was a relatively uniform and clean sand, with a fine content of 0%, d10 ¼ 0.25 mm, d30 ¼ 0.45 mm, and d60 ¼ 0.80 mm. The concrete used in this study was made from QUIKRETE 5,000 Concrete Mix, which is a commercial-grade blend of stone, sand, and cement; its compressive strength reaches
24.1 MPa (3,500 psi) in 7 days and 34.5 MPa (5,000 psi) in 28 days. At least 28 days was allowed for the concrete slab to cure before it was used in the shear testing. Experimental Setup and Instrumentation The large-scale direct shear test equipment is shown in Fig. 3. The shear box is comprised of two half-boxes. Each box was 79 cm wide, 80 cm long, and 61 cm tall. The upper box was bolted on the frame of a compression rig and was stationary. The lower box had guide rails on its bottom; it was driven by a horizontal hydraulic piston and could slide smoothly in the horizontal direction. A constant horizontal displacement rate of 22 mm= min was used. It was the slowest displacement rate that the hydraulic pump for the piston could provide. This displacement rate was higher than those used in other shear testing in the literature (Humphrey et al. 1993; Foose et al. 1996; Bernal et al. 1997). It represents a quick shear failure. Each box was constructed using strong structural steel frame to withstand large vertical and horizontal loads. The walls of the shear box were made of 2.54 cm (1.0 in.) plywood to ensure no flexing of the sidewalls. Smooth plastic sheets were lined on the inside of the four walls of the shear boxes to reduce vertical friction, so that the entire normal force could be applied to the materials in the lower box. The vertical load was applied by a vertical hydraulic piston. The hydraulic jack was positioned on a concrete slab that
Fig. 1. Photo of TDA © ASCE
Fig. 3. Large-scale direct shear test device 04014110-2
J. Mater. Civ. Eng. 2015.27.
J. Mater. Civ. Eng.
Downloaded from ascelibrary.org by PENN STATE UNIV on 12/31/14. Copyright ASCE. For personal use only; all rights reserved.
(a)
(b)
Fig. 4. Shear box configurations before and after shear test
was used as a loading plate. The horizontal displacement of the lower box was driven by a horizontal hydraulic piston. The maximum horizontal displacement was 18 cm. A linear variable displacement transformer (LVDT) was connected between the fixed frame and the movable lower box to record the lateral displacements. A load cell was connected between the hydraulic piston and the steel frame of the lower box to measure the horizontal shear resistance force during a shear test. Another load cell was positioned between the vertical piston and the loading plate to measure the vertical overburden force. The LVDT and the two load cells were connected to a data acquisition system to automatically record the displacement, horizontal shear resistance force, and vertical overburden force during a shear test. The vertical displacement variation and possible dilation of the TDA during each shear test were not monitored.
Test Program and Procedures Six types of shear test were conducted.
Shear Testing of TDA on TDA
Equipment Verification Using Sand To verify that the large-scale direct shear device worked properly, control tests were first conducted using sand. To prevent the sand from falling out of the upper box when the two boxes were offset during shearing, a 20 cm wide angle iron flange was bolted to the side of the lower box, as shown in Fig. 4. The shear strength of sand was also obtained using the standard direct shear test according to ASTM D 3080-04 (ASTM 2004), “Standard Test Methods for Direct Shear Test of Soils under Consolidated Drained Conditions,” using the same compaction and moisture content. The specimen dimensions on the standard direct shear device were 5.9 cm diameter and 4.5 cm height. The standard shear testing of sand was done at two independent civil engineering consulting firms. The test procedure of large-scale shear testing of sand is as follows: 1. Align the lower and upper shear boxes, and lock the lower shear box. 2. Fill and compact sand in the lower box in three layers to reach a target dry density of 1,810 kg=m3 . The sand was moistened at 4% water content to facilitate compaction. When compacting the material in layers, it was ensured that the shear plane defined by the shear boxes was approximately in the middle of a compacted layer. If the shear plane coincided with an interface of two compacted layers, the obtained shear resistance would be lower and not representative. © ASCE
3. Fill and compact sand in the upper box the same way as in Step 2. 4. Load a reinforced concrete slab on the sand in the upper box, and position the load cell on the concrete slab and then the vertical hydraulic piston on the load cell. Power on the hydraulic ram to lower the piston to achieve the desired vertical pressure, and record the vertical deformation. The vertical pressure was maintained by the vertical hydraulic jack during testing. 5. Zero the readings of the horizontal load cell and the LVDT. 6. Unlock the lower shear box, and move the lower box at a constant displacement rate of 22 mm= min using the horizontal hydraulic jack. The horizontal resistance force, the horizontal displacement of the lower shear box, and the vertical force are automatically recorded by the data acquisition system. The data acquisition rate was approximately 40 readings=mm of horizontal displacement. During each shear testing, the actual vertical load was found to fluctuate around the targeted pressure, and the vertical hydraulic piston was manually adjusted to maintain the vertical pressure close to the targeted pressure. The fluctuation was small; the coefficient of variance of the vertical pressure ranged from 0.003 to 0.028 in the 36 largescale shear tests. When deriving the Mohr-Coulomb failure envelope, the arithmetic mean of the recorded vertical pressures in each test was used. 7. Notice the peak value of the horizontal force, and continue the test until the leveling-off of the shear resistance is observed or until the maximum shear displacement is reached. 8. After the test, lift the vertical piston and release the vertical pressure, return the lower box back to its original position, and remove the material in the boxes. 9. For each new shear test, the material is removed and recompacted. Three vertical pressures were used: 24, 48, and 96 kN=m2 (or 500, 1,000, and 2,000 lb=ft2 ). For each normal load, the shear resistance versus shear displacement relationship was plotted; the maximum shear resistance for each normal load was derived from the curve. Then the Mohr-Coulomb failure envelope was obtained.
The shear testing of TDA with TDA followed the same procedure for the shear testing of sand. The TDA was compacted dry in three layers in each box, with a target density of 673 kg=m3 per layer. After each shear test, the TDA in both shear boxes was removed; refilling and recompaction were done for each new test. Three vertical pressures were used: 24, 48, and 96 kN=m2 (or 500, 1,000, and 2,000 lb=ft2 ). The TDA compressed significantly under the vertical loads, and the density increased significantly. The final densities after the application of vertical loads are listed in Table 2. Shear Testing of TDA on Sand This configuration simulated the shear failure of TDA relative to sand for field applications where TDA is in direct contact with sand. The shear test followed the same procedure as in the testing of sand. The lower shear box was filled with sand and the upper shear box was filled with TDA, using the same compaction procedures. After each test, the TDA and sand in the shear boxes were removed and recompacted for a new test. Shear Testing of TDA on Concrete This configuration simulated the interface between TDA and concrete. The concrete slab was 79 cm long, 78 cm wide, and 15 cm thick. The slab was carefully positioned on modular concrete
04014110-3
J. Mater. Civ. Eng. 2015.27.
J. Mater. Civ. Eng.
Downloaded from ascelibrary.org by PENN STATE UNIV on 12/31/14. Copyright ASCE. For personal use only; all rights reserved.
Fig. 5. Configuration of shear boxes for TDA on concrete
blocks in the lower shear box. It was ensured that the slab was against one side of the shear box and did not slide during the test. The modular blocks were used so that the lower box did not need to be filled entirely with concrete. The top surface of the slab flushed with the top of the lower shear box. Fig. 5 shows the shear box configuration at the end of a shear test. The compaction of the TDA in the upper shear box followed the same procedure as in the shear testing of TDA. After each shear test, the TDA in the upper shear box was removed, the concrete slab was cleaned, and the TDA was recompacted in the upper shear box. Shear Testing of TDA on Geogrid The geogrid laid flat on the concrete slab in the lower shear box. Fig. 6 shows how the geogrid was tightly anchored at the back side of the lower shear box at the end of a shear test. In To provide evenly distributed anchoring without causing local stress concentration in the geogrid during shearing, a steel bar waved through the geogrid webs and was fixed to the lower box; large C-clamps were also used to anchor the geogrid on the edges. The geogrid did not slide during testing. In this particular test, the objective was to determine the shear resistance only between the TDA and the geogrid. Since the geogrid had openings and TDA could penetrate through the openings and be in contact with the underlying concrete slab that was used to support the geogrid, the shear resistance was contributed by both the geogrid and the underlying concrete, and the results became less conservative. To eliminate friction between the TDA and the concrete, a smooth and thin Plexiglas sheet was fixed on top of the concrete slab, and the geogrid was fixed on the Plexiglas sheet. It was assumed that the shear resistance between
Fig. 7. Anchorage of geotextile to lower shear box
the TDA and the Plexiglas sheet was negligible. The compaction of the TDA in the upper shear box followed the same procedure as in the shear tests on TDA alone. After each shear test, the TDA was removed, the tested geogrid was removed, and a new geogrid was placed for a new test. Shear Testing of TDA on Geotextile The test configuration was similar to that of TDA on a geogrid. The geotextile was tightly wrapped around a wood block and the block was C-clamped to the lower shear box. Fig. 7 shows the anchorage of the geotextile at the front of the shear box before filling the TDA. The geotextile did not slide during the shear test. After each test, the TDA was removed, the tested geotextile was removed, and a new geotextile was placed for a new test.
Results and Discussion Equipment Verification Using Sand Mohr-Coulomb failure envelopes of sand were derived from the large-scale shear test. Duplicate tests were conducted. The results are shown in Fig. 8 and proved to be qualitatively reproducible. The Mohr-Coulomb failure envelopes were obtained from shear stress versus shear displacement relationships. Due to the good reproducibility, only the shear stress versus shear displacement curves from
Fig. 6. Anchorage of geogrid to lower shear box © ASCE
Fig. 8. Failure envelopes of sand from large-scale shear testing 04014110-4
J. Mater. Civ. Eng. 2015.27.
J. Mater. Civ. Eng.
Fig. 10. Failure envelopes of TDA
Downloaded from ascelibrary.org by PENN STATE UNIV on 12/31/14. Copyright ASCE. For personal use only; all rights reserved.
Fig. 9. Shear stress versus displacement relationships of sand
Table 2. Density of TDA under Vertical Loads Vertical pressure (kN=m2 ) Density (kg=m3 )
0 673
24 807
48 1,131
96 1,352
one set of tests are shown in Fig. 9. The three curves are labeled with their respective normal stresses. The results from the largescale shear tests and the standard direct shear tests are summarized in Table 3. Although the cohesion obtained from the large-scale shear test (8.87 kPa or 185 lb=ft2 ) is approximately five times the cohesion obtained from the standard shear testing (1.67 kPa or 35 lb=ft2 ), both cohesion values are very small; therefore, the friction angle governs shear strength. Table 3 shows that the large-scale shear tests provided comparable and slightly lower (conservative) value for internal friction angle. Shear Testing of TDA on TDA Fig. 10 shows the shear failure envelopes of TDA. Duplicate tests were conducted, and the results showed good repeatability. The failure envelopes were obtained from the shear stress versus shear displacement relationships. Due to the good repeatability, only the shear stress versus displacement relationships from one set of shear tests are shown in Fig. 11. No apparent peak shear resistance was observed during the entire test, and shear resistance continued to increase until the test was terminated. The highest shear stress under each normal load was used as the failure shear stress, i.e., shear strength. The shear failure envelopes in Fig. 10 yielded an average apparent TDA cohesion of 14.3 kPa and an average TDA internal friction angle of 36.1°. The apparent cohesion of TDA was due to the interlocking of the shredded tire pieces.
Fig. 11. Shear stress versus displacement relationships of TDA
shear displacement relationships. Due to the good repeatability, only the shear stress versus displacement relationships from one set of shear tests are shown (Fig. 13). Fig. 12 gives the average adhesion of TDA on sand as 6.6 kPa and the average external friction angle of TDA on sand as 39.3°. Shear Testing of TDA on Concrete Fig. 14 shows the failure envelopes of duplicate shear tests of TDA on concrete. The test results also revealed good repeatability. The failure envelopes were obtained from the shear stress versus shear displacement relationships. Due to the good repeatability, only the shear stress versus displacement relationships from one set of shear tests are shown (Fig. 15). Fig. 14 shows the average adhesion of TDA on concrete as 6.3 kPa and the average external friction angle of TDA on concrete as 35.5°.
Shear Testing of TDA on Sand Fig. 12 shows the failure envelopes of duplicate shear tests of TDA on sand. The duplicate test results also revealed good repeatability. The failure envelopes were obtained from the shear stress versus Table 3. Shear Strengths of Sand Obtained from Large-Scale and Standard Direct Shear Tests
Strength parameter c (kPa) ϕ (deg) Average c (kPa) Average ϕ (deg) © ASCE
Large-scale direct shear tests
Standard direct shear tests
Test 1
Test 2
Test 1
Test 2
11.30 36.5
6.44 39.5
0.95 44
2.39 43
8.87 38.0
1.67 43.5
Fig. 12. Failure envelopes of TDA on sand 04014110-5
J. Mater. Civ. Eng. 2015.27.
J. Mater. Civ. Eng.
Shear Testing of TDA on Geogrid
Downloaded from ascelibrary.org by PENN STATE UNIV on 12/31/14. Copyright ASCE. For personal use only; all rights reserved.
Fig. 13. Shear stress versus displacement relationships of TDA on sand
The geogrid was anchored and was not allowed to slide; only the TDA slid on top of the geogrid. Fig. 16 shows the typical geogrid conditions before and after a shear test; the TDA twisted and broke a few webs in the transvers direction of the geogrid; the major webs in the longitudinal direction were not damaged. Fig. 17 shows the failure envelopes of duplicate shear tests of TDA on a geogrid. The results also revealed fair repeatability. The failure envelopes were obtained from the shear stress versus shear displacement relationships (Fig. 18) from one set of shear tests. The shear testing revealed an average adhesion of TDA on geogrid of 13.7 kPa and an average external friction angle of TDA on geogrid of 18.8°. Shear Testing of TDA on Geotextile The behavior of TDA shearing on a geotextile is similar to that on a geogrid. The geotextile was not allowed to move. Except for surficial scratches, no major damage to the geotextile was observed in all the shear tests. Fig. 19 shows the failure envelopes of duplicate shear tests of TDA on geotextile. The results also showed fair repeatability. The failure envelopes were obtained from the shear stress versus shear displacement relationships, as shown in Fig. 20, from one set of shear tests. The shear testing revealed an average adhesion of TDA on geotextile of 4.9 kPa and an average external friction angle of TDA on geotextile of 33.6°. Results Comparison and Discussion
Fig. 14. Failure envelopes of TDA on concrete
The difference in failure mechanisms of TDA and sand can be seen in the shear resistance versus shear displacement curves in Figs. 9
Fig. 15. Shear stress versus displacement relationships of TDA on concrete
Fig. 17. Failure envelopes of TDA on geogrid
Fig. 16. Geogrid conditions in TDA shear testing: (a) before shear test; (b) after shear test © ASCE
04014110-6
J. Mater. Civ. Eng. 2015.27.
J. Mater. Civ. Eng.
Downloaded from ascelibrary.org by PENN STATE UNIV on 12/31/14. Copyright ASCE. For personal use only; all rights reserved.
Fig. 18. Shear stress versus displacement relationships of TDA on geogrid
Fig. 21. Failure envelopes of TDA with different shear deformations that are regarded as shear failure
Table 4. Summary of Shear Strengths of TDA Shear interface Cohesion/adhesion (kPa) Friction angle (deg)
Fig. 19. Failure envelopes of TDA on geotextile
Fig. 20. Shear stress versus displacement relationships of TDA on geotextile
(for sand) and 11 (for TDA). For sand, peak shear resistances developed under the three normal pressures (24, 48, and 96 kPa), and the peak developed earlier under a smaller normal pressure. For TDA, no peak shear resistance was observed during the entire shearing, and the shear resistance continued to increase until the test was terminated at the allowed maximum shear displacement; the tendency to reach a peak was less obvious under a higher normal pressure. The authors suggest that when evaluating the stability of structures that use TDA, failure criteria should be based on deformation rather than strength. Currently, there is no general consensus as to which shear deformation (or strain) should be used to derive the shear strength parameters of TDA. To illustrate the varying relationship between shear strength and shear deformation of TDA, Mohr-Coulomb failure envelopes were developed using 5 and 10 cm and a maximum deformation (approximately © ASCE
TDA on TDA on TDA on TDA on TDA on TDA sand concrete geogrid geotextile 14.3 36.1
6.6 39.3
6.3 35.5
13.7 18.8
4.9 33.6
16.2 cm) as failure points (Fig. 21). Fig. 21 shows that the shear strength parameters increase with shear deformation. The figure illustrates the challenge of selecting TDA design parameters. The shear strength parameters of TDA in contact with various materials are summarized in Table 4. The cohesion or adhesion values are all less than 15 kPa and are very small; thus, the shear strengths of TDA and TDA in contact with other materials are primarily dictated by friction. The friction angles of TDA, TDA on sand, and TDA on concrete are very similar, despite their different interfaces. The friction angle of TDA on a geogrid is significantly lower than that of others because of the smooth surface of the geogrid. This low friction angle was obtained when TDA was not allowed to penetrate the openings of the geogrid and lock the geogrid. In practice, TDA can penetrate a geogrid and interact with the underlying materials (such as TDA, soil, or concrete), and the friction angle in field situations can be much higher. This study only evaluated the pure interaction of TDA with geogrids. The shear failure mechanisms of TDA and TDA on sand, concrete, and geosynthetics are different from that of soils, which usually demonstrate peak and residual shear strengths. TDA did not experience a sudden rupture or slide during shearing. Instead, the shear resistance of TDA continued to increase with shear deformation until the maximum shear resistance was reached; after that, the maximum shear resistance was maintained with further shear deformation. For practical applications, the Mohr-Coulomb failure criterion was borrowed to derive cohesion (or adhesion) and internal (or external) friction angles for TDA. The Mohr-Coulomb failure criterion describes the elastic-plastic shear behavior of soils. Whether it can accurately account for the shear failure mechanism of TDA needs further investigation.
Conclusions This paper presents a large-scale shear test of large-sized (25– 75 mm) TDA. The control tests using sand proved that large-scale direct test equipment could obtain a comparable and slightly conservative shear strength. The shear testing revealed the difference in failure mechanisms of TDA and sand. For TDA, no peak shear resistance was observed during the entire shearing, and shear resistance continued to increase until the test was terminated at the
04014110-7
J. Mater. Civ. Eng. 2015.27.
J. Mater. Civ. Eng.
maximum shear displacement used in this study (approximately 17 cm). Further analysis revealed that the shear strength parameters of TDA increase with shear deformation; this represents a challenge in selecting the design parameters of TDA. The shear strengths of TDA and TDA in contact with other materials are dictated primarily by friction. The friction angles of TDA, TDA on sand, and TDA on concrete are very similar (in a range of 35–39°), even though the three interfaces are quite different. The friction angle of TDA on a geogrid is significantly lower than that with geotextile because of the smooth surface of geogrids.
Downloaded from ascelibrary.org by PENN STATE UNIV on 12/31/14. Copyright ASCE. For personal use only; all rights reserved.
Acknowledgments This research was funded by the California Dept. of Resources Recycling and Recovery (CalRecycle). The authors appreciate the support of Steve Scherer and Derick Gangbin, research technicians in the Lyles College of Engineering at California State University– Fresno, who helped design and build the shear testing equipment. Willie Liew of Tensar International helped provide the geogrid.
References ASTM. (2004). “Standard test methods for direct shear test of soils under consolidated drained conditions.” ASTM D 3080-04, Vol. 08.04, ASTM International, West Conshohocken, PA. ASTM. (2012). “Standard Practice for Use of Scrap Tires in Civil Engineering Applications.” ASTM D6270-08, Vol. 11.04, ASTM International, West Conshohocken, PA. Bernal, A., Salgado, R., Swan, R., and Lovell, C. (1997). “Interaction between tire shreds, rubber-sand, and geosynthetics.” Geosynthetics Int., 4(6), 623–643. Bosscher, P. J., Edil, T. B., and Eldin, N. N. (1992). “Construction and performance of a shredded waste tire test embankment.” Transportation Research Record 1345, Transportation Research Board, Washington, DC, 44–52. Bosscher, P. J., Edil, T. B., and Kuraoka, S. (1997). “Design of highway embankments using tire chips.” J. Geotech. Geoenviron. Eng., 10.1061/ (ASCE)1090-0241(1997)123:4(295), 295–304.
© ASCE
CalRecycle. (2010). “Tire management.” 〈http://www.calrecycle.ca.gov/ tires/〉 (Feb. 18, 2011). Federal Highway Administration (FHWA). (1997). “User guidelines for waste and byproduct materials in pavement construction.” FHWARD-97-148, U.S. Department of Transportation, Washington, DC. Foose, G. J., Benson, G. H., and Bosscher, P. J. (1996). “Sand reinforced with shredded waste tires.” J. Geotech. Eng., 10.1061/(ASCE)07339410(1996)122:9(760), 760–767. Humphrey, D., Sandford, T., Cribbs, M., and Manion, W. (1993). “Shear strength and compressibility of tire chips for use as retaining wall backfill.” Transportation Research Record 1422, Vol. 1422, Transportation Research Board, Washington, DC, 29–35. Humphrey, D. N., and Manion, W. P. (1992). “Properties of tire chips for lightweight fill.” Proc., Conf. on Grouting, Soil Improvement, and Geosynthetics, ASCE, Reston, VA, 1344–1355. Lee, J. H., Salgado, R., Bernal, A., and Lovell, C. W. (1999). “Shredded tires and rubber-sand as lightweight backfill.” J. Geotech. Geoenviron. Eng., 10.1061/(ASCE)1090-0241(1999)125:2(132), 132–141. Pando, M., and Garcia, M. (2011). “Tire derived aggregates as a sustainable backfill or inclusion for retaining walls and bridge abutments.” Proc., 6th Geo3T2 Conf. and Expo, North Carolina Dept. of Transportation, Raleigh, NC. Strenk, P. M., Wartman, J., Grubb, D. G., Humphrey, D. N., and Natale, M. F. (2007). “Variability and scale-dependency of tire-derived aggregate.” J. Mater. Civ. Eng., 10.1061/(ASCE)0899-1561(2007)19:3(233), 233–241. Tandon, V., Velazco, D. A., Nazarian, S., and Picornell, M. (2007). “Performance monitoring of embankments containing tire chips: Case study.” J. Perform. Constr. Facil., 10.1061/(ASCE)0887-3828(2007) 21:3(207), 207–214. Tatlisoz, N., Edil, T. B., and Benson, C. H. (1998). “Interaction between reinforcing geosynthetics and soil-tire mixtures.” J. Geotech. Geoenviron. Eng., 10.1061/(ASCE)1090-0241(1998)124:11(1109), 1109–1119. Tweedie, J. J., Humphrey, D. N., and Sandford, T. C. (1998). “Tire shreds as lightweight retaining wall backfill: active contidions.” J. Geotech. Geoenviron. Eng., 10.1061/(ASCE)1090-0241(1998)124:11(1061), 1061–1070. Wartman, J., Natale, M. F., and Strenk, P. M. (2007). “Immediate and time-dependent compression of tire derived aggregate.” J. Geotech. Geoenviron. Eng., 10.1061/(ASCE)1090-0241(2007)133:3(245), 245–256.
04014110-8
J. Mater. Civ. Eng. 2015.27.
J. Mater. Civ. Eng.