September 2000
•
NREL/CP-500-29155
Short-Term Output Variations in Wind Farms— Implications for Ancillary Services in the United States Preprint J. Cadogan U.S. Department of Energy
M. Milligan and Y. Wan National Renewable Energy Laboratory
B. Kirby Oak Ridge National Laboratory
Presented at the Wind Power for the 21st Century Conference Kassel, Germany September 26–28, 2000
National Renewable Energy Laboratory 1617 Cole Boulevard Golden, Colorado 80401-3393 NREL is a U.S. Department of Energy Laboratory Operated by Midwest Research Institute • Battelle • Bechtel Contract No. DE-AC36-99-GO10337
NOTICE The submitted manuscript has been offered by an employee of the Midwest Research Institute (MRI), a contractor of the US Government under Contract No. DE-AC36-99GO10337. Accordingly, the US Government and MRI retain a nonexclusive royalty-free license to publish or reproduce the published form of this contribution, or allow others to do so, for US Government purposes. This report was prepared as an account of work sponsored by an agency of the United States government. Neither the United States government nor any agency thereof, nor any of their employees, makes any warranty, express or implied, or assumes any legal liability or responsibility for the accuracy, completeness, or usefulness of any information, apparatus, product, or process disclosed, or represents that its use would not infringe privately owned rights. Reference herein to any specific commercial product, process, or service by trade name, trademark, manufacturer, or otherwise does not necessarily constitute or imply its endorsement, recommendation, or favoring by the United States government or any agency thereof. The views and opinions of authors expressed herein do not necessarily state or reflect those of the United States government or any agency thereof. Available electronically at http://www.osti.gov/bridge
Available for a processing fee to U.S. Department of Energy and its contractors, in paper, from: U.S. Department of Energy Office of Scientific and Technical Information P.O. Box 62 Oak Ridge, TN 37831-0062 phone: 865.576.8401 fax: 865.576.5728 email:
[email protected] Available for sale to the public, in paper, from: U.S. Department of Commerce National Technical Information Service 5285 Port Royal Road Springfield, VA 22161 phone: 800.553.6847 fax: 703.605.6900 email:
[email protected] online ordering: http://www.ntis.gov/ordering.htm
Printed on paper containing at least 50% wastepaper, including 20% postconsumer waste
SHORT-TERM OUTPUT VARIATIONS IN WIND FARMS—IMPLICATIONS FOR ANCILLARY SERVICES IN THE UNITED STATES J. Cadogan United States Department of Energy 1000 Independence Avenue, S.W., Washington, D.C. 20585 Phone: 202-586-1991 Fax: 202-586-5124
[email protected] M. Milligan and Y. Wan National Renewable Energy Laboratory 1617 Cole Boulevard, Golden, Colorado 80401 Phone: 303-384-6927, Fax: 303-384-6999
[email protected] B. Kirby Oak Ridge National Laboratory P.O. Box 2008, MS6070, Oak Ridge, Tennessee 37831 Phone: 865-576-1768, Fax: 865-574-5227
[email protected]
ABSTRACT: With the advent of competition in the electric power marketplace, this paper reviews changes that affect wind and other renewable energy technologies, and discusses the role of federal and state policies in the recent wind installations in the United States. In particular, it reviews the implications of ancillary service requirements on a wind farm and presents initial operating results of monitoring one Midwest wind farm. Under federal energy policy, each generator must purchase, or otherwise provide for, ancillary services, such as dispatch, regulation, operation reserve, voltage regulation, and scheduling required to move power to load. As a renewable technology that depends on the forces of nature, short-term output variations are inherently greater for a wind farm than for a gas-fired combined cycle or a supercritical coal-fired unit. Keywords: Wind Energy - 1; Ancillary Services - 2; Renewable Energy - 3 1. INTRODUCTION The first significant market penetration for wind power occurred in California in the 1980s with the confluence of federal and state tax incentives, excellent wind resources, and favorable power purchase agreements. Wind development in California (and elsewhere) slowed, however, when the federal tax credit for wind expired in 1985, fossil energy prices plummeted, and states and electric utilities turned to competitive bidding to procure new power capacity. Today, about 1600 megawatts (MW) of wind capacity is installed in California, and 675 MW of new wind capacity is expected in Texas by the end of 2001. Figure 1 shows anticipated wind capacity in the United States by the end of next year. In the 1990s, as earlier federal and state policies expired or were scaled back, new policy mechanisms emerged. The Energy Policy Act of 1992 (EPACT), for example, provided an inflation-adjusted 1.5 cent per kilowatt-hour (kWh) production tax credit for wind energy and closed-loop biomass systems. A handful of states also passed legislation requiring electric utilities to develop or buy renewable energy. In Iowa, after years of legal and political battles, two electric utilities are buying power from 250 MW of wind projects developed in 1999. In Minnesota, Northern States Power Co. (NSP—now known as Xcel Energy) is required to purchase power from 425 MW of wind, and 400 MW of additional wind power capacity is under consideration, because of a 1994 state law that allows NSP to store spent fuel in dry casks at the Prairie Island nuclear plant.
1
Washington 215.0
Montana 0.1
Oregon 149.7 Wyoming 100.6
Utah 0.2
North Dakota Minnesota 0.5 355.5
California 2059.1
Maine 26.2
Vermont 11.0 New York 108.3 Michigan 0.6
New Hampshire 0.1 Massachusetts 7.8
South Dakota 0.8
Nebraska 2.8 Colorado 56.6
Wisconsin 52.7
Iowa 242.5
Pennsylvania 70.5
Illinois 30.0
Kansas 1.5
West Virginia 75.0 Tennessee 2.0
New Mexico 0.7
Texas 381.9 Alaska 0.9 Hawaii 41.3
3,994 MW as of 12/31/01
Updated 7/31/00
Figure 1. U.S. Wind Power - Expected by end of 2001 (MW).
Two new leading state policies include the renewables portfolio standards (RPS) and the system benefits charges (SBC). The RPS requires retail electric power suppliers to purchase a percentage of their electricity sales from renewables. To add flexibility in meeting the purchase requirement, individual obligations can be traded through a system of renewable energy credits. SBCs are typically volumetric fees, such as a cents per kWh adder, imposed on all electricity users through their electric rates. Of the 25 states that have firm electric restructuring plans, 17 have enacted either an RPS or SBCs or both. California recently extended its $135 million/year SBC for renewables—the largest and perhaps most ambitious SBC requirement—for 10 years. In addition to public policy mechanisms, customer choice in electricity supply is allowing individual customers to help support wind power development. Both regulated utility green pricing and green power marketing programs allow customers to choose renewable energy supplies. More than 60 green pricing programs offered by regulated utilities have led to over 60 MW of wind development. Meanwhile, the green marketing programs offered in at least seven states have provided at least 40 MW of new wind power development and are providing a stimulus for wind development in the northeastern United States for the first time. These public policy and market drivers helped lead to the development of 1000 MW of new wind projects and 200 MW of repowered projects in 1998 and 1999. This growth trend is expected to continue, with perhaps as much as 2000 additional MW of new wind capacity in 2000 and 2001, resulting from the pending expiration of the production tax credit at the end of 2001. In recognition of the recent progress made in wind energy technology and development, and to further encourage the technology's progress, Secretary of Energy Bill Richardson announced the Wind Powering America initiative in June 1999. This federal initiative recognizes that wind energy is closer
2
to becoming cost competitive, that it provides rural economic benefits, and that it has a place in the national energy portfolio. The initiative established three goals: 1) provide 5% or 80,000 MW of the nation's electricity with wind power by 2020, 2) double the states with 20 MW or more of wind capacity to 16 states by 2005, and triple it to 24 states by 2010, and 3) provide 5% (1000 MW) of federal electricity use with wind energy by 2010. Although such aggressive targets may seem a stretch from today's roughly 2500 MW capacity, the United States has substantial on-shore wind resources, the cost of the technology is expected to decline while its performance increases, and wind development—when properly sited—is compatible with the environment, leaving much of the land spanned by turbines available for farming, ranching, and other uses. While the details of the program will be determined by members in each region, the Department of Energy will provide resources to leverage interest, demonstrate federal leadership through the purchase of green energy, provide the proper policy environment, and coordinate results and share successes. To date, at least 10 meetings have been held in locations throughout the United States, and early signs of success can be observed. For example, federal agencies in Denver, Colorado, recently banded together to purchase 10.7 MW of wind energy at a cost of 2.5 cents per kWh above existing costs. This is expected to lead to an equivalent amount of new wind capacity to serve this need. Furthermore, wind energy may have easier access to transmission as a result of EPACT, which allowed wholesale customers to petition for a transmission access order by the Federal Energy Regulatory Commission (FERC) and by FERC rulemakings. In 1996, FERC issued Order 888, requiring transmission owners to offer wholesale power customers and generators “open access” to transmission services at comparable rates and service quality enjoyed by the transmission owners [1]. Subsequently, transmission owners began transferring control (but not ownership) to independent transmission organizations, making transmission more available on a regional basis and helping generators pay multiple utility-by-utility transmission charges when more than one utility transmission system is used. There are presently five regional transmission organizations (RTOs) in operation, encompassing about 1/3 of the generating capacity in the United States. In December 1999, FERC issued Order 2000, requiring transmission owners to form or join an RTO by October 2000 or provide FERC with an explanation as to why they have not [2]. Despite these positive developments, wind energy faces certain challenges in the deregulated U.S. electric power market. One major challenge is that wind energy remains somewhat more expensive than natural gas (though the price margin has narrowed considerably) and must generally rely on either public policy measures or the demand for green power for market penetration. Further, as part of electric restructuring, the components of the former vertically integrated utilities are “unbundled” into generation, transmission, and distribution. Although generation is becoming competitive in the United States with customers choosing their generation suppliers, transmission and distribution remain regulated monopolies. Part of what is unbundled includes “ancillary services,” i.e., essential services necessary for maintaining electric system reliability. These ancillary services include scheduling and dispatch; reactive supply and voltage control; energy imbalance; regulation; spinning reserve; and operating reserve. Generally, generators, including wind generators, must now self-supply these services or purchase them from the transmission operator (these services were previously rolled into customer bills). The challenge for wind power is that it is a low-capacity factor, intermittent source, often located remote from load. Furthermore, the variation in output from wind is likely to be greater than the variation from natural gas combined-cycle plants, making ancillary service costs potentially more burdensome for wind than for other generation sources. In particular, depending on how RTOs are designed and implemented, wind energy could be subject to significant ancillary service charges because of the variability of wind output.
3
2. VARIATION IN WIND POWER OUTPUT Very little public domain data is available for existing wind power plants, making it difficult to draw general conclusions about how short-term wind power output affects grid operation. However, there have been no problems integrating 800 MW generated by California wind farms into a stiff grid. Curtailments in Tehachapi, California, occurred during high winds, but many of these were primarily caused by transmission network weaknesses that have been corrected. Several researchers have examined the effects of wind output variability on system operation. For example, Javid, et al. [3] found no problems at wind penetration rates in the range of 10%–15%. Chan, et al. [4] found that there is very low risk of a significant decrease in wind output within a 10-minute interval. To address short-term variability of wind power plants on system operation, NREL has started a project to collect and analyze wind power data from one large wind farm in the Midwest region of the United States. NREL has also entered into a subcontract to collect data from two other locations in the Midwest. Data includes real power, reactive power, 3-phase line-to-ground voltages, and wind speed data. The objectives of the project are to collect high-quality, long-term, high-frequency data from wind power plants at several sites with different geographic characteristics and several different types of wind turbines. The goal is to obtain at least two years of data from this project so that a detailed analysis of power fluctuations can be performed on a high-resolution time scale. This will help us obtain a better understanding of the frequency distribution of wind power, the relationship of wind power plants to ancillary services in the emerging electricity markets, spatial and temporal diversity and correlation issues, and wind capacity credit. If the data can also be matched with utility load, cost, and/or market data, we can obtain estimates of the value of capacity that wind power plants contribute to the grid. The data could also play a useful role in the evaluation and field testing of various wind-forecasting methods. The data are collected and downloaded to NREL's National Wind Technology Center each day via modem. The data are also written to a local removable disk that is replaced and sent to NREL every two weeks. Some data have already been collected, and preliminary analysis has been done. From these data sets, it is possible to calculate various patterns of electricity production, ranging from secondto-second scales up to monthly scales. Researchers can compare power and energy output of individual turbines with total wind farm output and can calculate various coincidence factors and examine hourly production profiles. Figure 2 shows an example of a daily profile obtained from four grid interconnection points of the wind farm. The graph is based on 1-minute average data and shows the power output at each of the four points, along with the total wind power output and a reference wind speed recorded at a height of 5 meters. Because of the height and the location of the anemometer, the recorded wind speed data do not represent the true wind speed at the turbine hub. Nevertheless, they do provide a good indication of wind speed and its trend over the entire wind farm. For this 24-hour period, the total wind power is near maximum output for three distinct periods: from 4:00–8:00, from 9:00–12:30, and from 17:00– 23:00. The two downward spikes near 8:00 and 9:00 are caused either by over-voltage problems or by transmission network problems. The downward trends in the early afternoon are caused by individual turbines reaching the designed cut-off wind speed and shutting down. Additional data collected to date also shows some downward spikes during periods of extreme wind. With continuous real power, reactive power, and line voltage data at 1 Hz, NREL's monitoring program has initially helped the wind farm operator analyze tripping problems by describing wind farm states before and after an event. This information was subsequently used by the wind farm operator to design corrective measures to significantly reduce forced outages of individual wind turbine rows as well as the entire wind farm.
4
Point #1 Point #3 Total
Daily Power Profile Example 10000 0
Point #2 Point #4 Wind Speed 18.0
23:00
22:00
20:00
21:00
19:00
18:00
0.0
17:00
0
16:00
1.8
15:00
10000
14:00
3.6
13:00
20000
12:00
5.4
10:00
30000
11:00
7.2
9:00
40000
8:00
9.0
7:00
50000
6:00
10.8
5:00
60000
3:00
12.6
4:00
70000
2:00
14.4
1:00
80000
0:00
16.2
Wind Speed (m/sec)
(kW)
90000
(HH:MM)
Figure 2. Example daily wind power output profile
Table 1 helps us examine the transition rates from one power level to the next using 1-minute data. This table shows the estimated probability that wind power output will change from one state to another. For example, if the wind power level is at 40% of rated output, there is a .93 probability that the wind output in the next minute will also be 40%. Using the well-known persistence theory, which predicts wind speed in the next time period can be reasonably estimated by the wind speed in this time period, we would expect large transition rates along the diagonal of the table. Although this is roughly the case, we note the existence of some non-zero transition rates that are not tightly clustered along the diagonal; however, these outliers are generally very small and the result of forced outages.
10% 20% 30% 40% 50% 60% 70% 80% 90% 100%
10% 0.9905 0.0183 0.0007 0.0004 0.0004 0.0004 0.0001 0.0004 0.0004 0.0001
20% 0.0094 0.9592 0.0247 0.0003 0.0002 0.0001 0.0004 0 0 0.0003
30% 0.0001 0.0220 0.9448 0.0339 0.0002 0.0005 0.0001 0.0001 0.0003 0.0001
40% 0 0.0002 0.0295 0.9302 0.0408 0.0003 0.0003 0.0002 0.0001 0.0001
50% 0 0.0001 0.0001 0.0350 0.9151 0.0455 0.0005 0.0001 0 0.0001
60% 0 0.0001 0.0000 0.0001 0.0428 0.9066 0.0465 0.0002 0 0.0001
Table 1. State transition rates with 1-minute average power data
5
70% 0 0 0 0 0.0004 0.0465 0.9118 0.0399 0.0001 0.0003
80% 0 0 0 0 0.0001 0.0001 0.0399 0.9192 0.0431 0.0003
90% 100% 0 0 0 0 0 0 0 0 0 0 0 0 0.0002 0 0.0400 0 0.9328 0.0231 0.0364 0.9620
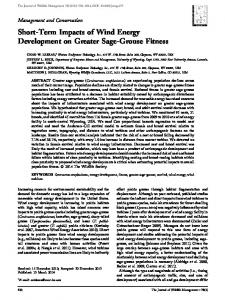
We can also examine the transition rates from high levels of output to lower levels (This technique was developed by Bernard Ernst at the Institute for Solar Energy Technologies, Kassel). For example, if the wind plant is producing 100% of rated capacity, the table indicates a 0.93 probability that the power level in the next minute will be 100%. We can also see that there is a very low probability (0.0001) that output will drop to 10% of capacity. This data should provide some assurance to power system operators that wind power output is not likely to change significantly in short time intervals. As additional data is collected, it will be possible to analyze these state transition rates for a number of time steps. Figure 3 illustrates the propagation of a wind gust through the wind farm, using 1-second data. The graph clearly shows the increase in power output at each of the four monitoring points within the wind farm, and this increase occurs with a time lag that corresponds to the passage of the gust. The total power output peaks at 21:33:33, although the last interconnection point does not peak until about 7 minutes later. The time interval between the peak at the first point and the peak at the last point is about 16 minutes. The graph also shows the total output of the wind farm during this period, and that this total output is sustained and with less variation than at the individual data collection points. The coincidental peak is 55,740 kW, which occurs just after 21:33, whereas the noncoincidental peak for this period is 69,250 kW. By calculating the ratio of the coincidental peak to the noncoincidental peak (80.5% in this case) we obtain a measure of the degree of power production diversity. The smoothing effects found in this data corroborate that found by Ernst [5] and by Milligan and Factor [6] using hourly data.
P o in t 1 P o in t 3 T o ta l (/2 )
L o c a l P e a k P o w e r D e ta ils 3 0 ,0 0 0
P o in t 2 P o in t 4 W in d S p e e d
3 0 .0
C P : 5 5 ,7 4 0 k W N C P : 6 9 ,2 5 0 k W 2 5 .0 2 4 ,0 0 0
Power (kW)
1 5 .0
1 2 ,0 0 0
Wind Speed (mph)
2 0 .0 1 8 ,0 0 0
1 0 .0
6 ,0 0 0 5 .0
21:41:00
21:40:00
21:39:00
21:38:00
21:37:00
21:36:00
21:35:00
21:34:00
21:33:00
21:32:00
21:31:00
21:30:00
21:29:00
21:28:00
21:27:00
21:26:00
21:25:00
21:24:00
21:23:00
0 .0 21:22:00
0
( H H :M M : S S )
Figure 3. Propagation of a gust through the wind farm.
3. CONCLUSIONS AND FUTURE WORK As the utility industry moves deeper into restructuring, knowledge of wind power variations and the role that these variations play in the provision of ancillary services will be vital. Analysis and anecdotal evidence suggest that as wind provides power to the grid with a modest penetration rate, these variations should not pose significant problems to grid operation or impose excessive ancillary services burdens
6
on the wind power plant. However, additional data analysis will help shed more light on these important issues and on different characteristics found among wind sites and the correlation with local grid properties. Given these differences, it will be important to investigate mitigation strategies that can be adapted to new locations. REFERENCES [1] Promoting Wholesale Competition Through Open Access Non-Discriminatory Transmission Services by Public Utilities, Docket No. RM95-8-000, Order No. 888, FERC Stats. And Regs. ¶ 31,036 (1996). [2] Regional Transmission Organizations, Docket No. RM99-2-000, Order No. 2000, FERC Stats. and Regs. ¶ 61,285 (December 20, 1999). [3] Javid, S.H.; Hauth, R.L.; Younkins, T.D.; Reddoch, T.W.; Barnes, P.R. "A Method for Determining How to Operate and Control Wind Turbine Arrays in Utility Systems." IEEE Transactions on Power Apparatus and Systems, Vol. PAS-104, No. 6, June 1985, pp. 1335 - 1341. [4] Chan, S.M.; Powell, D.C.; Yoshimura, M.; Curtice, D.H. "Operations Requirements of Utilities With Wind Power Generation." IEEE Transactions on Power Apparatus and Systems, Vol. PAS102, No. 9, September 1983, pp. 2850 - 2860. [5] Ernst, B. Analysis of Wind Power Ancillary Services Characteristics with German 250-MW Wind Data. Available at http://www.nrel.gov/wind/26722.pdf [6] Milligan, M.; Factor, T. "Application of a Dynamic Fuzzy Search Algorithm to Determine Optimal Wind Plant Sizes and Locations in Iowa.” Proceedings of the 6th International Conference on Probabilistic Methods Applied to Power Systems. September, 2000, Funchal, Madeira, Portugal. ACKNOWLEDGMENTS The authors would like to express their thanks to Brian Parsons, Kevin Porter, and Kathleen O’Dell at NREL, and Ryan Wiser at Lawrence Berkeley Laboratory.
7
Form Approved OMB NO. 0704-0188
REPORT DOCUMENTATION PAGE
Public reporting burden for this collection of information is estimated to average 1 hour per response, including the time for reviewing instructions, searching existing data sources, gathering and maintaining the data needed, and completing and reviewing the collection of information. Send comments regarding this burden estimate or any other aspect of this collection of information, including suggestions for reducing this burden, to Washington Headquarters Services, Directorate for Information Operations and Reports, 1215 Jefferson Davis Highway, Suite 1204, Arlington, VA 22202-4302, and to the Office of Management and Budget, Paperwork Reduction Project (0704-0188), Washington, DC 20503.
1. AGENCY USE ONLY (Leave blank)
2. REPORT DATE
September 2000
3. REPORT TYPE AND DATES COVERED
Conference paper
4. TITLE AND SUBTITLE
Short-Term Output Variations in Wind Farms–Implications for Ancillary Services in the United States
5. FUNDING NUMBERS
WER13010
6. AUTHOR(S)
J. Cadogan, M. Milligan, Y. Wan, and B. Kirby 7. PERFORMING ORGANIZATION NAME(S) AND ADDRESS(ES)
8. PERFORMING ORGANIZATION REPORT NUMBER
9. SPONSORING/MONITORING AGENCY NAME(S) AND ADDRESS(ES)
10. SPONSORING/MONITORING AGENCY REPORT NUMBER
National Renewable Energy Laboratory 1617 Cole Blvd. Golden, CO 80401-3393
NREL/CP-500-29155
11. SUPPLEMENTARY NOTES
12a.
DISTRIBUTION/AVAILABILITY STATEMENT
12b.
DISTRIBUTION CODE
National Technical Information Service U.S. Department of Commerce 5285 Port Royal Road Springfield, VA 22161 13. ABSTRACT (Maximum 200 words)
With the advent of competition in the electric power marketplace, this paper reviews changes that affect wind and other renewable energy technologies, and discusses the role of federal and state policies in the recent wind installations in the United States. In particular, it reviews the implications of ancillary service requirements on a wind farm and presents initial operating results of monitoring one Midwest wind farm. Under federal energy policy, each generator must purchase, or otherwise provide for, ancillary services, such as dispatch, regulation, operation reserve, voltage regulation, and scheduling required to move power to load. As a renewable technology that depends on the forces of nature, short-term output variations are inherently greater for a wind farm than for a gas-fired combined cycle or a supercritical coal-fired unit.
15. NUMBER OF PAGES
14. SUBJECT TERMS
8
Wind Energy, Ancillary Services, Renewable Energy
16. PRICE CODE 17. SECURITY CLASSIFICATION OF REPORT
Unclassified NSN 7540-01-280-5500
18. SECURITY CLASSIFICATION OF THIS PAGE
Unclassified
19. SECURITY CLASSIFICATION OF ABSTRACT
Unclassified
20. LIMITATION OF ABSTRACT
UL Standard Form 298 (Rev. 2-89) Prescribed by ANSI Std. Z39-18 298-102