Jun 30, 2009 - 1986, Nixon 1986, Tyrrell 1999,. Chen et al. 2008). ..... In the Gulf of Eilat, the main seasonal ecological pat- terns are driven by mixing that ...
AQUATIC MICROBIAL ECOLOGY Aquat Microb Ecol
Vol. 56: 205–215, 2009 doi: 10.3354/ame01321
Printed September 2009 Published online June 30, 2009
Contribution to AME Special 2 ‘Progress and perspectives in aquatic primary productivity’
OPEN ACCESS
Short-term variability in primary productivity during a wind-driven diatom bloom in the Gulf of Eilat (Aqaba) David Iluz1,*, Gal Dishon1, Elisa Capuzzo2, Efrat Meeder3, Rosa Astoreca4, Vivian Montecino5, Petr Znachor6, Dilek Ediger7, John Marra8 1
The Mina & Everard Goodman Faculty of Life Sciences, and The Department of Geography and Environment, Bar-Ilan University, Ramat-Gan 52900, Israel 2
School of Life Sciences, Napier University, Edinburgh, UK Interuniversity Institute for Marine Sciences, Eilat, and the Institute of Earth Sciences, The Hebrew University of Jerusalem, Jerusalem, Israel 4 Ecologie des Systèmes Aquatiques, Faculté des Sciences, Université Libre de Bruxelles, Belgium 5 Departamento de Ciencias Ecológicas, Facultad de Ciencias, Universidad de Chile, Santiago, Chile 6 Laboratory of Phytoplankton Ecology, Institute of Hydrobiology, Biology Centre ASCR, Czech Republic 7 Chemistry and Environment Institute, Gebze-Kocaeli, Turkey 8 Brooklyn College of the City University of New York, Brooklyn, New York, USA
3
ABSTRACT: In the northern Gulf of Eilat (Aqaba), sharp increases in the biomass of diatoms and rates of primary production occurred in April 2008. Within 24 h, diatom abundance rose from 8 × 10³ to 228 × 103 cells l–1, and photosynthetic rates concomitantly doubled from 15 to 35 µg C l–1 d–1. Water transparency declined, as indicated by the vertical diffusion attenuation coefficient Kd for photosynthetically active radiation (PAR), which increased from 0.076 to 0.090 m–1 and decreased the euphotic depth from 60 to 45 m. During this time, a significant increase in silica deposition by the diatoms was also detected. We attribute the mentioned changes in environmental characteristics to wind-generated surface currents. Strong winds (up to 10 m s–1) during the measurements enriched the surface layers with unusually high nutrient concentrations within 1000 mg N m–2 yr–1 to coastal waters in the biologically available forms NOx–, NH3/NH4+, and dissolved organic N; and groundwater (GW) can jointly account for 20 to > 50% of total exogenous or ‘new’ N loading and may uniquely mediate coastal eutrophication by bypassing estuarine filters of terrigenous N inputs. Trace metal enrichment (e.g. Fe) in AD and GW may interact synergistically with N to stimulate coastal production. In deep (> 200 m) oceanic regions away from land masses, much of the PP is dependent on regenerated ammonium derived from organic matter mineralization. Exceptions include production supported by N fixation or NO3 from upwelled deep water, both of which are considered new N sources. Coastal and estuarine environments are heavily influenced by new N, which is supplied either naturally by weathering of minerals, decomposition, lightning, and geothermal emissions, or anthropogenically (Hans 1997). Increasing quantities of atmospheric anthropogenic fixed N entering the open ocean could account for up to 1⁄3 of the ocean’s external (non-recycled) N supply and up to ~3% of the annual new marine biological production of ~0.3 Pg C yr–1 (Duce et al. 2008).
In the Gulf of Eilat, aerosol-borne trace element deposition has an impact on the surface water chemistry (Chen et al. (2008) and may thus affect PP in the surface water by supplying important macro- and micronutrients or, possibly, high levels of toxic elements. The study by Chen et al. (2008) shows that, even in an area dominated by mineral dust deposition and surrounded by deserts, anthropogenic air emissions may make a significant contribution to the levels of various trace elements such as Cu, Cd, Ni, Zn, and P. The estimated residence time of a few years for most trace elements underscores the importance of atmospheric fluxes to the Gulf ecosystem and the episodic nature of such deposition events demonstrates that these may have a large impact. Other phenomena that can change nutrient availability include the El Niño–Southern Oscillation (ENSO) and cyclones. Between September 1997 and August 2000, biospheric net PP varied by 6 Pg C yr–1 (from 111 to 117 Pg C yr–1) (Behrenfeld et al. 2001). The passage of cyclone Wasa in December 1991 led to increases in biomass and PP that were related to nutrient enrichment either from terrestrial runoff or resuspended sediments. The predominance of diatoms during cyclones seems to be a general pattern that can be related to their higher growth rates compared to other phytoplankters (Delesalle et al. 1993). Episodic eddy-driven upwelling may supply a significant fraction of the nutrients required to sustain PP of the subtropical ocean. Mode-water eddies can generate extraordinary diatom biomass and PP at depth relative to the time series near Bermuda. These blooms are sustained by eddy–wind interactions that amplify the eddy-induced upwelling (McGillicuddy et al. 2007). The Gulf of Eilat, which is an arm of the Red Sea, is an oligotrophic region with predictable seasonal cycles in macronutrient concentrations and phytoplankton community structure that are similar to other oligotrophic areas of the world’s oceans, such as the open ocean gyres. Changes in the dominance of different phytoplankton groups occur as the deep mixing conditions in winter relax, and stratification intensifies beginning in early spring and continuing through summer. Specifically, a bloom of eukaryotic nanophytoplankton characteristic of the winter–summer transition is replaced by a summer community dominated by picophytoplankton (< 5 µm), of which Prochlorococcus and Synechococcus are the most numerous (Lindell & Post 1995). Atmospheric inputs of other nutrients gradually increase the likelihood of P limitation in the Gulf (Chen et al. 2007). Simultaneously, these atmospheric inputs provide an important source of seawater-soluble iron (Chase et al. 2006), which appears to remain in excess of that required for microbial growth throughout the
207
Iluz et al.: Wind-driven productivity spike
year (Chen et al. 2007). During summer and fall, stratified surface waters are depleted of nutrients and picophytoplankton populations comprise the majority of cells (80 and 88%, respectively). In winter, surface nutrient concentrations are higher and larger phytoplankton are more abundant (63%) (Mackey et al. 2007). The aim of the present study was to describe a winddriven transient high primary productivity event in the Gulf of Eilat that was associated with a diatom bloom. The mechanism by which winds brought about the phytoplankton response is shown, and the implications of such dramatic spikes for estimates and models of PP are discussed.
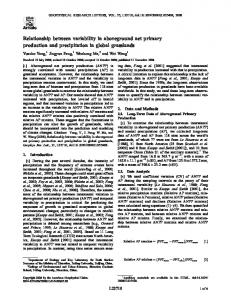
MATERIALS AND METHODS Observations were performed during the GAP Workshop held on 30 March to 6 April 2008 at the Interuniversity Institute of Marine Sciences in Eilat. In situ measurements and water sampling were carried out on 1 April 2008 at the following 3 stations: Stn A1, located ~10 km southeast of the northern shore of the Gulf of Eilat along its meridional axis at 29° 28’ N, 34° 55’ E, with a bottom depth of ~700 m; Stn OS (open sea) (29° 29’ N, 034° 55’ E), located in the middle of the Gulf opposite the IUI (Interuniversity Institute), with 400 m bottom depth; and Stn MP (Military Port) (29° 32’ N, 034° 57’ E), located at the northern shore 100 m from the coast, with 30 m bottom depth (Fig. 1). Depth, temperature, salinity, and fluorescence were measured with a CTD-19 (Sea-Bird Electronics) and an
in situ fluorometer (WetStar, WetLabs). Water samples were obtained with a rosette system of samplers from discrete depths of 1, 20, 40, 60, 80, and 100 m, and subsamples were taken from these depths for the measurement of PP. Laboratory analysis of the water samples comprised analyses of phytoplankton community structure, pigment absorption spectra, and heterotrophic bacterial count. Light measurements. The underwater light field was measured using a standard high-resolution profiling reflectance radiometer (Biospherical PRR-800), and both downwelling (Ed) and upwelling irradiance (Lu) were recorded at 18 wavelengths (305, 313, 320, 340, 395, 443, 465, 490, 520, 560, 589, 665, 683, 694, 710, 765, 780, and 875 nm) as well as EdzPAR (photosynthetic available radiation) (400–700 nm) and LuzChl (natural fluorescence). The PRR-800 also included internal sensors for temperature, detector-array temperature, inclination (roll/pitch), and depth. An onboard computer recorded the data during the casts. Light casts were done from the surface to 100 m depth. The diffusion attenuation coefficient (Kd) and euphotic zone depth (Zeu) were calculated from the EdPAR profiles. Ed was determined at 1 m intervals, and Kd was calculated over 5 m intervals, using PROFILER software as: K d (λ) =
ln(E d (λ)(z1 ) / E d (λ)(z 2 ) ) (Z 2 − Z1 )
(1)
where Ed is the downwelling irradiance (in µW cm–2 nm–1 for any specific wavelength λ or µmol photon cm–2 s–1 for PAR), Z1 and Z2 are 2 measured depths (m) and Kd is the attenuation coefficient (m–1) calculated for the depth interval Z2 – Z1. The euphotic depth (Zeu)
Fig. 1. (A) Schema of currents in the Gulf of Eilat in response to upwelling from northern coastal waters and downwelling from the west to the open sea deep water. (B) Map showing Stn A1: 700 m bottom depth; Stn OS: 400 m; Stn MP: 30 m, and IUI: incubation station, 150 m
208
Aquat Microb Ecol 56: 205–215, 2009
was calculated as the depth where 1% of EdPAR at 1 m was measured. The EdPAR values at 1 m were used instead of subsurface values since the latter were unusable due to high surface noise. Nutrients. Nitrites and nitrates were analyzed using the colorimetric method described by Grasshoff et al. (1999) using a flow injection autoanalyzer (FIA, Lachat Instruments Model QuikChem 8000). The analysis was fully automated and peak areas were calibrated using standards prepared in ‘low nutrient’ filtered seawater (surface seawater sampled during the oligotrophic season in the Gulf of Aqaba) over a range of 0 to 5 µmol l–1. The precision of this method is ± 0.02 µmol l–1 for nitrites and ± 0.05 µmol l–1 for nitrates. Chl a. Chl a was estimated using natural fluorescence, i.e. Lu from the PRR-800 at 683 nm. Chl a concentration (mg m– 3) may be calculated from the natural fluorescence flux (Ff, nmol photon m– 3 s–1), and the scalar irradiance (E0, µmol photon m–2 s–1), i.e. light flux from all directions: Ff Chl = °ac PAR × φf × E oPAR
(2)
Two important optical assumptions are used in this equation: °acPAR is the chl a-specific absorption coefficient (absorption normalized to chl a concentration) and φf is the quantum yield of fluorescence. These parameters are treated as constants in the software for the PRR-800, with respective values of 0.04 m2 mg–1 and 0.045 µmol photon fluoresced m–2 s–1 (µmol photon absorbed)–1 cm–2 s–1. High-resolution measurements (4 to 6 times per day) resulted in a map of chl a values during the period before and after the study period. Data were plotted and interpolated using Ocean Data View (ODV) software (Schlitzer 2008). Since the chl a estimation algorithm is based on empirical constants (the chl a-specific absorption coefficient and the quantum yield of fluorescence), which were not derived specifically for our phytoplankton assemblages, we calibrated the estimated chl a against extracted chl a concentrations throughout 2008 (including profiles acquired during the present study), using 51 samples over a range of 0.01 to 1.14 mg chl a m– 3. The calibration factor was calculated as chl a (mg m– 3) = 0.04 Ff chl – 0.0192 (R2 = 0.804). Absorption spectra. In vivo phytoplankton absorption was measured using the filter-pad method (Mitchell et al. 2000) from the discrete samples collected at different depths. Amounts of 600 to 2000 ml water were filtered onto 25 mm GF/F (Whatman). The filters were placed in histoprep tissue capsules (Fisher Scientific) and stored at –20°C until analysis 1 or 2 d later. The filters were scanned at 350 to 750 nm using a UV-visible spectrophotometer (Cary 50) to obtain total
particulate optical density (ODpart). After pigment extraction with methanol, the filters were rescanned to obtain the optical density of the detrital material (ODdet). OD spectra were then corrected for pathlength amplification (Cleveland & Weidemann 1993) and converted to absorption coefficient (apart/det) using: 2 . 303 × ODx (λ) (3) ax (λ) = X where the subscript x denotes either particulate or detrital OD (λ) and X is the ratio of the filtered volume to the filter clearance area. The absorption spectra were then corrected for residual scattering by subtracting the average over 748–752 nm from all measured spectra. Phytoplankton absorption (aph) was calculated as the difference between total particulate (apart) and detrital absorption (adet): aph = apart − adet
(4)
Phytoplankton enumeration. Samples (100 ml) for phytoplankton enumeration were collected at 5 m depth and fixed with 100 µl of a 25% glutaraldehyde solution. Samples were kept in low light and counted within 2 d of collection. For each sample, a 50 ml subsample was counted using a phase contrast inverted microscope (Utermöhl 1958). Only phytoplankton cells with > 5 µm diameter were identified (Tomas 1996). Phytoplankton biomass was estimated according to Edler (1979) and Menden-Deuer & Lessard (2000). Flow cytometry. Samples (1.8 ml) for ultraphytoplankton were preserved with 1% glutaraldehyde (final concentration) and immediately frozen in liquid N and stored at –80°C. Before analysis, samples were quickly thawed at 37°C and counted in a flow cytometer (FACScalibur, Becton & Dickinson). Phytoplankton samples were run at approximately 60 µl min–1 and 10 000 events were acquired in log mode. We added yellow-green latex beads (0.93 µm, Polysciences) to each sample as an internal standard. Silica deposition. Biogenic silica deposition was measured in natural phytoplankton assemblages using PDMPO (2-(4-pyridyl)-5-((4-(2-dimethylaminoethylaminocarbamoyl) methoxy)phenyl)oxazole) labeling following the modified protocol of Leblanc & Hutchins (2005). On 1 to 3 April, fresh surface and deepwater samples were incubated with PDMPO (final concentration of 0.125 µM) using 250 ml flasks. The samples were incubated in water tables with flowing seawater, and the tables were covered with window screening to reduce surface irradiance to ~25%. After a 24 h incubation, samples were brought to the laboratory and filtered through 2 µm pore size polycarbonate filters (Osmonics, Poretics). Filters were rinsed with distilled water to eliminate any unbound PDMPO, placed on a drop of immersion oil on a glass slide and sealed under
209
Iluz et al.: Wind-driven productivity spike
a glass cover with another drop of oil above the filter. A portion of cells actively depositing silica was counted immediately after filter preparation; PDMPO fluorescence was measured later. Epifluorescence microscopy coupled with digital image analysis was used for quantitative evaluation of PDMPO fluorescence (FPDMPO), which was expressed in relative fluorescence units (RU) cell–1 and calculated as described in Znachor & Nedoma (2008). A paired 2-tailed Student’s t-test was performed to examine differences in Si incorporation between surface populations and those at the deep chlorophyll maximum (DCM), with differences accepted as significant when p < 0.05. Productivity (carbon assimilation). PP measurements were made using the 14C uptake method described by Steeman-Nielsen (1952) and modified by Strickland & Parsons (1968). Bottles containing 50 ml samples of seawater were incubated in situ for 24 h at their original sampling depth after addition of ~5 µCi of carrier-free NaH14CO3 (New England Nuclear). The mooring line with the incubation bottles was deployed ~1 km offshore of the IUI (Fig. 1) at a bottom depth of 140 to 150 m before first light (~04:00 h), and retrieved at the same time the following morning. Upon retrieval, the incubation bottles were kept in a black box until filtration. The contents of the bottles were GF/F (Gelman) filtered with a Millipore glass filtration system under light vacuum (15 cm Hg). These filters were then treated with HCl vapors to remove traces of inorganic carbon. The filters were placed in glass vials with 10 ml Insta Gel (Packard) and counted in a liquid scintillation counter (Packard 3255) for 10 min each. Added activity was measured by sampling 50 µl from each bottle and placing it on a GF/F filter soaked with NaOH to trap the CO2. The addedactivity samples were counted in the manner described above. The total inorganic carbon was determined from alkalinity (Strickland & Parsons 1968). Productivity rates were then estimated using the JGOFS (Joint Global Ocean Flux Study) protocol (UNESCO 1994). Estimated productivity (Fc-683). Productivity estimated was estimated based on chlorophyll natural fluorescence at 683 nm wavelength, measured with an underwater spectro-radiometer (Biospherical PRR800). Natural fluorescence per volume (Ff) was derived from Lu in the chlorophyll emission spectrum. Fc-683 productivity estimation uses the volume fluorescence (Ff, nmol photon m– 3 s–1) and the scalar irradiance (EoPAR, µmol photon m–2 s–1) as well as photosynthetic parameters such as the maximal ratio of the quantum yields of photosynthesis to fluorescence (φrmax, C atom photon–1) and the irradiance at which this ratio is 1⁄2 of the maximum (kcf, µmol photon m–2 s–1]). These parameters were determined empirically and assigned as φrmax = 4 C atom photon–1 and kcf = 133 µmol photon
m–2 (Kiefer et al. 1989, Chamberlin et al. 1990, Chamberlin & Marra 1992). Fc = Ff
kcf φr max kcf + E oPAR
(5)
Fc-683 estimations were made using PROFILER software (Biospherical Instruments). An onboard computer recorded the data online. Measurements were done from the surface down to 100 m at 13:00 to 14:00 h. Regression of PP (estimated using in situ 14C uptake) against estimated productivity based on fluorescence (Fc-683, measured in 3 profiles on different dates) showed a significant correlation: Y (mg C m– 3 d–1) = 1.469 + 0.592 X (Fc-683 units); r2 = 0.823; p < 0.0001; n = 24. Each profile was taken from 5 to 100 m; no fluorescence readings were recorded in the upper 5 m because of the high ambient irradiance interference with readings from the PRR-800 reflectance radiometer. Wind speed and direction data were obtained from the meteorological database maintained at the IUI.
RESULTS Wind velocity changed dramatically throughout the study period and showed a diurnal variation of mainly high values during the day and low values at night. Wind speed was ~3 m s–1 at midnight prior to sampling and increased to almost 10 m s–1 the next day (2 April 2008) (Fig. 2B). The changes in wind speed also affected the temperature profiles, which displayed a sharp decrease (from 21.7 to 21.4°C in 15 h) at the surface (Fig. 2A). The thermocline, which was at 5 m on 1 April at 13:40 h, moved to a depth of ~35 m the following day (Fig. 2B). Temperature profiles during 20 March to 7 May 2008 showed significant changes in temperature during the storm event (Fig. 3). Following the strong wind event on 1 April, water transparency declined; K d(PAR) increased from 0.076 to 0.090 m–1 and Zeu increased from 60 m to 45 m, which is shallower than typically observed at this time of the year (Iluz 1997). Zeu continued to decrease for 4 d showing high diel variability, and increased once again by 6 April (Fig. 4). Chl a concentration was low and showed the typical vertical variation for the study area. The deep chlorophyll maximum (DCM) was at 30 m on 31 March, with a maximum value of ~1.5 µg l–1, but deepened during the remainder of the observation period, with declining chl a concentrations that reached a minimum on 8 April (Fig. 5).
Phytoplankton community structure Throughout the experiment, picophytoplankton (< 5 µm) increased from 25 to 50 µg C l–1 (see Bar Zeev
210
Aquat Microb Ecol 56: 205–215, 2009
Temperature (°C)
A 20.6 0
20.8
21
21.2
21.4
B 21.6
21.8
Wind speed
Thermocline
12
0 5 10
Wind speed (m s–1)
Depth (m)
20
40
60
80
1 Apr 2008 13:40 h 1 Apr 2008 18:20 h
100
15
8
20 6 25 4
30 35
Thermocline depth (m)
10
2 40
2 Apr 2008 06:40 h 2 Apr 2008 14:35 h
45
0 April 1
April 2
April 3
Fig. 2. (A) Temperature profiles and (B) wind speed during 1 to 2 April 2008. Grey shading in (B) indicates dark periods
et al. 2009). The > 5 µm fraction of the phytoplankton population was dominated by diatoms, which represented up to 99% of the abundance and 90% of the total biomass of the nanoplankton. Diatoms were at their lowest abundance and biomass on 1 April (6 × 10³ cells l–1 and 0.5 µg C l–1, respectively). The values increased again sharply on 3 April to 228 × 103 cells l–1 (abundance) and 20 µg C l–1 (biomass) (Fig. 4A). From 4 April, diatom abundances decreased to values
recorded prior to the strong wind event of 1 April. A centric diatom, Chaetoceros cfr. compressus, dominated the phytoplankton population during the sampling period, representing up to 84% of the cells identified in the samples and up to 64% of the total biomass. Other chain-forming centric diatoms (e.g. Leptocylindrus danicus, Eucampia cornuta, and Chaetoceros curvisetus) accounted for a maximum of 28% of the remaining phytoplankton biomass.
Fig. 3. Temperature profiles during 1 to 12 April 2008. Vertical dashed lines indicate measurement days which occurred in parallel to the storm event, showing significant changes in temperature
211
Iluz et al.: Wind-driven productivity spike
Phytoplankton absorption Phytoplankton pigment absorption changed temporally. Phytoplankton absorption at 435 nm, aph(435), increased from 0.045 m–1 on 1 April to 0.060 m–1 on 2 April and 0.062 m–1 on 3 April, and then decreased to 0.043 m–1 on 4 April. The aph(675) also varied accordingly. Phytoplankton pigment absorption at PAR (400–700 nm) showed a similar trend as aph(675), aph(435), and the diatom biomass (Fig. 4A).
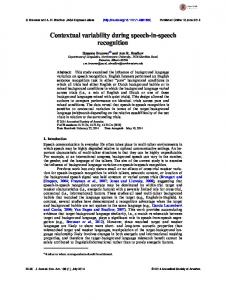
Primary productivity Within 1 d, productivity at 20 m depth increased from 15 mg C m– 3 d–1 at Stn OS (1 April 2008) to 35 mg C m– 3 d–1 at Stn A1 (2 April 2008) (Fig. 6). The daily integrated PP in the coastal Stn MP on 1 April was 1141 µg C m–2. We obtained similar and even higher values (1330 µg C m–2) at Stn A1 (located 10 km from Stn MP) on 2 April.
Fig. 4. (A) Wind speed (m s–1) during 28 March to 9 April 2008, diatom biomass (µg C l–1) at 5 m depth from 1 to 6 April 2008, and phytoplankton absorption of photosynthetically active radiation (PAR) (m–1). (B) Wind speed (m s–1) during 28 March to 9 April 2008, estimated productivity (Fc683; mg C [mg chl a]–1 m– 3 h–1), and euphotic depth Zeu (average of 3 to 5 measurements d–1, y-axis reversed)
Silica deposition Biogenic silica deposition was measured using PDMPO fluorescence to compare the growth rates of the dominant diatom
Fig. 5. Chl a concentration (mg m– 3) at various depths, showing changes in the deep chlorophyll maximum (DCM) during 1 to 12 April 2008. Vertical dashed lines indicate measurement days that occurred concurrently with the storm event
212
Aquat Microb Ecol 56: 205–215, 2009
Chaetoceros spp. during the study period. Due to low abundance of the other diatom species, their contribution to Si deposition could not be measured. In general, Si deposition of Chaetoceros was significantly higher at the DCM depth than at the surface (t = 2.9, p < 0.01). On 1 April, low abundance of Chaetoceros spp. concurred with low silica deposition rates (FPDMPO = 0.07 RU cell–1). During a peak in the Chaetoceros bloom on 2 April, Si deposition rates markedly increased (FPDMPO = 0.38 RU cell–1) and most of the population was involved in Si deposition at both the surface and the
DCM, indicating high growth rates. However, the day after the bloom, Chaetoceros growth rates dropped down to previous values, most likely due to nutrient depletion. On 1 April, concentrations of dissolved inorganic nitrogen (DIN) (nitrite and nitrate) ranged between 0.01 and 0.02 µM N, while it increased abruptly in near-surface waters on 2 April, reaching concentrations of 0.08 to 0.1 µM N. The day after the bloom, DIN levels decreased to 0.01 to 0.03 µM N.
DISCUSSION
Productivity (mg C m–3 d–1) 0
10
20
30
40
Daily PP and chl a concentration during the study period were the highest ever recorded in the Gulf of Eilat: 1330 mg C m–2 d–1 and up to 1.5 µg chl a l–1, respectively, which is almost 3× higher than average chl a values at this time of year in this area. Our results suggest an abrupt increase in mixing. The data show a sharp increase in the biomass of diatoms and in the rates of PP over a short time. Wind direction was from the coast towards the open Gulf, and upwelling was induced. PP is usually higher in the northern and coastal stations than in the open Gulf (Iluz 1997), but in the experiment reported here, we observed that on 1 April 2008 and the following day, the rates at Stn A1 (10 km from MP) increased to a level similar to that of the coastal Stn MP. The changes were limited to the upper 40 m (Fig. 6), with no significant increase in either biomass or productivity below this depth. We assume that the increased wind speed induced the transfer of a coastal water mass from the northern shore towards the open sea. This water is more nutrient rich than that of the open sea, and thus supports
50
0
20
Depth (m)
40
60 Stn OS (1 Apr) 80
Stn MP (1 Apr) Stn A1 (2 Apr)
100
120
Fig. 6. In situ primary production profiles at Stns MP (Military Port, 1 April), OS (open sea, 1 April), and A1 (2 April). The incubation at Stn A1 was on 2 April 2008
TON (µM l–1) 0
1
Depth (m)
0
2
Temperature (°C) 3
4
20.6 0
20
20
40
40
60
60
80
80 2 Apr 2008
100
3 Apr 2008 120
21
21.2
21.4
21.6
1 Apr 2008 13:34 h 2 Apr 2008 14:30 h
1 Apr 2008 100
20.8
3 Apr 2008 14:24 h 4 Apr 2008 12:26 h 6 Apr 2008 12:18 h
120
Fig. 7. (A) Profiles of total organic nitrogen (TON) on 1 to 3 April 2008, and (B) temperature on 1 to 6 April 2008, showing mixing from the surface and mixing of upwelled water at depth
Iluz et al.: Wind-driven productivity spike
the higher productivity near the northshore. This movement of the water mass is confirmed by temperature profiles (Figs. 2, 3, 7). In the period from 1 to 3 April, total organic nitrogen (TON) and temperature profiles revealed 2 current components: upwelling of colder and nutrient rich water from deep layers in the north towards the surface waters of the open sea, coupled with lateral downwelling of warm, surface waters that sink along the western shore of the Gulf and flow as a deep current towards the center of the Gulf (Fig. 1A) (Labiosa et al. 2003). Diatom abundance and biomass increased sharply over 2 d from 1 to 3 April, which accounts for the increased Si deposition by these cells and the concomitant depletion of Si in the water. The growth rates of the dominant diatom Chaetoceros doubled within 2 d and dropped the following day to pre-bloom values, probably due to nutrient exhaustion. As expected, the increase in PP preceded that of the biomass, which was phase-shifted by 1 d in relation to PP. Picophytoplankton are usually the main producers in the Gulf of Eilat and contribute > 90% to PP (Lindell & Post 1995); these phytoplankters probably responded rapidly to nutrient enrichment. Diatoms have a slower response than picophytoplankton, which explains the observed lag between the PP peak and maximum diatom cell density (Fig. 4). During the reported period, the sky was cloud-free; therefore, insulation may be excluded as a factor that might have induced the changes in phytoplankton density and vertical distribution, which were attested by changes in chl a concentration (Fig. 5). On the other hand, wind speed changed and correlated well with water column optical properties (Fig. 4B). In the Gulf of Eilat, the main seasonal ecological patterns are driven by mixing that usually takes place between February and April and which is characterized by deep convective mixing of the northern Gulf, which may extend down to hundreds of meters and even to the very bottom (Wolf-Vecht et al. 1992, Genin et al. 1995). Nutrients upwelled from depth and from coastal waters enrich the euphotic zone and increase PP. There are exceptional events that can raise PP, such as a high degree of mixing resulting from a particularly cold winter, as happened at the end of the winter in 1992, when the highest total daily PP rates ever recorded in the region were measured (738 mg C m–2 d–1). (During 1989– 1997, the multi-annual average productivity rate was ~200 mg C m–2 d–1; Iluz 1991, 1997). Winters in the Gulf of Eilat are exceptionally cold, resulting in very intense deep mixing (> 750 m) and increased nutrient injection from deep waters of the Gulf. As a result, a strong spring bloom develops at the onset of stratification (Gordon et al. 1994, Genin et al. 1995). Additional exceptional but local events are floods of the Shlomo River, as occurred in 1993
213
and which increased productivity to 604 mg C m–2 d–1 (Iluz 1997). The northern edge of the Gulf of Eilat borders the relatively populated areas of the cities of Aqaba and Eilat, where anthropogenic pollutant sources such as fish farms and sewage may produce impacts on the marine environment. However, the influence of these pollution sources seems, so far, to be of a slow and gradual nature. In contrast, the event that we report here was abrupt and prominent in its effects on the biology of the water. As the situation observed was apparently wind-driven, it is expected that it may occur repeatedly in the Gulf. Northern wind events with speeds exceeding 9 m s–1 occurred ~10× between 1 April 2007 and 1 May 2008, each lasting for at least 2 to 3 d. We do not know if these events had the same effects as those recorded in this report, and it is obvious that such observations should be repeated over several seasons to allow reliable estimation of their impacts on annual PP. It is noteworthy that routine ocean monitoring programs in which PP is measured once or twice a month are likely to miss their brief but significant spikes, leading to underestimation of seasonal and annual PP values. If these values are significant for total biomass, we should consider them in our calculations, as well as study their impact on the storage and flow of energy through marine food webs and ecosystems. Our recommendation is that, whenever possible, the sampling frequency for PP measurements should be increased using PP fluorescence calculations based on the Fc-683 method described here. Otherwise, where different automated systems tracking chlorophyll are installed, closely spaced PP measurements should be conducted when any sudden increase in pigment concentration is detected, in order to include otherwise undetected peaks. Such measurements would significantly increase and improve our annual estimates, and provide better databases for ecosystem models. Furthermore, such peaks are likely to trigger microbial and zooplankton peaks that may be missed or remain inexplicable. The advantage of the Fc-683 method is its high resolution and ease of operation that allow several measurements of depth profiles throughout the day. Such work would be nearly impossible with 14C incubations. Acknowledgements. We thank the Batsheva de Rothschild Foundation, Bar-Ilan University, the Moshe Shilo Center for Marine Biogeochemistry, and the staff of the Interuniversity Institute for funding and logistic support. We also thank the NATO Foundation (Sfp-981883) for funding part of the research of D.I. and G.D.; and Z. Dubinsky, Y. Yacobi and E. Bar Zeev for contributions to this paper. Attendance at the workshop by V.M. was partially supported by a grant from the Universidad de Chile, and R.A. was funded by BELSPO BEL-
Aquat Microb Ecol 56: 205–215, 2009
214
COLOUR-2 project (SR/00/104). This study was conducted during the 8th International Workshop of the Group for Aquatic Primary Productivity (GAP) and the Batsheva de Rothschild Seminar on Gross and Net Primary Productivity held at the Interuniversity Institute for Marine Sciences, Eilat, Israel in April 2008.
LITERATURE CITED
➤
➤ ➤
➤
➤
➤
➤
➤
➤ ➤
Bar Zeev E, Berman-Frank I, Stambler N, Vázquez Domínguez E and others (2009) Transparent exopolymer particles (TEP) link phytoplankton and bacterial production in the Gulf of Aqaba. Aquat Microb Ecol 56:217–225 Behrenfeld MJ, Randerson JT, McClain CR, Feldman GC and others (2001). Biospheric primary production during an ENSO transition. Science 291:2594–2597 Benitez-Nelson C (2000) The biogeochemical cycling of phosphorus in marine systems. Earth Sci Rev 51:109–135 Chamberlin WS, Marra J (1992) Estimation of photosynthetic rate from measurements of natural fluorescence: analysis of the effects of light and temperature. Deep-Sea Res 39:1695–1706 Chamberlin WS, Booth CR, Kiefer DA, Morrow JH, Murphy RC (1990) Evidence for a simple relationship between natural fluorescence, photosynthesis, and chlorophyll in the sea. Deep-Sea Res 37:951–973 Chase Z, Paytan A, Johnson KS, Street J, Chen Y (2006) Input and cycling of iron in the Gulf of Aqaba, Red Sea. Global Biogeochem Cycles 20:GB3017, doi:10.1029/ 2005GB002646 Chen Y, Mills S, Street J, Golan D, Post A, Jacobson M, Paytan A (2007) Estimates of atmospheric dry deposition and associated input of nutrients to Gulf of Aqaba seawater. J Geophys Res 112:D04309, doi:10.1029/2006JD007858 Chen Y, Paytan A, Chase Z, Measures C and others (2008) Sources and fluxes of atmospheric trace elements to the Gulf of Aqaba, Red Sea. J Plankton Res 113:1–13 Cleveland JS, Weidemann AD (1993) Quantifying absorption by aquatic particles: a multiple scattering correction for glass-fiber filters. Limnol Oceanogr 38:1321–1327 Codispoti LA (1989) Phosphorus vs. nitrogen limitations of new and export production. In: Berger WH, Smetacek VS, Wefer G (eds) Productivity of the ocean: present and past. J Wiley & Sons, Chichester, p 377–394 D’Elia CE, Sanders JG, Boynton WR (1986) Nutrient enrichment studies in a coastal plain estuary: phytoplankton growth in large scale, continuous cultures. Can J Fish Aquat Sci 43:397–406 Delesalle B, Pichon M, Frankignoulle M, Gattuso JP (1993) Effects of a cyclone on coral reef phytoplankton biomass, primary production and composition (Moorea Island, French Polynesia). J Plankton Res 15:1413–1423 Duce RA, LaRoche J, Altieri K, Arrigo K and others (2008) Impacts of atmospheric anthropogenic nitrogen on the open ocean. Science 320:893–897 Dugdale RC (1967) Nutrient limitation in the seas: dynamics, identification, and significance. Limnol Oceanogr 12:685–695 Edler L (ed) (1979) Recommendations for marine biological studies in the Baltic Sea: phytoplankton and chlorophyll. Baltic Mar Biol 5:1–38 Eppley RW, Peterson BJ (1979) Particulate organic matter flux and planktonic new production in the deep ocean. Nature 282:677–680 Field CB, Behrenfeld MJ, Randerson JT, Falkowski P (1998) Primary production of the biosphere: integrating terrestrial and oceanic components. Science 281:237–240
➤ Filippelli GM, Delaney ML (1996) Phosphorus geochemistry ➤ ➤ ➤
➤
of equatorial Pacific sediments. Geochim Cosmochim Acta 60:1479–1495 Follmi KB (1996) The phosphorus cycle, phosphogenesis and marine phosphate-rich deposits. Earth Sci Rev 40:55–124 Genin A, Lazar B, Brener S (1995) Vertical mixing and coral death in the Red Sea following the eruption of Mount Pinatubo. Nature 377:507–510 Gordon N, Angel DL, Neori A, Kress N, Kimor B (1994) Heterotrophic dinoflagellates with symbiotic cyanobacteria and nitrogen limitation in the Gulf of Aqaba. Mar Ecol Prog Ser 107:83–88 Grasshoff K, Kremling K, Ehrhardt M (eds) (1999) Methods of seawater analysis, 3rd edn. Wiley–VCH, Weinheim Hans P (1997) Coastal eutrophication and harmful algal blooms: importance of atmospheric deposition and groundwater as ‘new’ nitrogen and other nutrient sources. Limnol Oceanogr 42:1154–1165 Iluz D (1991) Primary production of phytoplankton in the northern Gulf of Eilat, Red Sea. MSc thesis, Bar-Ilan University, Ramat-Gan (in Hebrew with English abstract) Iluz D (1997) The light field, phytoplankton pigmentation and productivity in the Gulf of Eilat. PhD thesis, Bar-Ilan University, Ramat-Gan (in Hebrew with English abstract) Kiefer DA, Chamberlin WS, Booth CR (1989) Natural fluorescence of chlorophyll a: relationship to photosynthesis and chlorophyll concentration in the western South Pacific gyre. Limnol Oceanogr 34:868–881 Labiosa RG, Arrigo KR, Genin A, Monismith G, van Dijken G (2003) The interplay between upwelling and deep convective mixing in determining the seasonal phytoplankton dynamics in the Gulf of Aqaba: evidence from SeaWiFS and MODIS. Limnol Oceanogr 48:2355–2368 Leblanc K, Hutchins DA (2005) New applications of a biogenic silica deposition fluorophore in the study of oceanic diatoms. Limnol Oceanogr Methods 3:462–476 Lindell D, Post AF (1995) Ultraphytoplankton succession is triggered by deep winter mixing in the Gulf of Aqaba (Eilat), Red Sea. Limnol Oceanogr 40:1130–1141 Mackey KRM, Labiosa RG, Street JH, Paytan A (2006) Nitrogen and phosphorus co-limit growth and control community composition and taxon specific nutrient status in the Gulf of Aqaba, Red Sea. EOS Trans Am Geophys Union 86:52 Mackey KRM, Labiosa RG, Calhoun M, Street JH, Post AF, Paytan A (2007) Phosphorus availability, phytoplankton community dynamics, and taxon-specific phosphorus status in the Gulf of Aqaba, Red Sea. Limnol Oceanogr 52:873–885 McGillicuddy Jr DJ, Laurence AA, Bates NR, Bibby T and others (2007) Eddy/wind interactions stimulate extraordinary mid-ocean plankton blooms. Science 316:1021–1026 Menden-Deuer S, Lessard EJ (2000) Carbon to volume relationship for dinoflagellates, diatoms and other protist plankton. Limnol Oceanogr 45:569–579 Mitchell BG, Bricaud A, Carder K, Cleveland J and others (2000) Determination of spectral absorption coefficients of particles, dissolved material and phytoplankton for discrete water samples. In: Fargion GS, Mueller JL (eds) Ocean optics protocols for satellite ocean color sensor validation, Rev 2. NASA/TM-2000-209966, NASA Goddard Space Flight Center, Greenbelt, MD, p 125–153 Nixon SW (1986) Nutrient dynamics and the productivity of marine coastal waters. In: Halwagy R, Clayton D, Behbehani M (eds) Marine environment and pollution. Alden Press, Oxford, p 97–115
Iluz et al.: Wind-driven productivity spike
➤
Redfield AC (1958) The biological control of chemical factors in the environment. Am Sci 46:205–221 Ryther JH, Dunstan WM (1971) Nitrogen, phosphorus and eutrophication in the coastal marine environment. Science 171:1008–l 112. Scanlan DJ, Wilson WH (1999) Application of molecular techniques to addressing the role of P as a key effector in marine ecosystems. Hydrobiology 401:149–175 Schlitzer R (2008) Ocean data view. http://odv.awi.de Steeman-Nielsen E (1952) Measurements of production of organic matter in the sea by means of carbon-14. Nature 267:684–685 Strickland JDH, Parsons TR (1968) A practical handbook of seawater analysis. Bull Fish Res Bd Can 167:1–311 Tomas CR (1996) Identifying marine phytoplankton. Academic Press, San Diego, CA Editorial responsibility: Hugh MacIntyre, Dauphin Island, Alabama, USA
➤ Tyrrell
➤
215
T (1999) The relative influences of nitrogen and phosphorus on oceanic primary production. Nature 400: 525–531 UNESCO (1994) Protocols for the joint global ocean flux study (JGOFS) core measurements. IOC manuals and guides 29. UNESCO, Paris, p 170 Utermöhl H (1958) Zur Vervollkomnung der quantitativen Phytoplankton-Methodik. Mitt Int Ver Theor Angew Limnol 9:1–38 Wolf-Vecht A, Paldor N, Brenner N (1992) Hydrographic indications of advection/convection effects in the Gulf of Eilat. Deep-Sea Res 39:1393–1401 Znachor P, Nedoma J (2008) Application of the PDMPO technique in studying silica deposition in natural populations of Fragilaria crotonensis (Bacillariophyceae) at different depths in a eutrophic reservoir. J Phycol. 44:518–525 Submitted: December 9, 2008; Accepted: May 6, 2009 Proofs received from author(s): June 22, 2009