the game state and a player's probability of answering questions correctly can ... matches provided the basis for optimizing Watson's four strategy modules.
Simulation, Learning and Optimization Techniques in Watson's Game Strategies Gerald Tesauro, David Gondek, Jonathan Lenchner, James Fan and John Prager IBM TJ Watson Research Center 19 Skyline Drive, Hawthorne NY 10532 USA
Abstract The game of Jeopardy! features four types of decision making carrying great strategic importance: (1) Daily Double wagering, (2) Final Jeopardy wagering, (3) selecting the next square when in control of the board, and (4) deciding whether to attempt to answer, i.e., “buzz in.” Strategies that properly account for the game state and a player's probability of answering questions correctly can yield a huge boost in overall winning chances, when compared with simple “rule of thumb” strategies. In this article we present a simulation-based approach to developing and testing the above strategy components, which yielded faithful models of the players and the Jeopardy! game environment. We then describe machine learning and Monte-Carlo methods used by the components that maximize Watson’s winning chances in simulations. Application of these methods yielded superhuman game strategies for Watson that significantly enhanced its overall competitive record.
1
Introduction
Major advances in Question Answering (QA) technology were needed for Watson to play “Jeopardy!”1 at championship level --- the show requires rapid-fire answers to challenging natural language questions, broad general knowledge, high precision, and accurate confidence estimates. Building a computing system that can answer Jeopardy! questions even close to human performance levels required intense work over a four-year period by a team of two dozen IBM researchers; this was the primary focus and main technical achievement of the Watson project. Having pushed QA to a competitive level with humans in the Jeopardy! domain, it then became important to focus on the game’s strategic aspects in order to maximize Watson’s chance of winning. As detailed in [6], there are four types of strategy decisions: (1) wagering on a Daily Double (DD); (2) wagering during Final Jeopardy (FJ); (3) selecting the next square when in control of the board; (4) deciding whether to attempt to answer, i.e., “buzz in.” The most critical junctures of a game often occur in Daily Doubles and the Final Jeopardy round, where wagering is required. Selecting a judicious amount to wager, based on one’s confidence and the specific game situation, can make a big difference in a player's overall chance to win. Also, given the importance of Daily Doubles, it follows that a player's square selection strategy should result in a high likelihood of finding a DD. Allowing one's opponents to find the DDs can lead to devastating consequences, especially when playing against Grand Champions of the caliber of Ken Jennings and Brad Rutter. Furthermore, a contestant’s optimal buzz-in strategy can change dramatically in certain end-game scenarios. For example, a player whose score is just below half the leader's score may need to make a “desperation buzz” on the last question in order to avoid a guaranteed loss. Conversely, at just above half the leader's score, the correct strategy may be to never buzz. This article describes our team’s work in developing a collection of game-strategy algorithms deployed in Watson’s live Jeopardy! contests against human contestants. To our knowledge, this work constitutes the first-ever quantitative and comprehensive approach to Jeopardy! strategy that is explicitly based on estimating and optimizing a player’s probability of winning in any given 1
“JEOPARDY!” is a registered trademark of Jeopardy Productions, Inc.
1
Jeopardy! game state. Our methods enable Watson to find DDs faster than humans, and to calculate optimal wagers and buzz-in thresholds to a degree of precision going well beyond human capabilities in live game play. Watson’s use of these advanced quantitative game strategies significantly enhanced its overall competitive record, as detailed below. The following section first describes our development of a Jeopardy! simulator, which we use to simulate contests between Watson and human contestants. This work entailed mining historical data on contestant performance in thousands of previous episodes, to obtain models of the statistical performance profiles of human contestants, as well as their tendencies in wagering and square selection. We then present four specific methods for designing, learning and optimizing Watson’s four strategy modules over the course of many simulated games. These methods include: (i) DD wagering using a combination of nonlinear regression with Reinforcement Learning; (ii) FJ wagering based on a Best Response calculation using extensive Monte-Carlo sampling; (iii) square selection based on live Bayesian inference calculation of the Daily Double location probabilities; (iv) buzz-in thresholds in endgames using a combination of Approximate Dynamic Programming with online Monte-Carlo trials.
Jeopardy! Simulation Model This section describes our construction of a Jeopardy! simulator, which we used to render hundreds of millions of synthetic matches pitting Watson against human opponents of varying levels of ability, from average contestants to Grand Champions. Results from these simulated matches provided the basis for optimizing Watson's four strategy modules. The simulator uses stochastic models of the various events that can occur at each step of the game, ignoring the language content of category titles, questions and answers. These models are informed by: • (a) properties of the game environment (rules of play, DD placement probabilities, etc.) • (b) performance profiles of human contestants, including tendencies in wagering and square selection; • (c) performance profiles of Watson, along with Watson's actual strategy algorithms; • (d) estimates of relative “buzzability” of Watson vs. humans, i.e., how often a player is
able to buzz in first or “win the buzz” when all contestants are attempting to buzz in. Our primary source of information regarding (a) and (b) is a collection of comprehensive historical game data available on the J! Archive web site [1]. We obtained fine-grained event data from approximately 3000 past episodes, going back to the mid-1990s, annotating the order in which questions were played, right/wrong contestant answers, DD and FJ wagers, and the DD locations. We devised three different human models, corresponding to three different levels of opposition encountered during Watson's matches with human contestants. The “Average Contestant” model was fitted to all game data except Tournament of Champions data – this was an appropriate model of Watson's opponents in its first series of Sparring Games against former Jeopardy! contestants, which took place in late 2009 and early 2010. The “Champion” model was designed to represent much stronger opponents that Watson faced in a second series of Sparring Games during Fall 2010: those contestants had competed in the Tournament of Champions and had reached the final or semi-final rounds. We developed this model using data from the J! Archive list of top 100 all-time players.
Finally, for our Exhibition Match with Ken Jennings and Brad Rutter, we devised a “Grand Champion” model which was informed by performance metrics of the top 10 all-time players. Since the Exhibition Match used a multi-game format (1st, 2nd and 3rd place determined by twogame point totals), we developed specialized DD and FJ wagering models for Game 1 and Game 2 of the match, as described at the end of this section. Daily Double placement Our computations of joint row-column frequencies based on the J! Archive data of Round 1 and Round 2 DD placement confirmed the well-known observations that DDs tend to be found in the lower rows (third, fourth and fifth) of the board, and basically never appear in the top row. 2
However, we were surprised to discover that some columns are more likely to contain a DD than others. For example, DDs are most likely to appear in the first column, and least likely to appear in the second column. Additional analytic insights from the data include: (i) The two second-round DDs never appear in the same column. (ii) The row location appears to be set independently of the column location, and independently of the rows of other DDs within a game. (iii) The Round 2 column-pair statistics are mostly consistent with independent placement, apart from the constraint in (i). However, there are a few specific column pair frequencies that exhibit borderline statistically significant differences from an independent placement model. Based on the above analysis, the simulator assigns the DD location in Round 1, and the first DD location in Round 2, according to the respective row-column frequencies. The remaining Round 2 DD is assigned a row unconditionally, but its column is assigned conditioned on the first DD column.
Daily Double accuracy/betting model We modeled Average Contestant DD accuracy using the mean DD accuracy of all contestants over the J! Archive regular episode data set – a number which turned out to be 64%. The DD accuracy in the Champion model rises to 75%, and to 80.5% in the Grand Champion model.
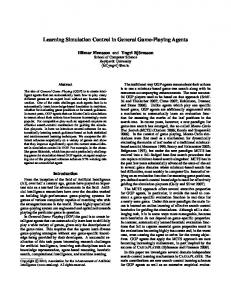
Figure 1: Distribution of Round 2 DD bets, normalized by player score, as a function of total number of previously revealed questions. (a) Bets made by first-place player “A.” (b) Bets made by second-place player “B.” Bets made by human contestants tend to be round number bets such as $1000 or $2000, and rarely exceed $5000. As we can see in Figure 1, bets appear to depend mainly on whether the contestant is leading or trailing, and how many questions have already been played. Contestants in the lead tend to become extremely conservative toward the end of the game, in an effort to protect their lead going into the Final Jeopardy round. While the above wagering tendencies were built into our Average Contestant model, we surmised (correctly as it turned out) that much stronger Champion and Grand Champion players would quickly realize that they need to bet DDs extremely aggressively when playing against Watson. These models thus employed an aggressive heuristic strategy which would bet nearly everything, unless a heuristic formula indicated that the player was close to a mathematically certain win. Final Jeopardy accuracy/betting model Our J! Archive data indicates that average contestants have approximately 50% chance to answer Final Jeopardy correctly, while Champions and Grand Champions respectively have about 60% and 66% FJ accuracy. Furthermore, from statistics on the eight possible right/wrong triples, it is also clear that right/wrong answers are positively correlated among contestants, with a correlation coefficient ρF ~ 0.3 providing the best fit to the data. The simulator implements draws of correlated random binary right/wrong outcomes by first generating correlated real numbers using a multi-variate normal distribution, and then applying suitably chosen thresholds to convert to 0/1 outcomes at the desired mean rates.
3
Figure 2: Distribution of human FJ bets, normalized by leader score, as a function of the ratio of second-place / first-place scores. (a) Bets made by first-place player “A.” (b) Bets made by second-place player “B.” The most important factor in FJ wagering is score positioning, i.e., whether a player is in first place (“A”), second place (“B”) or third place (“C”). To develop stochastic-process models of likely contestant bets, we first discarded data from “lockout” games (where the leader has a guaranteed win), and then examined numerous scatter-plots such as those shown in Figure 2. We see a high density line in A’s bets corresponding to the well-known strategy of betting to cover in case B’s score doubles to 2B. Likewise, there are two high density lines in the plot of B’s bets, one where B bets everything, and one where B bets just enough to overtake A. Yet there is considerable apparent randomization apart from any known deterministic wagering principles. After a thorough examination, we decided to segment the wagering data for A and B into six groups: we used a three-way split based on strategic breakpoints in B's score relative to A's score (less than 2/3, between 2/3 and 3/4, and more than 3/4), plus a binary split based on whether or not B has at least double C's score. We then devised wagering models for A, B, C2 that choose among various types of betting logic, with probabilities based on observed frequencies in the data groups. As an example, our model for B in the case (B 3/4 A, B 2C) bets as follows: bet “bankroll” (i.e., nearly everything) with 26% probability, “keepout C” (i.e., just below B-2C) with 27% probability, “overtake A” (i.e., slightly above A-B) with 15% probability, “two-thirds limit” (i.e., just below 3B-2A) with 8% probability, and various types of random bets with the remaining 24% probability mass. The betting models described above were designed solely to match human bet distributions, and were not informed by human FJ win rates. However, we subsequently verified by a historical replacement technique that the models track actual human win rates quite closely, as shown in Table 1. We first measured the empirical win rates of the A, B, C roles in 2092 non-locked FJ situations from past episodes. We then took turns recalculating the win rate of one role after replacing the bets of that role by the bet distribution of the corresponding model. The models match the target win rates very well, particularly since the human bets are likely to reflect unobservable confidence estimates given the FJ category. Real A 65.3% B 28.2% C 7.5%
Model 64.8% 28.1% 7.4%
Table 1: Comparison of actual human win rates with model win rates by historic replacement in 2092 non-locked FJ situations from past episodes.
2
Curiously enough, we saw no evidence that C's wagers vary with strategic situation, so we implemented a single betting model for C covering all six groups.
4
Regular question model
Figure 3: Frequencies in J! Archive data of seven possible outcomes of regular questions. Our stochastic-process model of regular questions generates a random correlated binary triple indicating which players attempt to buzz in, and a random correlated binary triple indicating whether or not the players have a correct answer. In the case of a contested buzz, a buzz winner is randomly selected based on the contestants’ relative buzzability (assumed equal in all-human matches). The model thus has four tuneable parameters: mean buzz attempt rate b, buzz correlation ρb, mean precision p, and right/wrong correlation ρp . We set the four parameter values by fitting to observed frequencies of the seven possible outcomes for regular questions, as depicted in Figure 3. The outcome statistics are derived from J! Archive records of more than 150K regular questions. The resulting parameter values were: b = 0.61, ρb = 0.2, p = 0.88 and ρp = 0.2. The right/wrong correlation is derived directly from rebound statistics, and is particular noteworthy: while a positive value is reasonable, given the correlations seen in FJ accuracy, it might be surprising due to the “tip-off” effect on rebounds. When the first player to buzz gives a wrong answer, this eliminates a plausible candidate and could significantly help the rebound buzzer to deduce the correct answer. We surmise that the data may reflect a knowledge correlation of ~ 0.3 combined with a tip-off effect of ~ -0.1 to produce a net positive correlation of 0.2. In the Champion model, there is a substantial increase in attempt rate (b = 0.80) and a slight increase in precision (p = 0.89). In the Grand Champion model, we estimated further increases in these values, to b = 0.855 and p = 0.915 respectively. We also developed refined models where b and p values depended on round and on dollar value – these refinements make the simulations more accurate, but do not meaningfully impact the optimization of Watson's strategies. Square selection model Most human contestants tend to select in top-to-bottom order within a given category, and to stay within a category rather than jumping across categories. There is a further weak tendency to select categories moving left-to-right across the board. Based on these observations, and on the likely impact of Watson’s square selection, we developed an Average Contestant model of square selection which stays in the current category with 60% probability, and otherwise jumps to a random different category. When picking within a category there is high probability (~90%) of picking the topmost available question. By contrast, we model Champion and Grand Champion square selection as DD seeking based on the known row statistics of DD placement. Strong players generally exhibit more Daily Double seeking when selecting squares, and when playing against Watson, they quickly adopt overt DD seeking behavior. Multi-game wagering model In most Jeopardy! contests, the winner is determined by performance in a single game. However, the Watson-Jennings-Rutter match utilized point totals over two games to determine first, second and third place. This clearly implies that wagering strategies must differ in Game 1 and Game 2 of the match, and both need to be different from single-game wagering. Since there is very limited multi-game match data available from J! Archive, it would be difficult to model the expected wagering of Jennings and Rutter in the Exhibition purely from historical data.
5
Fortunately, we were able to make some educated guesses that considerably simplified the task. First, we predicted that they would wager DDs very aggressively in both games, unless they had an overwhelming lead. This implied that we could continue to use the aggressive heuristic DD model for single games, with a revised definition of what constitutes an “overwhelming” match lead. Second, we also expected them to bet very aggressively in Final Jeopardy of the first game. This meant that we could treat Game 1 FJ as if it were a DD situation, and again use the aggressive heuristic model.
The only situation requiring significant modeling effort was Game 2 FJ. Given limited available match data, only crude estimates could be assigned of the probabilities of various betting strategies. However, it is clear from the data that the wagering of human champions is much more coherent and logical than the observed wagering in regular episodes, and champion wagers frequently satisfy multiple betting constraints. These observations guided our development of revised betting models for Game 2 FJ. As an example, in the case where B has a legal two-thirds bet (suitably defined for matches), and B can also keep out C, our model for B bets as follows: “bankroll” bet with 35% probability, bet a small random amount that satisfies both the two-thirds and keepout-C limits with 43% probability, or bet to satisfy the larger of these two limits with 22% probability.
Optimizing Watson Strategies Using the Simulation Model The simulator described above enables us to estimate Watson’s performance for a given set of candidate strategy modules, by running extensive contests between a simulation model of Watson and two simulated human opponents. The Watson stochastic-process models use the same performance metrics (i.e., average attempt rate, precision, DD and FJ accuracies) as in the human models. The parameter values were estimated from J! Archive test sets, and were updated numerous times as Watson improved over the course of the project. The Watson model also estimates buzz-ability, i.e., its likelihood to win the buzz against humans of various ability levels. These estimates were initially based on informal live demo games against IBM Researchers, and were subsequently refined based on Watson's performance in the Sparring Games. We estimated Watson’s buzzability at ~80% against average contestants, 73% against Champions, and 70% against Grand Champions. Computation speed was an important factor in designing strategy modules, since wagering, square selection and buzz-in decisions need to be made in just a few seconds. Also, strategy runs on Watson’s “front-end,” a single server with just a few cores, as its 3000-core “back-end” was dedicated to QA computations. As a result, most of Watson's strategy modules run fast enough so that hundreds of thousands of simulated games can be performed in just a few CPU hours. This provides a solid foundation for evaluating and optimizing the individual strategy components, which are described below. Some strategy components (endgame buzz threshold and Game 2 FJ betting) are based on heavyweight Monte Carlo trials; these are too slow to perform extensive offline evaluation. Instead, these strategies perform live online optimization of a single strategy decision in a specific game state.
Daily Double wagering strategy We implemented a principled approach to DD betting, based on estimating Watson’s likelihood of answering the DD question correctly, and estimating how a given bet will impact Watson's overall winning chances if he gets the DD right or wrong. The former estimate is provided by an “incategory DD confidence” model. Based on thousands of tests on historical categories containing DDs, the model estimates Watson’s DD accuracy given the number of previously seen questions in the category that Watson got right and wrong. To estimate impact of a bet on winning chances, we follow [5] in using Reinforcement Learning [4] to train a Game State Evaluator (GSE) over the course of millions of simulated Watson-vshumans games. The GSE consists of a nonlinear function approximator (specifically, a type of artificial neural net called a Multi-Layer Perceptron [3]) which receives a feature-vector description of the current game state, and outputs an estimate of the probability that each player will ultimately win the game. The combination of GSE with in-category confidence enables us to estimate E(bet), i.e. the “equity” (expected winning chances) of a bet, according to: E(bet) = pDD ∗ V (SW+bet, ...) + (1 − pDD ) ∗ V (SW−bet, ...) 6
(1)
where pDD is the in-category confidence, SW is Watson's current score, and V() is the game state evaluation when Watson's score either increases or decreases by the bet, the DD has been removed from the board, and all other features remain unchanged. We can then obtain an optimal riskneutral bet by evaluating E(bet) for every legal bet, and selecting the bet with highest equity. We additionally modified Equation 1 to incorporate known techniques in Risk Analytics; this achieved a significant reduction in downside risk when getting the DD wrong, at only a slight cost (less than 0.2% per DD bet) in expected win rate. Illustrative example Figure 4 illustrates how the DD bet analysis operates, and how the resulting bet depends on incategory confidence. The example is taken from one of the Sparring Games, where Watson got four consecutive questions right in the first category at the start of Double Jeopardy, and then found the first DD in attempting to finish the category. At this point, Watson's score was $11000 and the humans each had $4200. Watson’s in-category confidence took its maximum value, 75%, based on having gotten four out of four correct answers previously in the category. Watson chose to wager $6700, which is a highly aggressive bet by human standards. (Fortunately, he got the DD question right!) The left figure shows neural net equity estimates for getting the DD right (top curve) and wrong (bottom curve) at various bet amounts. These curves are extremely smooth with gently decreasing slopes. The right plot shows the resulting equity-vs-bet curve at Watson's actual 75% confidence level (magenta curve), along with four other curves at different confidence values ranging from 45% to 85%. Black dots on each curve indicate the best risk-neutral bet, and we can see how the bet steadily increases with confidence, from $5 at 45%, to approximately $9300 at the actual 75%, and finally to the entire $11000 at a (hypothetical) confidence of 85%.
Figure 4: (a) Equity estimates getting the DD right (top curve) and wrong (bottom curve). (b) Bet equity curves at five differences in-category confidence levels, from 45% to 85%. Black dots show how the optimal risk-neutral bet increases with confidence. We also note the effect of risk mitigation, which reduced Watson's actual bet from $9300 to $6700. According to extensive Monte-Carlo analysis of this bet, risk mitigation lowered Watson's equity by only 0.2% (from 76.6% to 76.4%), but reduced downside risk more than 10% in the event that Watson got the DD wrong. Multi-game DD wagering As mentioned previously, Game 1 and Game 2 of the Exhibition Match required distinct wagering strategies, with both differing from single-game wagering. We trained separate neural networks for
Game 1 and Game 2. The Game 2 net was trained first, using a plausible artificial distribution of Game 1 final scores. Having trained the Game 2 neural net, we could then estimate the expected probabilities of Watson ending the match in first, second, or third place, starting from any combination of Game 1 final scores, by extensive offline Monte-Carlo simulations. We used this to create three lookup tables, for the cases where Watson ends Game 1 in first, second, or third place, of Watson match equities at various Game 1 final score combinations, ranging from (0, 0, 0) to (72000, 72000, 0) in increments of 6000. (Since adding or subtracting a constant from all Game 1 scores has no effect 7
on match equities, we can without loss of generality subtract a constant so that the lowest Game 1 score is zero.) Since match equities are extremely smooth over these grid points, bilinear interpolation provides a fast and highly accurate evaluation of Game 1 end states. Such lookup tables then enabled fast training of a Game 1 neural net, using simulated matches that only played to the end of Game 1, and then assigned expected match-equity rewards using the tables. An important new issue we faced in the Exhibition was how to assign relative utilities to finishing in first, second and third place. Unlike the Sparring Games where our sole objective was to finish first, we extensively debated the amount of partial credit that IBM would garner by defeating one of the two greatest Jeopardy! contestants of all time. Ultimately we decided to base the match DD wagering on full credit for first, half credit for second, and zero credit for a third place finish -- such an objective places equal emphasis on finishing first and avoiding finishing third.
Final Jeopardy wagering Our approach to Final Jeopardy wagering involves computation of a “Best-Response” strategy (a standard game-theoretic concept) to the human FJ model presented earlier. We considered attempting to compute a Nash Equilibrium strategy, but decided against it for two reasons. First, due to the imperfect information in Final Jeopardy (contestants know their own confidence given the category title, but do not know the opponents’ confidence), we would in principle need to compute a Bayes-Nash equilibrium, which entails considerably more modeling and computational challenges. Second, it seems far-fetched to assume that Watson’s opponents would play their part of a Nash equilibrium, since the average contestant has not studied game theory. Computation of the Best-Response proceeds as follows. First, we consult an “FJ prior accuracy” regression model to estimate Watson’s confidence given the category title. This model was trained on samples of Watson's performance in thousands of historical FJ categories, using NLP-based feature vector representations of the titles. Second, given Watson's confidence and the human accuracy and correlation parameters, we derive analytic probabilities of the eight possible right/wrong outcomes. Third, for a given FJ score combination, we draw on the order of 10K Monte-Carlo samples of bets from the human models. Finally, we evaluate the equity of every legal bet, given the human bets and the right/wrong outcome probabilities, and select the bet with highest equity. After extensive offline analysis, we discovered that the Best-Response output could be expressed in terms of a fairly simple set of logical betting rules. As this is much faster than the full BestResponse calculation, we deployed a rule-based encapsulation of the Best-Response strategy for Watson’s Sparring Game matches. An example betting rule for B stipulates: If B has at least two-thirds of A, and B has less than 2C, check whether 2C-B (the amount to cover C's doubled score) is less than or equal to 3B-2A (the maximum two-thirds bet). If so, then bet 2C-B, otherwise bet everything.
For the Exhibition Match, we devised live Best-Response algorithms for Game 1 and Game 2 based on Monte-Carlo samples of the match human betting models, and probabilities of the eight right/wrong outcomes given Watson's FJ category confidence. For the first-game FJ, we can’t evaluate directly from the FJ outcomes since there is still a second game to play. The evaluation is instead based on interpolation over the lookup tables discussed earlier denoting Watson’s match equities from various first-game score combinations. For Game 2 FJ, we again devoted substantial effort to interpreting the Best-Response output in terms of logical betting rules. The derived rules mostly bet to guarantee a win as A if Watson answers correctly. For wagering as B, the betting rules would only attempt to finish ahead of A if it did not diminish Watson’s chances of finishing ahead of C. This naturally emerged from assigning half-credit for a second place finish in the match utility function. Finally, for wagering as C, the Best-Response output was too complex to derive human-interpretable rules, so Watson was prepared to run the live calculation in this case. As it turned out, all of the above work was superfluous, since Watson had a lockout in Game 2 of the Exhibition Match.
8
Square selection Selecting a DD can provide an excellent opportunity for a player to significantly boost his game standing, while also denying that opportunity to the other players. On the other hand, by gathering information about a category from its low-value questions, contestants can increase their expected accuracy for higher-value questions in the same category. We used the simulator to systematically investigate the relative importance for Watson of the following factors in square selection: finding the DDs, retaining control of the board if a DD is not found, and learning the essence of a category. These studies were performed using Champion and Grand Champion human models, which featured overt DD seeking, aggressive DD wagering, and high DD accuracy. Our results showed that, prior to all DDs being revealed, finding DDs is overwhelmingly the top factor in Watson's win rate, and retaining control is second in importance. Learning the essence of a category appears to provide an effective strategy only after all DDs have been found. These findings led us to deploy an algorithm that selects squares as follows. First, if there are any unrevealed DDs, a square i∗ is selected that maximizes pDD(i) + α∗pRC(i) where pDD(i) is the probability that square i contains a DD, pRC (i) is an estimated probability that Watson will retain control of the board if i does not contain a DD, and α=0.1 yielded the best win rate. The first term is calculated using Bayesian inference: we use historic DD frequencies as a prior, combined with evidence from revealed squares according to Bayes’ rule, to compute posterior probabilities for the DD locations. The second probability is estimated by combining the simulation model of human performance on regular questions with a model of Watson that adjusts its attempt rate, precision and buzzability as a function of the number of right/wrong answers previously given in the category. Second, after all DDs in the round have been found, the algorithm switches to selecting the lowest dollar value in the category with the greatest potential for learning about the category: this is based on the number of unrevealed questions in the category and their total dollar value. Confidence threshold for attempting to buzz Watson will attempt to buzz in if the confidence in its top-rated answer exceeds an adjustable threshold value. In most game states, the threshold is set to a default value which is tuned to maximize expected earnings. Near the end of the game the threshold may vary significantly from this default value. One
special-case policy that we devised for endgames uses a “lockout-preserving” calculation. For Round 2 states with no remaining DDs, if Watson has a big lead, we calculate whether he has a guaranteed lockout by not buzzing on the current square. If so, and if the lockout is no longer guaranteed if Watson buzzes and is wrong, we prohibit Watson from buzzing, regardless of confidence. In principle, there is an exact optimal buzz-in policy (B0*(c,D),B1*(c,D), B2*(c,D), B3*(c,D)) for any game state with a question in play, given Waton’s confidence c and the dollar value D of the current question. The policy is a four-component vector as there are four possible states in which Watson may buzz: the initial state, first rebound where human #1 answered incorrectly, first rebound where human #2 answered incorrectly, and the second rebound where both humans answered incorrectly. The optimal policy can be calculated using Dynamic Programming (DP) techniques [2]. This involves writing a recursion relation between the value of a current game state with K questions remaining before FJ, and values of the possible successor states with K−1 questions remaining: 5 Vk ( s) = ∫ ρ (c)∑ p( D j ) max ∑ p(δ | B, c)Vk −1 ( s' (δ , D j )) dc j =1
B(c, D j )
(2)
δ
where ρ(c) is the probability density of Watson's confidence, p(Dj ) denotes the probability that the next square selected will be in row j with dollar value Dj = 400*j, the max operates over Watson's possible buzz/no-buzz decisions, p(δ|B,c) denotes the probability of various unit scorechange combinations δ, and s’ denotes various possible successor states after the Dj square has been played, and a score change combination δ occurred. Exact DP computation of the optimal buzz-in policy entails expanding the root state to all possible successor states, going all the way to FJ states, evaluating the FJ states by Monte-Carlo trials, and then working backwards using Equation 2 to ultimately compute the optimal buzz policy in the root state. However, this is generally too slow to use in live play, where the buzz-in decision must
9
take at most ~1-2 seconds. We therefore implemented an Approximate DP calculation in which Equation 2 is only used in the first step to evaluate VK in terms of VK-1, and the VK−1 values are then based on plain Monte-Carlo trials. Due to slowness of the exact calculation, we were unable to estimate accuracy of the approximate method for K > 5. However, we did verify that Approximate DP usually gave quite good threshold estimates (within ~5% of the exact value) for K ≤ 5 remaining squares, so this was our switchover point to invoke Approximate DP as deployed in the live Sparring Games. The above algorithm easily handles, for example, a so-called “desperation buzz” on the last question, where Watson must buzz and answer correctly to avoid being locked out. From time to time it also generates spectacular movements of the buzz threshold that are hard to believe on first glance, but which can be appreciated after detailed analysis. An example taken from the Sparring Games is a last-question situation where Watson has $28000, the humans have $13500 and $12800, and the question value is $800. The (initially) surprising result is that the optimal buzz threshold drops all the way to zero! This is because after buzzing and answering incorrectly, Watson is no worse off than after not buzzing. In either case, the human B player must buzz and answer correctly in order to avoid the lockout. On the other hand, buzzing and answering correctly secures the win for Watson, so this is a risk-free chance to try to buzz and win the game.
Summary of Performance Evaluation We have performed extensive analysis to assess the faithfulness of the simulator in predicting live game results, and to measure the performance benefits of our advanced strategies, over both simpler baseline strategies as well as strategies used by humans. Detailed documentation of these analyses will be presented in a more extensive future publication. In brief, the simulator matched live results in the Sparring Games within sampling error according to every metric we examined. These include quantities such as: Watson win rate, Watson and human lockout rates, Watson’s rate of leading going into Final Jeopardy, Watson and human average scores, and Watson’s average board control. The simulator also accurately predicts the percentage of DDs found by Watson, and the average time it takes to find the first, second, and third DD in each game. In comparing each strategy module with a corresponding baseline heuristic, we obtained the following results: The improvement due to advanced DD betting was ~6.5% more wins, while square selection improvement was in the range of 3-10%, depending on how much DD seeking is done by the heuristic. For FJ betting, we estimate a ~3% gain over a heuristic algorithm that always bets just enough to close out when leading, and bets everything when trailing. We have no data on heuristic endgame buzzing, but a conservative guess is that our Approximate DP buzzing would achieve ~0.5-1% greater win rate. The cumulative benefit of these gains appears to be additive, as the simulator estimates Watson’s win rate at 50% using all baseline strategies, vs. 70% using all advanced strategies. Watson’s ability to find DDs more effectively than humans can be seen from the fact that its rate of finding DDs exceeds its average board control. This was true not only in simulation but also in live Sparring Games, where Watson found 53.3% of the DDs but only had 50.0% average board control. We can also show superiority of Watson’s wagering strategies by analysis of human bets in the J! Archive data. For example, the historic win rates in non-locked Final Jeopardy are 65.3% as A, 28.2% as B, and 7.5% as C. Using historic replacement of the recorded human bets with Watson’s Best-Response bets, these win rates increase to 67.0%, 34.4% and 10.5% respectively. We have also performed extensive Monte-Carlo analysis of human Daily Double bets on the last DD of the game. The results show that the average equity loss of human DD bets is between 3.2% and 4.2% per bet, which is an order of magnitude worse than Watson’s loss rate of 0.25% per bet.
Conclusions We have presented an original quantitative approach to strategy for playing the TV game show Jeopardy!. Our approach is comprehensive, covering all aspects of game strategy: wagering, square selection, attempting to buzz in, and modifications for multi-game tournament matches. A key ingredient in this work was development of an original simulation model of the game and its human contestants. 10
Apart from numeric metrics showing outperformance of human strategies, it is plainly evident that our strategy algorithms achieve a level of quantitative precision and real-time performance that exceeds human capabilities. This is particularly true in the cases of Daily Double wagering and endgame buzzing, where humans simply can’t come close to matching the precise equity and confidence estimates, and complex decision calculations performed by Watson in real time. Nor are humans capable of performing live Bayesian inference calculations of DD location likelihood. As such, our work could prove to be a valuable teaching tool for prospective contestants. If it were made widely accessible and re-oriented to optimizing human strategies, this could result in broad improvements in strategic decision-making as seen on the show. Such improvements have already occurred in numerous games such as Chess, Checkers, Othello, and Backgammon, once the best programs surpassed the top humans, and we expect Jeopardy! to be no different in this regard. We are investigating deployment of calculators of DD wagers and DD location probabilities on J! Archive. This would nicely complement the existing FJ wager calculator, and will make our methods widely accessible for study by prospective contestants. Looking beyond the immediate Jeopardy! domain, we also foresee more general applicability of our high-level approach to coupling Decision Analytics to QA Analytics, which consists of building a simulation model of a domain (including other agents in the domain), simulating shortterm and long-term risks and rewards of QA-based decisions, and then applying learning, optimization and Risk Analytics techniques to develop effective decision policies. We are currently investigating applications of this high-level approach in health care, dynamic pricing, and security (i.e., counter-terrorism) domains.
References [1] J! Archive. http://www.j-archive.com. [2] D. P. Bertsekas. Dynamic Programming and Optimal Control. Athena Scientific, 1995. [3] D. E. Rumelhart, G. E. Hinton, and R. J. Williams. Learning internal representations by error propagation. In D. E. Rumelhart, J. L. McClelland, et al., editors, Parallel Distributed Processing: Volume 1: Foundations, pages 318–362. MIT Press, Cambridge, 1987. [4] R. S. Sutton and A. G. Barto. Reinforcement Learning: An Introduction. MIT Press, 1998. [5] G. Tesauro. Temporal difference learning and TD-Gammon. Commun. ACM, 38(3):58–68, 1995. [6] Jeopardy! Gameplay: http://en.wikipedia.org/wiki/Jeopardy!#Gameplay
11