dependent attenuation in water, as well as losses due to reflection from TyVek were taken into account. The contributions from through-going muons, stopping.
28th International Cosmic Ray Conference
1041
Simulation of Pierre Auger Surface Detector Response to Muons A. K. Tripathi,1 K. Arisaka,1 D. Barnhill,1 , A. Etchegoyen,2 A. Filevich,2 J. Gonzalez,3 , T. McCauley,3 M. C. Medina,2 D. Melo,2 T. Ohnuki,1 T. Paul,3 W. Slater,1 D. Supanitsky,2 A. Tamashiro2 (1) University of California, Los Angeles, USA (2) TANDAR-CNEA, Buenos Aires, Argentina (3) Northeastern University, Boston, USA
Abstract We report the results of simulations of the Pierre Auger surface detector response to muons. The absolute energy scale in Auger surface detectors is characterized by the so called ”Vertical Equivalent Muon” (VEM), which is the average energy deposited by vertical penetrating muons, going through the center of the tank. In reality, for practical reasons, we can only measure the energy deposited by omni-directional muons, triggering on simple coincidence among three PMTs in a detector. Such a trigger provides a characteristic peak in the total charge distribution (”muon hump”). The value of ”VEM” must be inferred from the ”Muon Hump” location. This ratio of “muon hump” to VEM is determined from a few especially equipped tanks, and then applied to all the tanks in the array. As a result, any systematic effects in this ratio would propagate to the whole array. This makes it very important to fully understand the detector response to muons, as well as the “Muon Hump”/VEM ratio and any associated systematics by Monte Carlo. Our studies indicate that we can measure VEM to within 5% accuracy. 1.
Introduction
Observation of ultra high energy cosmic rays (UHECR) with energies in excess of 1020 eV poses as yet unanswered fundamental questions about their origin, acceleration mechanism, and propagation through space. The existing experimental data does not conclusively answer the question of the GZK cutoff [3, 8, and 11]. The Pierre Auger Project [4] is a large hybrid observatory, designed to collect a high statistics sample of UHECR in order to provide an accurate and conclusive picture of the UHECR spectrum. With increased statistics, the systematic errors will become more important. The absolute energy scale in Auger surface detectors is set by vertical penetrating muons, known as Vertical Equivalent Muon (VEM). Any uncertainty c pp. 1041–1044 �2003 by Universal Academy Press, Inc.
1042
in VEM value directly translates into the same relative uncertainty in the shower energy. As a result, it is important to fully understand the response of Auger surface detectors (SD) to muons. Description of Auger surface detectors can be found elsewhere [4]. For practical reasons, muon telescopes can not be placed on the surface detectors in the field. Instead, muon data is collected by requiring coincidence among the three PMTs in a tank for a sufficiently low threshold. This trigger gives a characteristic distribution as shown in Figure 2 (left, circles), which includes the so called “muon hump”, caused by omni-directional through-going muons. The ratio between this muon hump and VEM is determined from a few especially equipped tanks, and then is applied to all the tanks in the array. More details on Auger SD calibration can be found in reference [2]. This report describes the results of simulations done to study the SD response to muons. 2.
A Semi-analytical description of the detector response
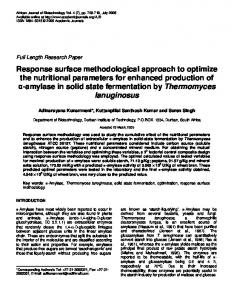
Simply based on the track length distribution alone, one can describe the “muon hump” structure surprizingly well. The details of this analysis can be found in [6]. In this approach, assuming a cos2 (θ) distribution (θ is the zenith angle) of incident muons, muon entry positions and directions on the tanks are generated. All such tracks are assumed to traverse through the tank completely, meaning stopped muons, and their decay is ignored. The number of Cherenkov photons reaching a PMT is then predicted by convolving the corresponding track length with a measured distribution of VEM in a real water tank. For example, if the length of a track is twice that of a vertical muon, the corresponding number of Cherenkov photons is taken to be 2.0×(measured VEM), with the fluctuations in measured VEM taken into account. Figure 1 shows the results of this study. The left panel shows the distribution of the track lengths, and the right panel shows the simulated charge spectrum from these track lengths. Real data is also superimposed. Clearly, there is good agreement between data and this simulation in the region of the “muon hump”. The hump at lower charges is not reproduced as only through going muons are considered in this analysis. 3.
GEANT Based Simulation of Surface Detector Response
Now we describe the GEANT-based simulation of surface detector response. Both GEANT3 and GEANT4-based studies were done [9,10]. First, the muon directions were generated assuming a cos2 (θ) spectrum ( θ = zenith angle). The phase space due to solid angle acceptance was taken into account. The momentum spectrum of these muons was taken from [7]. These muons were then propagated through the water in the tank with realistic geometry, with all physics processes turned on. The Cherenkov photons were followed through wa-
700
Counts
Counts
1043
600
900 800 700
500 600 400
500
300
400 300
200 200 100 0 0
100 0.5
1
1.5
2
2.5
3
3.5 4 Tracklength (m)
0 0
50
100
150
200
250
300
350 400 Charge (pC)
Fig. 1. Left: distribution of track lengths in the water tank (ignoring stopped tracks). The Sharp edge at 1.2 m corresponds to vertical penetrating muons. Right: light gray histogram is the distribution of energy deposit (converted to charge of PMT pulse) obtained by convolving the track lengths with corresponding expected energy deposit. The real data (dark black) is also superimposed.
ter until they reached the photocathode of one of the PMTs. The wavelength dependent attenuation in water, as well as losses due to reflection from TyVek were taken into account. The contributions from through-going muons, stopping muons and the decay electrons, and typical low energy electrons were studied separately [10]. There are large uncertainties in the flux of the low energy EM component, as well as low energy muonic component which will result in decay electrons. Figure 2 (left panel) shows the combined contributions from different components from our simulation (solid line), where the level of EM component was chosen in order to approximate the observed level below the “muon hump” in data (circles). Since the number of photoelectrons is hard to estimate in real data, the X-axis of real data was scaled to match the location of the muon hump with that of MC in Figure 2. This plots shows that we can reproduce the shape of the observed spectrum in Monte Carlo. Also shown in Figure 2 (right panel) are the ratio of Muon Hump to VEM from both data (see [1] and [5]) and our simulation, both for single PMT signals and the sum of the signals from the three PMTs. One can see clearly that this ratio depends on the photostatistics, and for the case of realistic quantum efficiency, the simulation reproduces the observed ratios within 5%. 4.
Summary and Conclusion
We have performed detailed simulations of Auger Cherenkov detectors to muons, as well as electromagnetic components. We can reproduce the observed shape of the spectrum of energy deposited by through going muons (“muon hump”), in Auger surface detectors with good accuracy. We can also reproduce
1044 5000
Muon Hump
4500 4000
Data GEANT MC
3500 3000 2500 2000 1500 1000 500 0 0
50
100
150
200
250
300
Number of Photoelectrons
Fig. 2. Left: The spectrum of energy deposit in an Auger water tank. Solid line: typical spectrum obtained form a real detector in the engineering array. Circles: spectrum obtained from a GEANT3 simulation. Right Panel: Ratio of the “muon hump” to “VEM”, from MC, both for single PMT signals and sum of the three PMT signals. The shape of the spectrum obtained from real data is also shown.
the shape of the lower energy part of the spectrum quite well, but a better understanding of the EM component is needed. We found that the ratio of VEM to Muon Hump is affected by photostatistics, and our Monte Carlo can reproduce this ratio to within 5% of the observed values. Further work is in progress to understand the detector response with greater accuracy. 5.
1. 2. 3. 4. 5. 6. 7. 8.
References
Allison P. S. et al. 2002, Auger Technical Note GAP-2002-028. Bertou X. for the Pierre Auger Collaboration , these proceedings. Bird D. J. et al 1993, Phys. Rev. Lett., 71, 3401. 71, 3401 (1993). Blumer, H. for the Auger Collaboration, these proceedings. Chou A. S. 2002, Auger Technical Note GAP-2002-045. Etchegoyen A. , Auger Technical Note GAP-2002-078. Handbook der Physik 1955, Vol 46. Jui C. H. for the HiRes collaboration 2001, in Proceedings of the 27th International Cosmic Ray Conference, Hamburg. 9. McCauley T., Paul T. , Auger Technical Note GAP-2000-055. 10. Slater W. E. et al. , Auger Technical Note GAP-2002-063. 11. Takeda M. et al. 1998, Phys. Rev. Lett., 81, 1163.