Papers in Press. Published September 6, 2013 as doi:10.1373/clinchem.2013.203653 The latest version is at http://hwmaint.clinchem.org/cgi/doi/10.1373/clinchem.2013.203653 Clinical Chemistry 59:10 000 – 000 (2013)
Molecular Diagnostics and Genetics
Single-Nucleotide Polymorphisms and Other Mismatches Reduce Performance of Quantitative PCR Assays Steve Lefever,1 Filip Pattyn,1 Jan Hellemans,1,2 and Jo Vandesompele1,2*
BACKGROUND:
Genome-sequencing studies have led to an immense increase in the number of known singlenucleotide polymorphisms (SNPs). Designing primers that anneal to regions devoid of SNPs has therefore become challenging. We studied the impact of one or more mismatches in primer-annealing sites on different quantitative PCR (qPCR)-related parameters, such as quantitative cycle (Cq), amplification efficiency, and reproducibility.
METHODS:
We used synthetic templates and primers to assess the effect of mismatches at primer-annealing sites on qPCR assay performance. Reactions were performed with 5 commercially available master mixes. We studied the effects of the number, type, and position of priming mismatches on Cq value, PCR efficiency, reproducibility, and yield.
RESULTS:
The impact of mismatches was most pronounced for the number of mismatched nucleotides and for their distance from the 3⬘ end of the primer. In addition, having ⱖ4 mismatches in a single primer or having 3 mismatches in one primer and 2 in the other was required to block a reaction completely. Finally, the degree of the mismatch effect was concentration independent for single mismatches, whereas concentration independence failed at higher template concentrations as the number of mismatches increased. CONCLUSIONS: Single mismatches located ⬎5 bp from the 3⬘ end have a moderate effect on qPCR amplification and can be tolerated. This finding, together with the concentration independence for single mismatches and the complete blocking of the PCR reaction for ⬎3 mismatches, can help to chart mismatch behavior in qPCR reactions and increase the rate of successful
1
Center for Medical Genetics Ghent, Ghent University, Ghent, Belgium; 2 Biogazelle, Zwijnaarde, Belgium. * Address correspondence to this author at: Center for Medical Genetics Ghent, Ghent University, 9000 Ghent, Belgium. Fax ⫹32-9-3326549; e-mail Joke.
[email protected]. Received January 30, 2013; accepted June 24, 2013.
primer design for sequences with a high SNP density or for homologous regions of sequence. © 2013 American Association for Clinical Chemistry
For more than a decade, quantitative PCR (qPCR)3 has been the standard method for nucleic acid analysis. This era has witnessed the development of a range of detection methods, from the use of simple DNAintercalating fluorescent dyes, such as SYBR Green, to the application of more-complex oligonucleotides, such as Scorpions (1 ). Importantly, the specificity of target amplification specificity is predominantly determined by a primer’s annealing characteristics. Properly designed qPCR primers control for nonspecific amplification, secondary structures in amplicons, and singlenucleotide polymorphisms (SNPs) within primerannealing sites. The last consideration in designing highly specific primers has become increasingly challenging with the growing number of SNPs being discovered in massively parallel sequencing projects, such as the 1000 Genomes Project. The high SNP density in the human genome, particularly in gene promoter and gene regions, may eventually lead to a time when designing assays with SNP-free primer-annealing sites becomes difficult, if not impossible. Meanwhile, the increasing knowledge of genomic features is expected to increase the success rate in the wet laboratory. Until recently, the actual impact of imperfect primer annealing has been largely unknown. Wu et al. used a modified single-base extension assay to assess the effect of mismatch type and position on extension efficiency during the first PCR cycle (2 ). They found minimal or no primer extension when they introduced a mismatch within the last 3 or 4 bases of the primer’s 3⬘ end and hypothesized that low extension efficiency was caused by reduced binding of the DNA polymerase to the target site. In contrast, others have stated that the DNA polymerase affinities for correctly paired and mis-
Previously published online at DOI: 10.1373/clinchem.2013.203653 3 Nonstandard abbreviations: qPCR, quantitative PCR; SNP, single-nucleotide polymorphism; Cq, quantification cycle; dCq, difference between the Cq for the mismatch reaction and the mean Cq of the corresponding perfect-match reactions; dTm, difference in primer annealing temperature; Tm, primer annealing temperature.
1
Copyright (C) 2013 by The American Association for Clinical Chemistry
GTTTGTCGTGATGAGTTTGN CGTTTGTCGTGATGAGTTTN TCGTTTGTCGTGATGAGTTN TTCGTTTGTCGTGATGAGTN (*)ATTCGTTTGTCGTGATGAGN GATTCGTTTGTCGTGATGAN TGATTCGTTTGTCGTGATGN GTGATTCGTTTGTCGTGATN AGTGATTCGTTTGTCGTGAN AGTGATTCGTTTGTCGTGANGAGTTTGGTGTACCCGCTTAGATCCAGGACACTTTCATACGGTT AGTGATTCGTTTGTCGTGATNAGTTTGGTGTACCCGCTTAGATCCAGGACACTTTCATACGGTT AGTGATTCGTTTGTCGTGATGNGTTTGGTGTACCCGCTTAGATCCAGGACACTTTCATACGGTT AGTGATTCGTTTGTCGTGATGANTTTGGTGTACCCGCTTAGATCCAGGACACTTTCATACGGTT AGTGATTCGTTTGTCGTGATGAGNTTGGTGTACCCGCTTAGATCCAGGACACTTTCATACGGTT 0
10
20
30
40
50
60
GTCCTGTGAAAGTATGCCAA
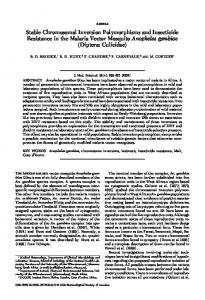
Fig. 1. Experimental setup: 36 tiling forward primers (top sequences), sixteen 64-base templates (middle sequences), and 1 reverse primer (bottom sequence). All forward primers were derived from the starting forward primer (*). N denotes one of the 4 possible nucleotides (A, C, G, or T).
paired duplexes are similar (3 ). In contrast to the effect of mismatches near a primer’s 3⬘ end, extension efficiency has been observed to increase for primers with mismatches located closer to the 5⬘ end. Other approaches have not only analyzed the first PCR cycle but also monitored the efficiencies of the complete reaction with and without the presence of mismatches within primer-annealing sites (4 ). The limitation of these particular experimental setups is that results obtained from assessing a small number of mismatches for only a small number of primer positions yield an incomplete view of the impact of mismatches on primerannealing sites. Mismatches appear to have no impact on PCR efficiency, implying that the mismatch effect is present only during the first few cycles. Once the mismatch has been incorporated into the template, qPCR proceeds with normal efficiency. The last 2 studies (3, 4 ) also noted that a single mismatch at the primer’s 3⬘ end had no or only minimal impact on qPCR yield (defined as the number of molecules at the end of the reaction) and that ⱖ2 mismatches increased the quantification cycle (Cq) value by 3–5 units. In addition, the presence of a mismatch reportedly has only a limited effect on amplification curve quality (5 ). We describe our systematic study of mismatch behavior. We considered all types of mismatches in the last 5 bases of a primer’s 3⬘ end in combination with 5 commercially available qPCR master mixes. The effects of the number, type, and position of priming mismatches on Cq value, PCR efficiency, reproducibility, and yield (defined as the end point fluorescence) were studied. 2
Clinical Chemistry 59:10 (2013)
Materials and Methods PRIMERS AND TEMPLATES
Primers and templates were designed by using a Perl pipeline. Secondary structure and primer-dimer formation were analyzed with UNAFold (6 ), and primer melting temperatures were calculated with Primer3 software (7 ). We started by designing artificial forward and reverse primers and controlling for primer dimerization and intermolecular secondary structures (Fig. 1). By consecutively adding and removing a nucleotide from opposite ends of the original forward primer, we created 8 new primers, located 4 bases upstream or downstream of the original forward primer. Once we had all of the primers, we designed a singlestranded 3⬘-blocked template by adding a 16-base randomly generated “stuffer” sequence between the sequences of the forward and reverse primers. In the final phase, we introduced mismatches at the 3⬘ terminal position of all forward primers and at positions 19 –23 of the template, yielding a total of up to 36 forward primers (9 shifted primers times 4 end-base variants) and 16 templates (1 base template and 3 base variants at 5 positions). This design produced 576 primer/template combinations with a varying number, type, and position of base-pair mismatches (see Tables 1 and 2 in the Data Supplement that accompanies the online version of this article at http://www.clinchem.org/content/vol59/issue10). In each step of the design process, our analyses excluded not only templates and primers with secondary structures but also dimerizing primer pairs (dG ⱖ 0).
SNPs and Other Mismatches Reduce qPCR Assay
qPCR REACTIONS
STATISTICAL ANALYSIS
Reactions containing 10 000 template molecules were performed on a Bio-Rad CFX384 instrument (Bio-Rad Laboratories) with an automated plate-loading system. On each plate, we ran each primer-pair/template combination in triplicate and included a 15-point, 2-fold calibration curve based on the original perfect-match combination. We used 5 qPCR master mixes according to the respective manufacturer’s protocols: EvaGreen qPCR Mix Plus, from Solis BioDyne (mix A); SsoFast EvaGreen Supermix, from Bio-Rad (mix B); SsoAdvanced SYBR Green Supermix, from Bio-Rad (mix C); LightCycler 480 SYBR Green Master, from Roche (mix D); and a custom-made Eurogentec mix (mix E). The Eurogentec custom mix consisted of Two Step qRT-PCR MasterMix for SYBR Green 1 (with HotGoldStar enzyme, 3.5 mmol/L MgCl2, but no 6-carboxy-X-rhodamine). Cq values were measured by the threshold method and calculated with CFX Manager software (version 1.6). Amplification efficiency was calculated with the LinRegPCR software package (version 12.7) (8 ).
The R statistical package was used for one-way ANOVA and post hoc testing (pairwise t-test). P values ⬍0.05 were considered significant.
MISMATCH SIMULATIONS
For three 20-base primers, we generated all combinations (491 007) with up to 4 mismatches in the 16-base region at their 3⬘ ends. The IDT Biophysics calculator (http://biophysics.idtdna.com/) was used to calculate differences in annealing temperature and Gibbs free energy for each mismatch combination [5⬘-AGTCTCGG ATTAGTCAAGTC-3⬘(58.94 °C),5⬘-CAGTACCATTGT CGAAGACA-3⬘ (60.00 °C), and 5⬘-CCCTCCCATTTTC TCAGGTT-3⬘ (62.67 °C)]. We evenly divided 440 randomly selected assays among the 3 primer pairs and performed qPCR reactions with 5000 template molecules and the SsoAdvanced SYBR Green Supermix (Bio-Rad). MISMATCHES IN BOTH PRIMERS
For each of the 3 sets described above, we selected 20 forward primers and evenly distributed them over the number of mismatches. In addition, we designed 20 reverse primers harboring 1– 4 mismatches for each of the primer sets. We used 5000 template molecules and the SsoAdvanced SYBR Green Supermix (Bio-Rad) to perform qPCR reactions for all possible forward/reverse combinations within each set. CONCENTRATION DEPENDENCE REACTIONS
We selected 21 forward/reverse primer combinations from the 3 sets described above. To test each of these combinations, we used the SsoAdvanced SYBR Green Supermix (Bio-Rad), a 65-cycle protocol, and a 7-point, 10-fold calibration curve ranging from 20 to 20 ⫻ 106 template molecules per reaction.
Results POSITIONAL EFFECT OF A SINGLE MISMATCH
To determine the effect of mismatches on qPCR amplification, we introduced specific nucleotide changes into both the template and forward primers [see RDML file 1 (for results) and Table 3 (for mismatch frequencies) in the online Data Supplement]. Fig. 2A and Fig. 1 in the online Data Supplement show that the number of mismatches has a clear effect on dCq (the difference between the Cq for the mismatch reaction and the mean Cq of the corresponding perfect-match reactions), the SD of the replicates, amplification efficiency, and end point fluorescence (all P values ⬍0.0043). When we focused on reactions with exactly 1 mismatch in the primer-annealing site and evaluated the impact of the mismatch position on dCq, we observed identical trends across all master mixes (Fig. 2B; see Fig. 2 in the online Data Supplement), with dCq and SD values decreasing with increasing distance of the mismatch from the primer’s 3⬘ end. The greatest effect occurred for mismatches at the 3⬘ terminal base (P ⫽ 2.2 ⫻ 10⫺16), with the mismatch having a dCq of 5 to 7 (32- to 128-fold difference) compared with the perfect match, depending on which master mix was used. Even with a mismatch at position 4, a dCq value of 2 or 3 (4- to 8-fold) could still be observed (Fig. 2B). The effect of position on end point fluorescence seemed to be master mix specific, and the difference was significant (P ⫽ 0.027) between position 0 and positions 3 and 4 for mixes A, B, D, and E. In addition, a marked reduction in both SD and variation in amplification efficiency were observed for mixes A, D, and E as the mismatch was moved away from the primer’s 3⬘ end (see Fig. 2 in the online Data Supplement). Finally, in the presence of a mismatch in the primer’s 3⬘ terminal base, the addition of a second mismatch within 5 bases of the first base significantly inhibited the amplification process (mean dCq between 7.93 and 12.15; 244- to 4545-fold difference; see Fig. 3 in the online Data Supplement). EFFECT OF THE TYPE OF MISMATCH AT THE 3ⴕ TERMINUS
To further dissect the effect of a mismatch at a primer’s 3⬘ terminal base, we focused on the type of mismatch and nucleotide. We first grouped mismatches by type of aromatic ring in the base to assess whether steric hindrance played a role in impeding qPCR amplification. For all master mixes, we noted a significant difference (P ⫽ 0.034) between the various mismatch types, with less favorable mismatches (purine/purine and pyClinical Chemistry 59:10 (2013) 3
Mix P
A < 2.2 × 10⁻¹⁶
MM no.
0
1
2
B
C
D
E
< 2.2 × 10⁻¹⁶
< 2.2 × 10⁻¹⁶
< 2.2 × 10⁻¹⁶
< 2.2 × 10⁻¹⁶
0
1
2
0
1
2
0
1
2
0
1
2
A dCq (between PM and MM rxns)
15
10
5
0
Mix P
A 9.12 × 10⁻¹¹
Distance 0 1 2 3 4
B 1.03 × 10⁻¹⁰
C 4.41 × 10⁻¹⁵
D < 2.2 × 10⁻¹⁶
E < 2.2 × 10⁻¹⁶
0 1 2 3 4
0 1 2 3 4
0 1 2 3 4
0 1 2 3 4
B dCq (between PM and MM rxns)
15
10
5
0
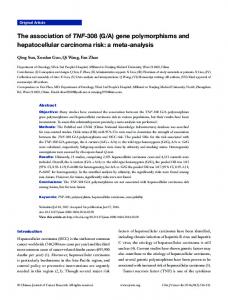
Fig. 2. dCq values for results of perfect-match (PM) and mismatch (MM) qPCR reactions (rxns) for the 5 master mixes. (A), dCq values as a function of the number of MMs in the last 5 bases at the primer’s 3⬘ end. (B), dCq values for of a single MM as a function of its distance relative to the primer’s 3⬘ end (0, 1, 2, 3, and 4 bases). (C), dCq values as a function of MM type: purine (pu) or pyrimidine (py). Median, interquartile range, outliers, and minimum and maximum values (excluding outliers) are represented in the box plots. Continued on page XX
4
Clinical Chemistry 59:10 (2013)
P = 1.4 × 10⁻³
C dCq (between PM and MM rxns)
P = 2.1 × 10⁻⁸
P = 5.7 × 10⁻¹³ P = 7.2 × 10⁻⁴
P = 8.5 × 10⁻⁶
py/py
P = 7.3 × 10⁻⁹
P = 1.5 × 10⁻⁷ P = 6.2 × 10⁻⁶
P = 7.8 × 10⁻⁴
15
pu/py
pu/pu
pu/pu
E < 2.2 × 10⁻¹⁶
py/py
pu/pu
pu/py
D 9.75 × 10⁻¹⁰
py/py
C 3.26 × 10⁻¹⁴ pu/py
B 6.60 × 10⁻¹³ py/py
py/py
pu/pu
pu/py
A 1.22 × 10⁻¹¹
P
pu/py
Mix
pu/pu
SNPs and Other Mismatches Reduce qPCR Assay
P < 2 × 10⁻¹⁶ P = 1.3 × 10⁻⁸
P = 1.5 × 10⁻¹³
P = 8.1 × 10⁻⁹
P = 6.7 × 10⁻⁵
10
5
0
Fig. 2. Continued.
rimidine/pyrimidine) leading to larger dCq values and reduced values for end point fluorescence. We observed similar trends for amplification efficiency and the Cq SD of the replicates, although the effects on these parameters were master mix dependent and the differences were not always significant. Together, these findings indicate that steric hindrance might play a role in mismatch-induced inhibition of the PCR (Fig. 2C; see Fig. 4 in the online Data Supplement). Our analysis of the nucleotide composition of mismatches at a primer’s 3⬘ terminus revealed similar effects across all of the master mixes (Fig. 3; see Fig. 5 in the online Data Supplement). In general, G/T, A/C, and C/T mismatches produced the smallest dCq values, whereas A/G and C/C showed the largest dCq values. We drew identical conclusions for the SD, with higher values for A/G and C/C mismatches and lower SDs for G/T, A/C, and C/T mismatches. SIMULATION OF THE EFFECT OF MISMATCHES ON ANNEALING TEMPERATURE
Given that our extensive experimental setup (8640 qPCR reactions; see Fig. 1) allowed analysis of the mismatch effect for only the last 5 bases at a primer’s 3⬘ end (we ignored infrequent mismatches farther from the 3⬘ end), we simulated the effect of ⱕ4 concurrent mismatches throughout the 16-base region at the 3⬘ end of a 20-base primer. This simulation allowed us to assess whether the positional effect of a mismatch could be
extrapolated to other primer locations and thus be used to predict how many simultaneous mismatches could be tolerated in a qPCR reaction. Fig. 4 shows that the difference in primer annealing temperature (dTm) (a mismatch always produces a lower Tm) increases with the number of mismatches. In addition, mismatches at the 3⬘ terminus tended to show smaller dTm values than mismatches located elsewhere. Although we found no additive temperature difference for internal adjacent mismatches, we did observe that the dTm became more pronounced as the distance between any 2 consecutive mismatches increased. We simulated 491 007 mismatch combinations, of which 484 562 (98.7%) had a Tm ⬎10 °C different from that of the perfect-match reactions (Fig. 4; see Fig. 6 in the online Data Supplement). To assess whether such differences affected qPCR performance, we tested 440 randomly selected primers with qPCR [see RDML file 2 and Table 3 (for mismatch frequencies) in the online Data Supplement]. The results showed that the number of mismatches was positively correlated with dCq. The presence of 4 mismatches blocked amplification almost completely. The exception was 4 internal adjacent mismatches, a result that is most likely attributable to their location near the primer’s 5⬘ end (Fig. 5). Although the data in Fig. 7B in the online Data Supplement suggest identical findings for 3-mismatch combinations, plotting of the dCq values for these combinations as a funcClinical Chemistry 59:10 (2013) 5
Mix P
A
B
C
D
E
A
B
C
D
E
4.50 × 10⁻¹⁰
< 2.2 × 10⁻¹⁶
< 2.2 × 10⁻¹⁶
< 2.2 × 10⁻¹⁶
< 2.2 × 10⁻¹⁶
< 2.2 × 10⁻¹⁶
8.79 × 10⁻¹
1.57 × 10−2 *
6.4 × 10−1
8.811 × 10⁻⁹
G/T C/T A/G A/C T/T G/G C/C A/A A/A C/C G/G T/T A/C A/G C/T G/T
A/A C/C G/G T/T A/C A/G C/T G/T
A/A C/C G/G T/T A/C A/G C/T G/T
A/A C/C G/G T/T A/C A/G C/T G/T
B
2.2
15 2.0 1.8 10 1.6 1.4
5
Amplification efficiency
dCq (between PM and MM rxns)
A
A/A C/C G/G T/T A/C A/G C/T G/T
A/A C/C G/G T/T A/C A/G C/T G/T
A/A C/C G/G T/T A/C A/G C/T G/T
A/A C/C G/G T/T A/C A/G C/T G/T
A/A C/C G/G T/T A/C A/G C/T G/T
A/A C/C G/G T/T A/C A/G C/T G/T
G/T C/T A/G A/C T/T G/G C/C A/A
1.2 1.0
0
14k
D
5
12k
4
10k 8k
3 6k 2 4k 1
2k 0 A/A C/C G/G T/T A/C A/G C/T G/T
A/A C/C G/G T/T A/C A/G C/T G/T
A/A C/C G/G T/T A/C A/G C/T G/T
A/A C/C G/G T/T A/C A/G C/T G/T
A/A C/C G/G T/T A/C A/G C/T G/T
A/A C/C G/G T/T A/C A/G C/T G/T
A/A C/C G/G T/T A/C A/G C/T G/T
A/A C/C G/G T/T A/C A/G C/T G/T
A/A C/C G/G T/T A/C A/G C/T G/T
A/A C/C G/G T/T A/C A/G C/T G/T
0 A/A C/C G/G T/T A/C A/G C/T G/T
P
End point fluorescence
dCq (between replicate rxns)
C
A/A C/C G/G T/T A/C A/G C/T G/T
1.86 × 10⁻¹
3.78 × 10⁻⁸
1.75 × 10⁻⁹
8.16 × 10⁻⁷
2.17 × 10⁻¹⁰
MM type
2.38 × 10⁻⁸
1.66 × 10⁻¹⁰
2.80 × 10⁻⁶
2.40 × 10⁻¹⁵
< 2.2 × 10⁻¹⁶
MM type
Fig. 3. dCq values between results for perfect-match (PM) and mismatch (MM) reactions (rxns) as a function of MM type and master mix. See y axis label of each panel for the parameter analyzed. Matrices at the top and bottom of the panels show intergroup comparisons with significant differences (P ⬍ 0.05, gray). P values were calculated with a pairwise t-test. Median, interquartile range, outliers, and minimum and maximum values (excluding outliers) are represented in the box plots.
tion of the position of the mismatch closest to the 3⬘ end showed that the effect on qPCR becomes smaller as the distance of the mismatch increases (see Fig. 7C in the online Data Supplement). Plotting the dCq values for 1-mismatch and 2-mismatch combinations showed similar trends: an inverse association between dCq value and mismatch distance, with more pronounced inhibition apparent for 2-mismatch combinations, even when they were located near the 5⬘ end (see Fig 7, A and B, in the online Data Supplement). Mismatch-driven inhibition of amplification caused by a single mis6
Clinical Chemistry 59:10 (2013)
match was high for position 0 only and became almost negligible for position 8 and higher. EFFECT OF MISMATCHES IN BOTH PRIMERS
We extended the experiment described above by assessing how qPCR reactions behave when both primers harbored one or more mismatches. For this experiment, we randomly selected 20 forward primers (evenly distributed over the number of mismatches) for each set. We also designed 20 reverse primers (containing 1 to 4 mismatches) for each of the sets. We then
dTm (between PM and MM rxns, °C)
60
50 1 MM 2 MMs 1
carried out qPCR reactions for all forward/reverse combinations [1200 reactions; see RDML file 3 (results) and Table 3 (mismatch frequencies) in the online Data Supplement]. As we expected, the data showed a positive correlation between the total number of mis3 MMs 10
10
1
...
...
5 XN 52XN 52XN 2XN1 10 10 10 XN x XN y XN z XN1 [x,y,z > 1, and at least x,y, or z < 5]
10 ... XN 10 x XN y XN z XN1 [x,y,z ≥ 1, and 7 ≤ (x+y+z) ≤ 9, and at least x,y, or z = 1]
10
... XN x5XN y5XN z5XN1 [x,y,z ≥ 1, and 2 ≤ (x+y+z) ≤ 4, and at least x,y, or z = 1]
... XNXNXNXN 1
...
...
10 10 XN 10 x XN y XN z XN1 [x,y,z ≤ 6, and 5 < (x+y+z) ≤ 7, and at least x,y, or z = 0] 20 XN x20XN y XN z20XN1 [x,y,z ≤ 11, and 10 < (x+y+z) ≤ 12, and at least x,y, or z = 0]
... XN x5XN y5 XN z XN1 [x,y,z ≤ 2, and 1 < (x+y+z) ≤ 3, and at least x,y, or z = 0]
5
... XN x XN y1 XN z XN1 [x,y,z ≤ 1, and 0 < (x+y+z) ≤ 1]
1
... XXXXN 1
... XN x XN y XN z X [x,y,z > 1, and at least x,y, or z < 5]
10
... XN 52XN 52 XN 2 X
5
... XN x20XN y20XN z X [x,y,z ≥ 1, and 12 ≤ (x+y+z) < 14, and at least x,y, or z = 1]
20
10 10 ... XN 10 x XN y XN z X [x,y,z ≥ 1, and 7 ≤ (x+y+z) < 9, and at least x,y, or z = 1]
... XN x5XN y5 XN z5 X [x,y,z ≥ 1, and 2 ≤ (x+y+z) < 4, and at least x,y, or z = 1]
... XNXNXNX
...
...
10 10 XN 10 x XN y XN z X [x,y,z ≤ 6, and 5 ≤ (x+y+z) < 7, and at least x,y, or z = 0] 20 20 XN 20 XN XN z X [x,y,z ≤ 11, and 10 ≤ (x+y+z) < 12, and at least x,y, or z = 0] x y
... XN x5 XN y5 XN z X [x,y,z ≤ 2, and 1 ≤ (x+y+z) < 3, and at least x,y, or z = 0]
5
... XN x1 XN y1 XN z X [x,y,z ≤ 1, and 0 ≤ (x+y+z) < 1]
... XXXX
... X ... X ... X ... NN
10 ... XN 10 6 XN 6 XN
... XN 52 XN 52XN
... XN 1 XN 1 XN
... XX ... XN
10 ... XN 10 6 XN 6 X
... XN 52 XN 52 X
... XN 1 XN1 X
... XX ... X
... X ... XN 1
... XN 1 X
... XX
... XN 1
... NX
SNPs and Other Mismatches Reduce qPCR Assay
4 MMs
4 MMs
3 MMs
2 MMs
1 MM
40
30
20
10
0 MM type
Fig. 4. dCq values between results for perfect-match (PM) and mismatch (MM) qPCR reactions (rxns) for Tm.
All results were grouped according to MM position (all internal or ⱖ1 at the 3⬘ end), number of adjacent MMs, and minimum and maximum number of nucleotides between any 2 consecutive MMs. N, nucleotide A, C, G, or T; X, mismatched nucleotide; N xy , a sequence of at least x nucleotides and a maximum of y nucleotides; Nx , a sequence of at least x nucleotides. Median, interquartile range, outliers, and minimum and maximum values (excluding outliers) are represented in the box plots.
matches for the 2 primers and the extent of qPCR inhibition (see inset in Fig. 6), with ⱖ5 mismatches blocking amplification almost completely. When we analyzed the number of mismatches in the 2 primers separately (Fig. 6), we found that introducing a single
Clinical Chemistry 59:10 (2013) 7
dCq (between PM and MM rxns)
1 MM
8 2 MMs
Clinical Chemistry 59:10 (2013) 3 MMs
5 30
0
A
3.0
2.5 0 1 2 3 No. of MMs Cq
SD 15 4 MMs
10 35
25
4
B
2.0
1.5
1.0
0.5
0.0 MM type
Fig. 5. dCq values between results for perfect-match (PM) and mismatch (MM) qPCR reactions (rxns) for mismatch number and position, and SD. (A), dCq values between results for PM and MM reactions as a function of mismatch number and position for 440 randomly selected assays. Inset shows Cq values as a function of the MM number. (B), SDs of the Cq values of replicate reactions as a function of MM number and position for 440 randomly selected assays. All results were grouped according to MM position (all internal or ⱖ1 at the 3⬘ end), number of adjacent MMs, and minimum and maximum number of nucleotides between any 2 consecutive MMs. N, nucleotide A, C, G, or T; X, mismatched nucleotide; N xy , a sequence of at least x nucleotides and a maximum of y nucleotides; Nx , a sequence of at least x nucleotides. Median, interquartile range, outliers, and minimum and maximum values (excluding outliers) are represented in the box plots. 1
= 0]
10
10
1
...
[x,y,z ≤ 11, and 10 < (x+y+z) ≤ 12, and at least x,y, or z = 0]
...
...
5 XN 52XN 52XN 2XN1 10 10 10 XN x XN y XN z XN1
[x,y,z > 1, and at least x,y, or z < 5]
10 ... XN 10 x XN y XN z XN1 [x,y,z ≥ 1, and 7 ≤ (x+y+z) ≤ 9, and at least x,y, or z = 1]
10
... XN x5XN y5XN z5XN1 [x,y,z ≥ 1, and 2 ≤ (x+y+z) ≤ 4, and at least x,y, or z = 1]
... XNXNXNXN 1
20 XN x20XN y XN z20XN1
10 ... XN 10 x XN y XN z XN1 [x,y,z ≤ 6, and 5 < (x+y+z) ≤ 7, and at least x,y, or z = 0]
10
... XN x5XN y5 XN z XN1 [x,y,z ≤ 2, and 1 < (x+y+z) ≤ 3, and at least x,y, or z = 0]
5
... XN x XN y1 XN z XN1 [x,y,z ≤ 1, and 0 < (x+y+z) ≤ 1]
1
... XXXXN 1
... XN x XN y XN z X [x,y,z > 1, and at least x,y, or z < 5]
10
... XN 52XN 52 XN 2 X
5
... XN x20XN y20XN z X [x,y,z ≥ 1, and 12 ≤ (x+y+z) < 14, and at least x,y, or z = 1]
20
10 10 ... XN 10 x XN y XN z X [x,y,z ≥ 1, and 7 ≤ (x+y+z) < 9, and at least x,y, or z = 1]
... XN x5XN y5 XN z5 X [x,y,z ≥ 1, and 2 ≤ (x+y+z) < 4, and at least x,y, or z = 1]
... XNXNXNX
...
...
...
5 XN x5 XN y5 XN z X [x,y,z ≤ 2, and 1 ≤ (x+y+z) < 3, and at least x,y, or z = 0] 10 10 XN 10 XN XN z X [x,y,z ≤ 6, and 5 ≤ (x+y+z) < 7, and at least x,y, or z = 0] y x 20 20 XN 20 x XN y XN z X [x,y,z ≤ 11, and 10 ≤ (x+y+z) < 12, and at least x,y, or z
... XN x1 XN y1 XN z X [x,y,z ≤ 1, and 0 ≤ (x+y+z) < 1]
... XXXX
... X ... X ... X ... NN
10 ... XN 10 6 XN 6 XN
... XN 52 XN 52XN
... XN 1 XN 1 XN
... XX ... XN
10 ... XN 10 6 XN 6 X
... XN 52 XN 52 X
... XN 1 XN1 X
... XX ... X
... X ... XN 1
... XN 1 X
... XX
... XN 1
... NX
SNPs and Other Mismatches Reduce qPCR Assay
10
5 dCq (between MM and PM rxns)
dCq (between MM and PM rxns)
15
0
no MM rxn
0/0
0/1
0/2
0/3
0/4
1/1
1/2
MM in single primer
1/3
1/4
0
1
Total MMs in both primers 2 3 4 5 6 7
8
15 10 5 0
2/2
2/3
2/4
3/3
3/4
4/4
MMs in both primers
Fig. 6. dCq values between results for perfect-match (PM) and mismatch (MM) qPCR reactions (rxns) as a function of the number of MMs in each primer. Inset shows dCq between results for PM and MM rxns as a function of the total number of mismatches in both primers.
mismatch in the mismatch-free primer (the other primer harbored 1 to 4 mismatches) caused only a small additional inhibitory effect. This effect became much more pronounced when ⱖ2 mismatches were inserted into the mismatch-free primer. Three mismatches in combination with ⱖ2 mismatches in the other primer blocked amplification almost completely, whereas for 4 mismatches, a single mismatch in the other primer was sufficient to achieve a similar effect. To assist the reader in visualizing the correlations between dCq and the number of mismatches, we have included a video in the online Data Supplement that summarizes amplification plots, dCq values, and positions of mismatches in the 2 primers. CONCENTRATION DEPENDENCE OF THE MISMATCH EFFECT
In the previous experiments, we tested the effect of mismatches on the amplification reaction for fixed amounts of input DNA (10 000 molecules per reaction); however, because input concentration varies between reactions, samples, and experiments, its impact on the mismatch effect must be determined. We assessed the effect of input concentration by randomly selecting 21 forward/reverse primer combinations from those used in the experiment described above and performing a 7-point, 10-fold dilution series. The results (see RDML file 4 and Table 3 in the online Data Supplement) showed that the mismatch effect was
concentration independent for single-mismatch reactions across all dilution points tested (see Fig. 8 in the online Data Supplement ). In contrast, concentration independence failed at lower input concentrations for higher numbers of mismatches. Although the degree of deviation from perfect-match/ mismatch linearity depended on the specific nature of the mismatches, increasing the number of mismatches in a single primer from 2 to 3 increased the range of dilution points where concentration dependency was lost (20 molecules per reaction for 2 mismatches vs. 20 –2000 molecules per reaction for 3 mismatches). We observed no correlation between perfect-match and mismatch reactions for combinations harboring 4 mismatches in a single primer, a finding that confirmed previous results that mismatches of this type completely block the amplification reaction. Discussion The increasing number of known SNPs and the growing challenge of finding primers that anneal to SNPfree target regions prompted us to evaluate the potential effects of primer mismatches on a qPCR reaction. Measurements might be influenced by the presence of primer-annealing mismatches, leading to erroneous results. A false-positive decrease in gene expression or copy number loss might be caused by inefficient anClinical Chemistry 59:10 (2013) 9
nealing and amplification in the case of a primer– template mismatch. We have assessed the effects of mismatch position and type on qPCR performance. Although such effects have previously been reported, the results were based on limited numbers of reactions, yielding low statistical power. In addition, not all primer positions were assessed, and only a single master mix was evaluated. Any generalizations derived from such limited results would therefore be questionable. We focused on mismatches located in the last 5 bases at a primer’s 3⬘ end, where we predicted the impact on qPCR assay performance would be the most pronounced. Because our experimental setup introduced only small differences in primer GC content and amplicon length, we observed no effects of these features on any of the studied parameters (see Supplementary Results in the online Data Supplement). The lack of an association between primer Tm or GC content and Cq value (especially for multiple-mismatch combinations, for which the impact on qPCR performance can be substantial) was expected, because the effect of 1 mismatch on primer Tm or the GC percentage could be countered by the effect of another mismatch. For example, an A-to-G mismatch combined with a C-to-T mismatch at the 3⬘ terminus would not change the primer’s overall GC content and would have only a minor effect on its Tm, but such a change would inhibit the amplification reaction substantially. Our results point to a smaller dCq as a single mismatch is moved farther from the 3⬘ end, a finding in accord with previous studies (2, 4 ). The effect of position was greatest for mismatches at the 3⬘ terminus, and steric hindrance due to the purine/purine or pyrimidine/pyrimidine context of these mismatches might play some role in impeding qPCR amplification. We were not able to confirm the observation that primers ending with a 3⬘ A nucleotide amplified least efficiently (data not shown) (9 ). Despite the lack of an association between a primer’s GC content or Tm and its Cq, we extended our results to a larger number of mismatches and to mismatches located closer to the 5⬘ end. Our analysis of the number of mismatches, their location in the primer, and the high degree of amplification inhibition observed for mismatches at the 3⬘ terminus has made it possible to predict which mismatch combinations might produce nonspecific amplification due to imperfect annealing of a primer to homologous sequences. Our analyses showed that for primer pairs harboring mismatches in only one of the primers, the presence of 4 mismatches blocked qPCR amplification almost completely. In contrast, qPCR inhibition with 3 mismatches was less pronounced and depended on the mismatch position in the primer-annealing site. The data also revealed that mismatch-induced inhibition was independent of template concentration for primer 10 Clinical Chemistry 59:10 (2013)
pairs harboring a maximum of 1 mismatch per primer, whereas concentration independence failed at greater dilutions (ⱕ2000 molecules per reaction) in the presence of ⬎1 mismatch in a single primer. Concentration independence disappeared completely when at least one of the primers harbored 4 mismatches. Given the extent of the mismatch effect, we expected this result, because more cycles are required in low-concentration reactions harboring multiple mismatches to allow incorporation of the mismatches into a number of new template molecules sufficient to approximate normal amplification, compared with a single mismatch or reactions carried out at higher concentrations. In conclusion, our study clearly indicates that quantitative nucleic acid measurements are affected by the number and positions of mismatches in primerannealing sites. The extent of qPCR inhibition is negatively correlated with the distance of a mismatch from the primer’s 3⬘ end. Furthermore, the effect of mismatches at the 3⬘ terminus is dependent on the nucleotide composition of the mismatch and cannot be explained completely by steric hindrance. Assessing how qPCR reactions behave when both primers harbor mismatches can aid in optimizing assay-specificity analysis. Our data show that 4 mismatches in a single primer block amplification almost completely, whereas 3 mismatches in one of the primers must be combined with at least 2 mismatches in the other primer to achieve the same extent of inhibition. These results suggest that avoiding up to 3 mismatches when testing the specificity of a primer in silico during the primer design process can largely prevent the generation of nonspecific assays. It is difficult to define fail-proof rules for primer design with respect to the tolerable degree of mismatch. Ideally, primers should be completely SNP free; however, with a mean of 1 SNP per 58 bp in the genome, or 1 SNP per approximately 20 bp in the exome (based on dbSNP release 137), that standard is often impossible. Given the degree of mismatch tolerable during primer design, evaluations of primers designed in silico against the most recent SNP database (including SNPs with minor-allele frequencies of ⬍1%) will greatly increase the probability of designing reliable primer sets. Such evaluations would exclude primers harboring SNPs or mismatches in the last 5 bases at a primer’s 3⬘ end. Finally, although more testing is needed, the results of our experiments could be used to model the effect of single mismatches (in one or both primers), making feasible the regular use of qPCR reactions with singlemismatch primers. Considering that we evaluated 5 different master mixes, ⬎1000 primer–template combinations, and a total of 10 720 reactions, our conclusions are likely to be robust and aid in improving the design of PCR primers.
SNPs and Other Mismatches Reduce qPCR Assay
Author Contributions: All authors confirmed they have contributed to the intellectual content of this paper and have met the following 3 requirements: (a) significant contributions to the conception and design, acquisition of data, or analysis and interpretation of data; (b) drafting or revising the article for intellectual content; and (c) final approval of the published article.
Employment or Leadership: None declared. Consultant or Advisory Role: None declared. Stock Ownership: None declared. Honoraria: None declared. Research Funding: Ghent University IOF StarTT (F2011/IOFStarTT/148) and Bijzonder Onderzoeks Fonds (BOF). Expert Testimony: None declared. Patents: None declared.
Authors’ Disclosures or Potential Conflicts of Interest: Upon manuscript submission, all authors completed the author disclosure form. Disclosures and/or potential conflicts of interest:
Role of Sponsor: The funding organizations played no role in the design of study, choice of enrolled patients, review and interpretation of data, or preparation or approval of manuscript.
References 1. Whitcombe D, Theaker J, Guy SP, Brown T, Little S. Detection of PCR products using self-probing amplicons and fluorescence. Nat Biotechnol 1999;17:804–7. 2. Wu JH, Hong PY, Liu WT. Quantitative effects of position and type of single mismatch on single base primer extension. J Microbiol Methods 2009; 77:267–75. 3. Huang MM, Arnheim N, Goodman MF. Extension of base mispairs by Taq DNA polymerase: implications for single nucleotide discrimination in PCR. Nucleic Acids Res 1992;20:4567–73.
4. Boyle B, Dallaire N, MacKay J. Evaluation of the impact of single nucleotide polymorphisms and primer mismatches on quantitative PCR. BMC Biotechnol 2009;9:75. 5. Whiley DM, Sloots TP. Sequence variation in primer targets affects the accuracy of viral quantitative PCR. J Clin Virol 2005;34:104 –7. 6. Markham NR, Zuker M. UNAFold: software for nucleic acid folding and hybridization. Methods Mol Biol 2008;453:3–31. 7. Rozen S, Skaletsky H. Primer3 on the WWW for
general users and for biologist programmers. Methods Mol Biol 2000;132:365– 86. 8. Ruijter JM, Ramakers C, Hoogaars WMH, Karlen Y, Bakker O, van den Hoff MJB, et al. Amplification efficiency: linking baseline and bias in the analysis of quantitative PCR data. Nucleic Acids Res 2009; 37:e45. 9. Ayyadevara S, Thaden JJ, Shmookler Reis RJ. Discrimination of primer 3⬘-nucleotide mismatch by Taq DNA polymerase during polymerase chain reaction. Anal Biochem 2000;284:11– 8.
Clinical Chemistry 59:10 (2013) 11