Recovery
of the Human
Striatal
Signal in a
Slice Oriented Positron Emission Tomograph Vesna Sossi, Kenneth Thomas J. Ruth
R. Buckley,
Barry J. Snow, James E. Holden,
K. Scott Morrison,
Brian D. Pate and
University ofBritish Columbia/TPJUMF Positron Emission Tomography, Vancouver, Britirh Columbia, Canada and Department ofMedical Physics, University of @V@rconsin, Madison, @V@sconsin
The human striatum is small enough for partial volume ef fects to be important when imaged in positron tomographs with slice widths 10 mm or greater. The combination of inter slice distance and slice width in such tomographs results in an axial undersampling of the striatal activity which intro duces the additional problem of variation of axial recovery as a function of position of the striatum along the tomograph axis. Using striatal phantoms, we have developed a method that corrects the recovered striatal signal to a maximum value equivalent to that measured when the object is can tered with respect to a slice. This makes the recovery inde pendant of the axial position of the striatum. The method also provides an estimate of the total striatal activity by integrating the axial image intensity distribution along the tomograph axis. The method is able to detect and correct for relative axial tilt of the left and right striatum. We applied it to 26 human [18F]-6-L-fluorodopa scans and obtained an average uptake rate constant k value of 0.25 ±0.05 mI/min/striatum and a left to right k value percentage asymmetry of 0.1% ± 6.3%.
J NucI Med 1993;34:481-487
he finite resolution of PET tomographs causes an underestimation in the measurement of the radiotracer intensity for objects comparable to or smaller than the tomograph resolution element (partial volume effect) (1). An inter-slice distance larger than about half the size of an imaged object further introduces a variation of the axial contribution to the partial volume effect caused by axial undersampling (2). As a consequence, the amount of signal recovered is a function of the object position with respect to the center of a slice and reaches a minimum value when the object is centered between two slices (2). The human striatum extends about 2 cm in the axial direction of the tomograph. Its image usually appears in three adjacent slices in a tomograph with a slice width of 10—15mm and a similar slice-center-to-slice-center sepa Received Apr. 24, 1992; revisIon accepted Oct. 14, 1992. For correspondence or reprints contact Vesna Sossi, TRIUMF 4004 Wes
brook Mall,Vancouver,BC,V6T2A3Canada.
Human Striatal Signal in PET • Sossi at al.
ration. The combination of the values of these parameters is such that the recovery varies significantly along the tomograph axis. Striatal activity measured from a single slice is therefore not necessarily representative of either the true concentration of the tracer in the striatum or the total tracer in that region. To estimate consistently the true concentration and the total striatal activity, we have developed a method that overcomes the dependence of the signal recovery on axial position as well as corrects for the relative axial tilt of the
two striata. The method is based on defining axial image intensity distribution curves for the left and right striatum separately. These are obtained by fitting Gaussian curves
to image intensity samples obtained by scanning in three axial positions separated by approximately a third of the inter-slice distance. The ratios between the image inten sity measured in the selected slice and the peak of the axial activity
distributions
are then
used
to correct
the
measured values to the peak values. The total image intensities for the left and right striatum are estimated from the integral along the tomograph axis of the axial image intensity distributions. This method is applicable to any situation where the results suffer from undersampling. In the case of human
and animal studies, this approach is applicable to situa tions in which the poorly recovered anatomical structure is distinguishable at high contrast from the surrounding tissue and there is a relatively stable time course of the radiotracer. The method was validated with phantom studies and then applied to 26 human [18F]-6-Lfluorodopa scans (age range 45 ±23 yr).
METHODS Stilatal Phantom Studies The scans were performed on the UBCITRIUMF PETT-VI tomograph (3). The PETT-VI has four rings of detectors yielding four “true― and three “cross― slices with a slice-center-to-slice center separation(interslice distance)of 14.4mm. The average in-plane spatial resolution is 9.2 mm FWHM and the average slice width is 11.6 mm FWHM. For this tomograph, the slice spacing is larger than the slice width, which amplifies the undersampling problem. Two glass human striatum phantoms were constructed using
481
throughout the field of view (FOV). The phantoms,
surrounded
by air, were positioned in the center of the FOV about 5 cm apart radially to simulate the human inter-striatal distance. One phantom was moved axially with respect to the other in five steps 4 mm apart to simulate various degrees of axial tilt. For each relative position of the two phantoms,
three scans were
taken with the second and third being 7 and 10.5 mm apart from the first, respectively. The collected data were analyzed as before.
Human Studies On the basis of the results of the phantom studies (see Re
sults),wemodified ourhumanscanning protocolforhumanFD
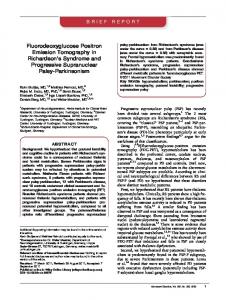
FIGURE 1. Glassstriatalphantom. Thetotalvolumeisabout studies (3). In order to optimally position the subject for the 10 ml.
emission scans, two transmission
a postmortem specimen as a model (Fig. 1). The phantoms had two compartments with volumes and dimensions similar to the caudate and putamen, the two main nuclei that form the stria tum. Four series of measurements
were then performed
with
only the last series using both striatal phantoms. For all studies, other than those performed with phantoms in air, transmission
taming
scans were performed with a ring source con
@Geto permit a measured correction for attenuation.
The transmission
scan was substituted
by a blank scan per
formed with the ring source for the phantom studies performed in air. In the first series, we defined the tomograph response to the striatal phantom signal. One phantom was filled with an aqueous solution containing approximately 2.5 MBq of ‘8F activity and suspended in air. The phantom was placed at about 2 cm from the axial midline to simulate the position of the striatum within the human brain. The phantom was then scanned in 30 axial positions 1 mm apart. At each position, a 1-mm scan was per formed and the images reconstructed. The total number of
events in a region of interest (ROl) totally encompassing the striatal phantom image was recorded for each step and corrected for radioactive decay. The second series of experiments was designed to investigate the effect of background
activity and consequently
contrast on
scans were first performed at
positions7 mm apart axially and sagittalprofileswere recon structed from the data. A “home― position in which the dy namic emission scan sequence would be performed was chosen from the transmission scan results to be that in which the striata appearedto be better centeredwith respect to a “true― slice. Seventy minutes after FD injection, when the striatal signal plateaued, emission scans taken at two additional axial positions were interleaved with those taken in the home position yielding a total of thirteen 10-mm emission scans. The resulting sequence
is described in Table 1. The resulting axial sampling was thus increased by a factor of three as determined from the phantom studies (see Results), and
unequally spaced with one 7-mm and two 3.5-mm steps (Figs. 3 and 4). The transmission to the respective
emission
scan taken in the nearest axial position scan was used in the reconstruction
of the images. The maximum axial displacement between an emission and a transmission scan was 3.5 mm which, we found, did not introduce a significant error.
Background and striatal ROIs were placed on three adjacent slices. The size of the striatal ROIs was about 10 cm2 to ensure
inclusionof moststriatalactivity, while the size of the ROIs placed on the cortical region (background cm2 (3).
ROI) was about 12
ANALYSIS
the tomograph response to the striatal signal. The phantom was
Phantom Studies
placed in a cylindrical phantom,
Figure 2 shows data from the scanning of a single striatal phantom in air (first phantom study) and demon strates the basic approach that is used to analyze these data and all subsequent phantom data and which in turn provides the basis for the analysis of the human data. In Figure 2A, the values of image intensity summed over the
20 cm diameter, filled with an
aqueous ‘8F solution to simulate the surrounding medium in brain scans. The concentration ratio between the background activity and the activity in the striatal phantom was approxi mately 1:10. A similar sequence of 30 scans was performed. Transmission scans were performed at each axial location and the images reconstructed. ROIs were placed on the striatal phantom images as before and additional ROIs were placed on the uniform background.
The total number of events recorded in
each ROl was corrected for radioactive decay. Third, we investigated
the effect of axial orientation
of the
striatum on the measurement of the striatal signal. The phantom was rotated along the sagittal axis by 20° and scanned in air. An analogous sequence of 30 scans was performed and treated as above. The fourth series of experiments
was performed
to test the
TABLE I Transmission and Emission Scan Locations and Sequence
-
EmissionTransmissionscan numberscan
Position1 (home) Position2 Position3
1-7,9, 11 8, 10, 12 13
number Ti or T2 T2 or Ti
sensitivity of the method for the detection of axial tilt between the two striata due to head tilt, etc. Both striatal phantoms were filled with an aqueous solution containing about 2.1 MBq of ‘8F Position1 and 2 are 7 mm apart;position3 is eitherin between activity and suspended on parallel rods extending axially positions1 and 2 or 3.5 mm on eitherside.
482
The Journal of Nuclear Medicine • Vol. 34 • No. 3 • March 1993
I
Stria@a1
distribution had a Gaussian shape and was fitted with a Gaussian function of the form:
Phantpm
a)
•IS
2400
•
•.
•
•
•
@
@
•
a
1200
U
0 U
.
.
600 0@0
@
0 15.5
0
Do
0
• 0 0 0• 0 •
1800
. @
y = ypeakX exp ( —(x —
0
0
.
001u
16.2
0
0
0
0
0 0 00
where ypeak @5 the peak amplitude, x@is the center posi tion of the activity distribution of the imaged phantom
0
•
0
•
and c is a function of the FWHM of the curve (c =
0
•
FWHM2/(—4 ln (0.5))). c depends on the object size and
0
• 0
U.
axial slicewidth. Thesethree parameterswere allowed to vary for the fit.
@0 •.
,- 16.9 Bed Position
17.6 (cm)
18.3
Eq.1
19
In the case of the striatal phantom scanned in a water medium, the area of the background ROl was normalized
to the area of the striatal ROI and this total background intensity was subtracted from the total measured inten sity in the striatal ROl. This procedure was used to re produce the analysis used in human studies where the specific striatal activity is extracted from the intensity measured in the ROI around the striatum by subtraction of “background― cortical activity (3) (see Results; Hu man Studies). Again the data obtained in the above de scribed slice positions were fitted with the function of Equation 1 and the same three parameters determined. In the fourth study where both phantoms were imaged, 16.0
Slice
Position
16.9
(cm)
separateROIs were placed around the two phantom im
ages. Each series of three scans related to the same axial FIGURE 2. Axialdistribution datafromthestriatalphantom displacement of the two phantoms and yielded nine sam scannedin air. (a) Imageintensityrecordedin eachsliceas a ples (3 slices x 3 bed positions) of the axial activity function of bed position along the tomograph axis, with an arbi distribution. The image intensities were plotted as a func trary offset. Intensity units are proportional to tomograph cps/ tion of slice position as before and Gaussian curves AOl. “Cross― (circles)and “true― (squares)slices show approx imately equal response. The phantom is detectable in three (Equation 1) were fitted to the data of each striatal phan slices except when it is located exactly betweentwo slices. (b) tom. An arbitrary subset of the same data, chosen so that the mea surements do not spatially overlap with the appropriate axial Human Studies
offsetsincluded.The symbolsreferto the sameslicesas in a. Solid line is the Gaussian curve fit to the data (see text). The arrows indicatean exampleof image intensity recordedin three slices during the same scan.
pixels in the striatal ROI are plotted as a function of bed position at which the data were collected. Each point on the abscissa is thus associated with four plotted points
showing the response to the striatal phantom in each slice. The phantom always produced an image in three adjacent slices. As a result, three samples of the axial intensity distribution were obtained for each scanning position. Figure 2B shows a subset of the data from the first three slices plotted in Figure 2A, which were chosen so that the measurements would not spatially overlap. The data from the second of the three slices were replot ted with their original abscissa values. However, data from the first slice were shifted by one interslice distance (14.4 mm) to higher bed position values and those from the third slice were shifted by the same interval to lower values in order to bring them into registration with re spect to the object. The resulting axial image intensity
Human Striatal Signal in PET • Sossi at al.
The analysis of the FD studies performed in our center is described by Martin et al. (3). The goal of this analysis is not to estimate mass-specific radioactivity concentra
tions, but rather the total specific signal from the whole striatum. This approach may provide an advantage over the alternative of determining the highest radiotracer con centration in the striatum, as the placement of ROIs on the images can be performed more objectively. The non specific striatal activity is accounted for by background correction on the assumption that the nonspecific striatal activity is comparable to the average cortical activity. The total, rather than average, pixel value from the ROIs placed on the cortical region after correction for any differences in region area is subtracted from the total summed pixel value in each striatal region for each slice. The resulting difference value represents the mean spe cific striatal radioactivity concentration times the number of pixels in each striatum. In the approach reported here, the axial direction is regarded as a third image dimension.
If the axial samplesare sufficiently close together, then integration over the axial direction with proper dimen sional scaling, followed by multiplication
by the trans
483
verse pixel area provides the desired estimate of the total radioactivity signal arising from the striatal structures. In the determination of the axial intensity distribution of the imaged striata, only those scans that were per formed later than 70 mm after injection when the striatal image intensity became relatively stable were used (scans
the distribution calculated at the position of the selected slice [Correction Factor 1 (CF1)]. CF1 = y@,@/y(selected slice) I@ = ‘meas X CF1.
A similar approach for the correction to the maximum 8—13). Six scansin the three above scanningpositions intensity in the case of a single slice was described by yielded 18 (6 x 3) samplesof the axial activity distribu tion in nine different axial locations (see Methods). These data were analyzed via a method analogous to that em ployed for the striatal phantom data.
RESULTS Phantom Studies The results of the first phantom study are summarized in Figures 2A and 2B. Figure 2A shows that the response
from a “true― (squares)and a “cross― (circles) slice is approximately the same in the PETF-VI and the variation of recovery with axial position is evident. A minimum of recovery, about 70% of the peak recovery, occurred when the phantom was located midway between the cen
ter of two slices, which is in agreementwith previous studies (2). The FWHM of the Gaussian curve (Equation 1) fitted to the data in Figure 2B (see Analysis) was found to be 1.8 cm. The results of the second study, where the striatal phantom was immersed in an aqueous background me dium of lower activity concentration, did not differ from those of the first study demonstrating that the presence of such a background and scattering medium did not signif icantly influence the axial intensity distribution. In the third study, where the striatum was rotated along the sagittal axis by approximately 20°,the FWHM of the curve increased to 1.9 cm, confirming the expec tation that the same FWHM could not be used for all PET measurements. In all cases, the Gaussian curve provided a good fit to the data, confirming that the tomograph resolution obscures structural details of the striatal phan tom. Correction
@
@
Method.
The consistent
Gaussian
shape of
the axial image intensity profile was the key to the devel opment of the correction method. A reliable fit of the axial image intensity distribution was achieved with a three-fold increase in axial sampling, yielding nine (3 slices x 3 bed positions) axial samples. The nine samples were obtained by scanning the phantom in three positions separated by approximately a third of the interslice dis tance. The fitting procedure determined the three variable parameters, x@and c, and thus completely defined the axial image intensity profile y (Equation 1). Once the Gaussian curve was defined, the image intensity mea sured in any slice (Ime,,@)could be corrected to the peak value (I@) by multiplying the measured value by the ratio between the peak value of the curve and the value of
484
Doudet et al. (5) and suggested by Links (6). The same axial image intensity distribution was used to estimate the total striatal activity by calculating the area under the curve. Once the distribution was obtained, the image intensity measured in a slice (Imeas) could be corrected to the integral value (INTEG) by multiplying the measured value by the ratio of the area underneath the curve and the value of the image intensity distribution calculated at the position of the selected slice [Correction Factor 2 (CF2)].
CF2 = area/y(selectedslice) INTEG = Ime55X CF2. This correction of the measured image intensity in a slice to the area underneath the curve will be henceforth re ferred to as the integration method.
Axial Tilt. The fourth series of experiments was de signed to test the ability of the method to detect and correct for relative axial tilt of the two striata. The axial step obtained from the relative peak positions was 4.24 ±
0.68mm,whichagreeswell with the4 mmaxialstepused in the experiment (Table 2). The same series of experi ments confirmed the reliability of the method by compar ing the values of the areas underneath the Gaussian curves obtained for each relative position of the two phantoms. The standard deviation of the values of the area under the Gaussian curves related to the moved phantom was 3%, indicating a consistent estimate of total TABLE 2 Comparison Between the Measured Relative Position of the Two Striatal Phantoms and the Shift of Axial Activity Distribution Peaks Expressed in Millimeters — 17
@*
@‘—s17 1p@k—8—9.23 ‘—S2!1A7t Im•asur•d(peak@1
Ii
t―521lA7t
@it
—44—3.995.24040.003.98443.923.92847.753.83Average
(
[email protected])4.24
±0.68
*RelatweaxialdistancebetweenthetwostriatalphantomsSi and 52. tRelativeaxialdistanceof the peaksof the axialactivitydistribu tions of the two striatal phantoms.
The Journal of Nuclear Medicine • Vol. 34 • No. 3 • March 1993
activity while the standard deviation of the values of the areas associated with the stationary phantom was 1%.
Human Studies
@
Integration Method Applied to Human Studies. The axial activity distribution was determined by fitting Gaus sian curves (Equation 1) to the data as in the striatal phantoms studies. The values x@, and c were deter mined for each striatum separately. The CF2 was deter mined from the slice that gave the highest yield in the home position. Since the shape of the Gaussian curve is only dependent on the object size for a given tomograph, the same correction factor could be applied to all scans that were part of the dynamic sequence, yielding for each scan (i) a scaled area:
INTEG@= areaX ((Imeas)@/y(selected slice)). Eq. 2 CF2 and CF1 are listed in Table 3. Typical results from a study of a human subject are presented in Figures 3 and 4. The background-corrected striatal image intensity in each
of the axial striatal image intensity distribution. In each case, the home position (dark squares) was not at the center of a tomograph slice demonstrating the need for correction for position. The eighteen samples do not always appear on the graph since in some cases the image intensity in the striatal ROIs of the slices close to the edge of the striatum are comparable to the intensity values in the background ROIs, possibly yielding a corrected striatal image intensity less than zero due to statistical effects. The analysis performed on 26 normal subjects yielded an average FWHM of the fitted Gaussian curves of 1.9 ± 0.2 cm, a value consistent with that obtained from the phantom studies.
Striatal Uptake Rate Constant k Values. The values of the striatal FD uptake rate constant k calculated from data analyzed with the integration method are presented in Table 3. The k value averaged over the left and right striatum is 0.25 ±0.05 ml/min/striatum. With a typical human striatal size of 13 ml (7), this value is equivalent to
sliceis plottedas a functionof slicepositionalongthe
0.019 ±0.004 ml/min/g, which is consistentwith the
tomograph axis for all six scans used in the determination
values reported by others (8).
TABLE 3 Correction Factors and Uptake Rate Constant k Values Subjectno.CF1 LCF1R*CF2LtCF2Rt(kJ1@*(kR)I@@kL'kR'P11
.972.200.360.280.870.54P21 .041 .031 .792.060.250.260.600.59P31 .111 .081 .960.260.260.610.54P41.031.081.711.720.160.140.350.32P51 .781 .001 .001 .650.260.270.630.71P61.191.211.892.490.270.290.500.50P71 .111 .821 .001
.012.692.290.260.250.560.54P81 .061 .730.290.270.820.64P91.551.172.452.210.140.140.360.36PlO1.02iii1.711.920.300.250.770.55P111.101.252.262.390.280.280.660.64P .011 .021 .721
.820.240.240.450.50P161.061.182.132.410.170.260.370.47P171.311.252.862.750.250.270.560.55P181.001.022.312.400.220.210.47 51 .051 .001 .891
.442.872.720.210.220.490.53P211.031.012.132.090.270.240.620.54P221 .521 .071 .990.270.250.580.54P231 .002.421 .012.021 .990.290.310.480.69P241 .051 .002.372.260.260.240.470.46P251 .021 .081 .032.001 .860.210.220.480.47P261 .022.482.200.290.290.680.68Average .081
*CorredionFactor1 left and right (seetext). tCorrectionFactor2 left and right (seetext). *k valuesobtainedwiththe integrationmethod(leftand right). ‘k valuesobtainedwith the methodin Reference6 (leftand right).
Human Striatal Signal in PET • Sossi et al.
485
sitivity of a cross slice with respect to a true slice. On the basis of our results we set those factors to one (Fig. 2). The average k value obtained with the method of Mar tin et al. (3) was 0.56 ±0.12 ml/min/striatum. The differ ence between the k average value obtained with the in tegration method 0.25 ±0.05 ml/min/striatum and the value obtained using this method by Martin et al. results from the fact that this latter method did not convert from counts/voxel to concentration. The percentage difference between the left and right striatum k value was found to be 3.0% ±9.2% which, assuming the true asymmetry distribution to be a normal distribution for a healthy pop ulation, differs from the value obtained from the integra tion method at a p level of 0.08. The absolute value of the percentage difference between the left and right striatum k value obtained with this method was found to be 6.1%
100000 a @
80000 *
.
±6.9%. @,60000•
.@ 40000
a
4,
....
a
— 20000
4, @g 4,
variable
exhibited
a significantly
larger
van
@. 23.5
24.5
25.5 26.5 Slice position (cm)
27.5
28.5
FIGURE 3. Imageintensity froma humanFDstudyfortheleft
@
This
ance (p < 0.01) when calculated from the k values ob tamed with this latter method as compared to the results obtained with the integration method, which confirms that the integration method provides a better correction for left-right asymmetry due to subject tilt.
and right striatum. The three scanning positions are separated by 3.5 and 7 mm. Each symbol indicates the image intensity measured in each of the three slices in the scans performed in the same axial position (see Methods). Dark squares represent the image intensitymeasuredwhen the scanswere performedin the “home― position. Missing points indicate an uncorrected striatal image intensitylowerthan the correspondingbackground image intensity (see Analysis). The intensity units are proper tional to tomograph counts/sec/ROl. The x-axis offset is arbi trary. The “home― position has a different offset with respect to the intensity distribution peak for the left and right striatum mdi cating the presence of tilt.
E100000
I
I
0
a .@ U)
80000
A
60000•
.@ 40000 I,
0
4, 20000@
a 22
23
24 Slice
25 position
26
27
2
(cm)
Side-to-side k Value Differences. The average value of the percentage difference between the left and right stri atum k value [% Diff = (L —R)/(L + R)] was 0.1% ± 6.3%. This value is compatible with zero, the expected value, since the left and right k values are expected to be the same for normal subjects. The absolute value of the percentage difference, related to the skewedness of the distribution and used in a previous study (9) as a possible variable that might discriminate between normal and af fected subjects, was 4.1% ±4.8%. Comparison
to the Method
by Martin
et al. In the
method described by Martin et al. (3), striatal and back ground ROIs analogous to the ones used with the inte gration method were placed on two slices only. Two background corrected striatal image intensities (see Anal ysis) from the two slices were then summed together with empirical scaling factors that accounted for relative sen
486
24 Slice
25 position
26 (cm)
FIGURE 4. FD studyof a differentsubjectpresented as in Figure3. The scanningpositionshere are separatedby 3.5 mm. Note that the study positionfalls on opposite sides of the inten sity distribution peak for the left and right striatum, again indicat
ing the presence of a tilt.
The Journal of Nuclear Medicine • Vol. 34 • No. 3 • March 1993
DISCUSSIONAND CONCLUSION Variation of axial recovery is a source of uncertainty when comparing intersubject data as well as when repeat edly scanning the same subject. Accurate repositioning is not always possible and usually difficult; even a small difference in the axial position of the striata can introduce artificial variations in the results. This method provides a simple solution to that problem that only adds one 10-mm scan to the standard protocol (3). The method can be applied either to define the concentration that would have been obtained had the object been centered with respect to a slice (CF1) or to estimate the total striatal activity
(CF2). Objectsizeinformationis alsoincludedin thislast correction factor since the FWHM of the Gaussian curve depends on the size of the imaged object. An additional source of uncertainty in the results is due to possible tilt of the subject's head. A difference in the measured stniatal image intensities between the left and right striata thus cannot necessarily be attributed to asymmetric FD uptake unless tilt can be defined. This method is able to detect tilt by defining the left and right
axial intensity distribution curves separately(Figs. 3, 4). In the presence of tilt, the home positions for the left and right stniatum have different offsets from the peak of the curve which results in different correction factors CF1 and CF2 for the left and right side. The correction factor CF1, for example, may differ by as much as 24% (see P9 inTable3). In summary, we have developed a solution to the prob lem of axial recovery variations along the tomograph axis, thus overcoming a dependence on signal recovery of
axial position. The correction is applied separatelyto the left and right striatal images, thus correcting
for possible
tilt andfunctionaldifferencesbetweenthe striata.In hu man and animal studies, this method can be applied when
Human Striatal Signal in PET • Sossi at al.
using radiotracers with a relatively stable time course. This method can be used in any situation where the object size combined with the tomograph slice width and spac ing hampers
a consistent
estimate
of concentration
or
total activity.
ACKNOWLEDGMENTS The authors wish to thank Dr. Michael Adam and Salma Jivan for the preparation of radiotracers; Poppy Schofield, Ter esa Dobko and Sandy Cooper for help with the scanning proto cols; and Dr. Michael Cordes with the analysis. This work was supported by a Program Grant from the Medical Research Council of Canada.
REFERENCES 1. HoffmanEl, Huang SC, Phelps ME. Quantitation in positron emission computed tomography. I Comp Assist Tomogr 1979;3:229-308. 2. Miller @FR,Wallis 3W, Grothe RA Jr. Design and use of PET tomographs:
the effect of slice spacing.I Nuci Med l990;31:1732—1739.
3. EvansB, HarropR,Heywood D,etal.Engineering developments of the UBC-TRIUMF
modified
PETl@ VI positron
emission
tomograph.
IEEE
Trans Nuc! Sci l983;NS-30:707-710.
4. MartinWRW,PalmerMR, Patlak‘5,Caine DB. Nigrostriatalfunctionin humansstudiedwith positronemissiontomography.Ann Neurol 1984;26: 535—542. 5. Doudet DJ, Miyake H, Finn RT, et al. 6-―-F-L-DOPAimaging of the dopamine neostriatal system in normal and clinically normal MPTP
treated rhesus monkeys. Erp Brain Res 1989;78:69—86. 6. Links JM. The influence of positioning on accuracy and precision in emission tomography. I Nuci Med 1991;32:l252—1253. 7. Pasik P, Pasik T, DiFiglia M. The internal organization of the neostriatum
in mammals.In Divac I, Oberg ROE, eds., Theneostriatum. New York: Pergamon Press; 1978:5—36. 8. Huang S-C, Yu D.C. Barrio JR. et al. Kinetics and modeling of L-6[1FJFluoro-dopa in human positron emission tomographic Cereb Blood Flow Metab 1991;11:898—913.
studies.
I
9. Cordes M, Sossi V, Snow BJ, Ruth Ti, CaIne D. Quantitative measure ments of the striatal (18F1-L-doparate constant k@and its side to side difference in Parkinsonism plus disorders using PET. I Neuroünaging 1992: in press.
487


![[18F]-Fluorodeoxyglucose-Positron Emission](https://m.moam.info/img/260x300/18f-fluorodeoxyglucose-positron-emission_5c921338097c47100a8b4582.jpg)