remote sensing Review
Slums from Space—15 Years of Slum Mapping Using Remote Sensing Monika Kuffer 1, *, Karin Pfeffer 2 and Richard Sliuzas 1 1 2
*
Faculty of Geo-Information Science and Earth Observation (ITC), University of Twente, PO Box 217, 7500 AE Enschede, The Netherlands;
[email protected] Faculty of Social and Behavioural Sciences, University of Amsterdam, Nieuwe Achtergracht 166, 1018 WV Amsterdam, The Netherlands;
[email protected] Correspondence:
[email protected]; Tel.: +31-53-4874301
Academic Editors: Ioannis Gitas and Prasad S. Thenkabail Received: 6 April 2016; Accepted: 18 May 2016; Published: 27 May 2016
Abstract: The body of scientific literature on slum mapping employing remote sensing methods has increased since the availability of more very-high-resolution (VHR) sensors. This improves the ability to produce information for pro-poor policy development and to build methods capable of supporting systematic global slum monitoring required for international policy development such as the Sustainable Development Goals. This review provides an overview of slum mapping-related remote sensing publications over the period of 2000–2015 regarding four dimensions: contextual factors, physical slum characteristics, data and requirements, and slum extraction methods. The review has shown the following results. First, our contextual knowledge on the diversity of slums across the globe is limited, and slum dynamics are not well captured. Second, a more systematic exploration of physical slum characteristics is required for the development of robust image-based proxies. Third, although the latest commercial sensor technologies provide image data of less than 0.5 m spatial resolution, thereby improving object recognition in slums, the complex and diverse morphology of slums makes extraction through standard methods difficult. Fourth, successful approaches show diversity in terms of extracted information levels (area or object based), implemented indicator sets (single or large sets) and methods employed (e.g., object-based image analysis (OBIA) or machine learning). In the context of a global slum inventory, texture-based methods show good robustness across cities and imagery. Machine-learning algorithms have the highest reported accuracies and allow working with large indicator sets in a computationally efficient manner, while the upscaling of pixel-level information requires further research. For local slum mapping, OBIA approaches show good capabilities of extracting both area- and object-based information. Ultimately, establishing a more systematic relationship between higher-level image elements and slum characteristics is essential to train algorithms able to analyze variations in slum morphologies to facilitate global slum monitoring. Keywords: slums; informal areas; urban remote sensing; Global South; VHR imagery
1. Global Urbanization and Slum Dynamics: The Context Currently, about one-quarter of the world’s urban population lives in slums, which are defined by UN-Habitat as informal settlements [1] or areas deprived of access to safe water, acceptable sanitation, and durable housing; in addition to being areas that are overcrowded and lack land tenure security [2]. Over the last 15 years, there has been renewed interest in slum improvement and eradication by local and international organizations dealing with development issues. During this period, slums became a more prominent subject of remote sensing (RS) image analysis. Supported by increased availability of very-high-resolution (VHR) data and methodological advances, many RS studies [3–8] aimed to produce information on the geography and dynamics of slums. Thus a multiplicity of images, concepts, Remote Sens. 2016, 8, 455; doi:10.3390/rs8060455
www.mdpi.com/journal/remotesensing
Remote Sens. 2016, 8, 455
2 of 29
algorithms and applications have become available. However, to upscale the existing knowledge and set the stage for innovations, a systematic review of what works in which context is still lacking. This article fills this gap by reviewing recent and contemporary approaches, indicators, data sources, and lessons learned from empirical cases with respect to physical slum characteristics that could form a basis for a systematic global slum inventory. Before doing so, we first introduce some aspects of slum development in the Global South (the term Global South is commonly used in the field of development studies and refers to developing countries, mainly located in the Southern Hemisphere; Global North on the other hand refers to developed countries [9]). Slum-identification studies are very much driven by the persistence and growth of slums and emergence of new slums being inexorably part of contemporary urbanization processes, particularly in the Global South where rapid slum development is linked to the failure of formal land markets and low planning capacity. For example, the city of Hyderabad, India experienced a 70% increase of slum areas between 2003 and 2010 [10], a situation that is by no means unique [11]. A recent UN-Habitat report [12] stated that the urban population in Sub-Saharan Africa (SSA) is growing by 10 million people annually, of which 7 million are likely to move into slums. Latest estimates by UN-Habitat [1] suggest that, in Africa, 62% of the urban population is living in slums; in Asia, it is up to 30%; and in Latin America and the Caribbean, the rates of living in slums is 24%. Over the last six to seven decades, various policy discourses and programs addressing slums have emerged. During the 1950s and 601 s, slum settlements were often tolerated or neglected as “traditional villages.” As large-scale evictions were found to be ineffective due to their impact on the livelihoods of dwellers [13,14], in situ slum upgrading [13], and low-cost housing solutions such as site and service schemes and guided land development emerged [15,16]. Resettlement programs often further contributed to impoverishment [17], though some successful resettlement projects [18] showed that long-term community empowerment programs are necessary to ensure lasting improvements [19] that may also take several generations to materialize [20]. By contrast, in situ upgrading programs showed success in many places [21]. Since the 901 s, the global slum debate centered very much on ensuring land tenure security [2,22], and slum upgrading is once more strongly favored above forced displacement. Presently, many local governments do not fully “acknowledge the existence of slums and informal settlements” ([1], p. 5), as available “data is often ad hoc and not connected to robust city-wide monitoring and evaluation processes” ([1], p. 5). In support of such local and global information needs for the development of pro-poor policies, innovative methods are required to enhance our understanding of the spatial and temporal dynamics of slums towards the creation of knowledge repositories on slums. For the development of such repositories, reliable and robust slum-detection methods are required that would allow for a global comparison but also provide support to less resourced countries and cities (e.g., allowing local adaptations of indicators in form of “slider widgets and/or buttons in a graphical user interface (GUI)” ([23], p. 321). Such repositories can form a basis for socioeconomic data integration [24] and offer essential information for “devising and implementing customized approaches of slum upgrading” ([25], p. 276). Moreover, consistent global coverage of slum data is required for international policy development and urban agenda setting at national levels. UN-Habitat facilitates this process and produces global statistics on slum development and distribution that are disseminated via its State of the World Cities reports [26,27] and other publications, but its efforts have delivered estimates of slum dwellers rather than maps of slum extents, which would provide a much-needed picture of the changing locations, extents and densities of slums. 2. The Utility of Remote Sensing for Slum Mapping In many cities, slums are a major part of the urban housing stock and an important part of the urban economy. It is important to realize that “slums disappear not through being removed, but by being transformed” ([28], p. 1). However, we lack information about slums, specifically their scale, location, extent, boundaries, populations, buildings and enterprises [29]. Consequently, holistic strategies [22] that focus on understanding the local role of slums, the needs of their inhabitants,
Remote Sens. 2016, 8, 455
3 of 29
as well as their geography and spatial dynamics are required. Remote sensing can play a key role in analyzing “space´time dynamics” [30], such as monitoring densification and expansion processes or assisting in the implementation of slum improvement policies. Furthermore, it allows linking the urban morphology with socioeconomic parameters [31]. Remote sensing is capable of mapping the amount of slums in highly hazardous areas or the general environmental conditions [32] that play an important role for urban health campaigns [29,33]. The utility of slum mapping has been stressed by Slum/Shack Dwellers International (SDI), e.g., maps are an important historic archive in court cases protecting dwellers against unlawful evictions [34]. In support of pro-poor policy formulation, it is important to combine such spatial information with community-driven mapping to understand local needs [29,35]. Spatiotemporal information on slums is scarce at the city scale, while regional or global knowledge will not be realized without utilizing RS techniques that allow for frequent coverage of large areas. However, deriving this information from RS imagery is not a straightforward process involving multiple choices as it can be done in many ways. A first attempt in bringing together the methodological expertise on slum mapping and monitoring was an expert meeting in 2008 [36] with the aim to review potential, limitations and methods for slum identification based on VHR imagery that included: (a) visual interpretation; (b) object-based image analysis (OBIA); (c) texture-based methods; and (d) community-based approaches. One of the identified challenges was that slum conditions can take various forms and, therefore, no universal model of slums existed. This is due to differences in slum-development processes [37], their age and thus developmental stages (infancy, consolidation, maturity), geographical location and context (e.g., central versus peri-urban [38] or arid versus tropical coastal cities [39]). Hence, the diversity of urban slums and geographic contexts requires methodological adjustments. Another identified challenge was the “level (scale) of analysis,” specifically object-based [40] versus area-based identification of slums [41]. While object-based analysis concerns the extraction of urban objects such as slum roofs, area-based refers to the extraction of homogeneous urban patches (HUP) [42], also called “analytical regions” [43] representing slum neighborhoods. Since 2008, many studies have addressed some of these challenges. For instance, a slum ontology was developed [5,7] to conceptualize the spatial characteristics of slums for OBIA. Researchers applying several auxiliary methods (e.g., machine learning [44], statistical methods [6], and image texture [45]) have improved the potential for slum identification. The use of large indicator sets [6,46] has improved slum-identification accuracies. The key role of remote sensing for slum detection was stressed in recent reviews on urban analysis via RS applications [30,47,48]. However, neither review focused on the plurality of methods and their relevance for slum detection. Therefore, this review presents the methodological and technological advances in slum-identification methods and employed indicator sets that have emerged over the last 15 years. In doing so, we identify RS imagery, methods and indicators relevant for a global slum inventory in support of pro-poor policy implementations. The structure of the review is as follows: Section 3 provides an overview of the employed methodology, followed by contextual factors, such as terminology, purposes and mapped slum locations in Section 4. Section 5 discusses physical slum characteristics and their diversity. Section 6 reviews data and requirements of slum studies. Section 7 reviews employed methods, while the eighth section discusses the most promising aspects for the development of a global slum inventory. In the final section, we draw conclusions on the feasibility of a global knowledge repository on slums. 3. Methodology of Review Exploring potential and limitations of slum-identification methods based on RS imagery has received increasing attention amongst RS experts. Although the underlying drivers for this rise in interest is not exactly clear, it has been stimulated by growing international motivation to reduce the numbers of slum dwellers that has created a demand for policy-relevant information [1]. Furthermore, it has been stimulated by the widespread access to VHR satellite images and advances in geospatial technologies that has essentially democratized space imagery and spatial mapping, accompanied by a
Remote Sens. 2016, 8, 455
4 of 29
growing number of algorithms for detecting and classifying urban areas, including slums. However, the two main initiatives to generate a global up-to-date geo-database on the “location, shape, and dynamics of built-up areas” ([49], p. 905), specifically the Global Human Settlement Layer (GHSL) (using optical data) and the Global Urban Footprint (GUF) layer (using SAR data) [50,51], stressed the difficulties of detecting the more organic patterns of slums [52]. Both initiatives focus on built-up areas and not specifically on slum mapping. Reasons for low identification accuracies of slums are attributed to their rather different morphological characteristics [53] (e.g., higher roof coverage densities, more organic patterns, and small building sizes) compared to formal built-up areas (Table 1). This methodological challenge has contributed to the large diversity in slum-mapping approaches and employed image-based proxies. Table 1. Morphological features typical for slum areas (adapted from [41,54]). Features
Slum Areas
Size
‚
Small (substandard) building sizes
‚
Generally larger building sizes
Density
‚ ‚
(Very) high roof coverage densities Lack of public (green) spaces within or in the vicinity of slum areas
‚ ‚
Low to moderate density areas Provision of public (green spaces) within or in vicinity of planned areas
‚
Organic layout structure (no orderly road arrangement and noncompliance with set-back standards)
‚
Regular layout pattern (showing planned regular roads and compliance with set-back rules)
‚
Often at hazardous locations (e.g., flood prone, close to industrial areas, steep slope) Proximity to infrastructure lines and livelihood opportunities
‚
Land has basic suitability for being built-up (Basic) infrastructure is provided
Pattern
Site Characteristics ‚
Formal Built-Up Areas
‚
This review analyzes the diversity of RS studies of the past 15 years that deal with the challenge of extracting slums. It is based on a systematic literature search, performed in December 2015, using several search engines (Web of Science, Science Direct, SpringerLink Journals, Taylor & Francis and Scopus) and covers the keywords “slums,” “informal,” “unplanned,” “squatter,” “precarious,” “spontaneous,” “illegal,” “deprived,” “irregular” or “substandard settlement/area,” “self-help housing,” “shantytown,” “favela” or “bidonville” and “mapping” or “remote sensing.” The review covers journal publications, book sections and conference publications that could be retrieved either via the employed research engines or websites of the main RS conferences. Only English-language papers are selected, and very similar publications by the same authors (e.g., journal and conference publication) were counted only once. In total, 87 key publications ([3–7,10,23,25,31–33,38–41,43–46,54–121]) are identified. A temporal analysis of the number of publications shows an increasing trend (Figure 1), having a high linear correlation with the number of satellite launches (r2 = 0.75). Satellite launches were derived from the following websites (including only the earth observation satellites with a spatial resolution of 5 m and less): ‚ ‚ ‚
ITC’s database of Satellites and Sensors: http://www.itc.nl/research/products/sensordb/ searchsat.aspx Gunter’s Space Page: http://space.skyrocket.de/directories/chronology.htm Satellite on the Net: http://www.satelliteonthenet.co.uk/index.php/launch-schedule
In the mid-2000s, when more VHR satellites became available the number of related publications increased. The same occurred for the period after 2010. The analytical framework (Figure 2) for analyzing the retrieved publications, inspired by the outcome of the expert meeting on slum mapping [36], forms the skeleton for this review. Figure 2 shows that slum formation and development in global cities are impacted by several contextual factors,
Remote Sens. 2016, 8, 455
Remote Sens. 2016, 8, 455
5 of 29
5 of 31
Sens. 2016, 8, 455 of 31 suchRemote as geographic location and climate, the topography of the city, the location within the5city including proximity to services, and generaloften socioeconomic and political factors (e.g., land governance). governance). ForFor example, slum dwellers trade offoff accessibility to livelihood opportunities with governance). example, slum dwellers often trade accessibility to livelihood opportunities with For example, slum dwellers often trade off accessibility to livelihood opportunities with locations locations exposed to hazards. Physical slum characteristics are often an expression of the slumlocations exposed to hazards. Physical slum characteristics are often an expression of the slumexposed to hazards. Physical slum low-density characteristics often an expression of the slum-development development processes: i.e.,i.e., from at are their infancy stage to to high-density mature slums, development processes: from low-density at their infancy stage high-density mature slums, processes: i.e., from low-density at their infancy stage to high-density mature slums, sometimes also sometimes also including increasing building size and height. For example, slums can have multiple sometimes also including increasing building size and height. For example, slums can have multiple including increasing buildingfloors size and height. For example, slums can have multiple general incrementally incrementally incrementallyconstructed constructed floors[2].[2].Patterns Patternsof ofroads, roads,building buildinglayouts layoutsand and generalsitesite constructed floors [2]. Patterns of roads, building layouts and general site characteristics define the characteristics define thethe growth potential of of a specific settlement. When mapping slums, physical characteristics define growth potential a specific settlement. When mapping slums, physical growth potential of a need specific settlement. When mapping slums, physical slum characteristics need slum characteristics to to be well understood forfor translating them into image-based proxies. The slum characteristics need be well understood translating them into image-based proxies. The to data bedata well understood for translating them into image-based proxies. The data and requirements of andand requirements of slum-mapping studies relate to imagery and ancillary data and the level requirements of slum-mapping studies relate to imagery and ancillary data and the level slum-mapping studies relate to imagery and ancillary data and the level (scale) of analysis, e.g., (scale) of analysis, e.g., extraction of dwelling units (objects) versus delineation of settlements (areas). (scale) of analysis, e.g., extraction of dwelling units (objects) versus delineation of settlements (areas). Thus thethe varies from small objects (e.g., slum buildings that can be be below m2scale ) to large extraction ofscale dwelling units (objects) versus delineation of settlements (areas). Thus20the varies 2) to Thus scale varies from small objects (e.g., slum buildings that can below 20 m large 2 settlements of several hectares [8,82]. Furthermore, the required spatial, spectral and temporal from small objects (e.g., slum buildings that can be below 20 m ) to large settlements of several settlements of several hectares [8,82]. Furthermore, the required spatial, spectral and temporal resolution forfor slum mapping to to bespatial, specified. These requirements areare closely to extraction hectares [8,82]. Furthermore, theneed required spectral and temporal resolution forlinked slum mapping need resolution slum mapping need be specified. These requirements closely linked to extraction methods. Across studies, a multiplicity of extraction methods for slum mapping have been employed, to bemethods. specified. Thesestudies, requirements are closely linked to extraction studies, multiplicity of Across a multiplicity of extraction methods methods. for slumAcross mapping have abeen employed, from classical visual interpretation OBIA or or machine learning, or or avisual combination of methods, extraction methods forimage slum mapping havetobeen employed, from classical image interpretation from classical visual image interpretation to OBIA machine learning, a combination of methods, the main methodological of of translating relevant setset ofmethodological slum characteristics into to with OBIA orthe machine learning, or achallenge combination oftranslating methods,a with the main challenge of with main methodological challenge a relevant of slum characteristics into robust indicators (e.g., developing a slum ontology) for image-based slum mapping [23] that would robust aindicators (e.g., developing a slum ontology) forindicators image-based mapping [23] that would translating relevant set of slum characteristics into robust (e.g.,slum developing a slum ontology) allow forfor a global slum inventory. ultimately allow a global slum inventory. forultimately image-based slum mapping [23] that would ultimately allow for a global slum inventory.
Figure Number publications on slums slums andand sensing methods by year and successfully Figure 1. 1.Number ofofpublications on and remote sensing methods byby year and successfully Figure 1. Number of publications on slums remote sensing methods year and successfully 2 2isis0.75). launched VHR satellites (r 0.75). launched VHR satellites (r 2 launched VHR satellites (r is 0.75).
Figure Analytical frame ofthe the review: methodological challenge for aaglobal slum inventory. Figure 2.2.Analytical frame of review: methodological challenge forfor global slum inventory. Figure 2. Analytical frame of the review: methodological challenge a global slum inventory.
The overall purpose this review the identification of variety ofofmethodological advances The overall purpose of this review is the identification of variety ofmethodological methodological advances The overall purpose ofofthis review isis the identification of the thethe variety advances in slum mapping that are relevant for a global slum inventory. Four analytical sub-questions guide in slum mapping thatrelevant are relevant a global inventory. analytical sub-questions guide in slum mapping that are for a for global slumslum inventory. Four Four analytical sub-questions guide this this review. First, what are the main contextual factors and related slum terminologies of published thisFirst, review. First, are the main contextual factors andslum related slum terminologies of published review. what are what the main contextual factors and related terminologies of published studies onon slum identification viavia RSRS (Q1)? Second, areare thethe varieties of of physical slum studies slum identification (Q1)? Second, what varieties physical slum onstudies slum identification via RS (Q1)? Second, what are thewhat varieties of physical slum characteristics characteristics extracted in VHR imagery (Q2)? Third, what are the input data and requirements of of characteristics extracted in VHR imagery (Q2)? Third, what are the input data and requirements
Remote Sens. 2016, 8, 455
6 of 29
extracted in VHR imagery (Q2)? Third, what are the input data and requirements of slum-mapping studies (Q3)? Fourth, which extraction methods have been used and what are their capacities, accuracies and limitations (Q4)? Each sub-question is dealt within one of the following sections. 4. Contextual Factors Context matters for slum mapping. We first provide an overview of the terminological differences regarding settlements with poor living conditions as they affect the choice and definition of indicators. We also summarize the purposes of slum-mapping studies linked to the socioeconomic and political context. The final section gives an overview of geographic locations mapped by slum studies linking to variation in climate and topography. 4.1. Terminological Differences The nomenclatures of slum settlements vary depending on different connotations [41,122]. To some extent, these terms reflect the different views on such settlements. Terms such as “informal,” “illegal” or “squatter,” for instance, focus on the land rights (tenure status) [24], whereas “unplanned” relates to the planning context [41]. “Spontaneous” or “irregular” emphasizes the growth dynamics [123], whereas “deprived,” “shantytown” and “sub-standard” are associated with poor physical and socioeconomic conditions [54]. The recent revival in popularity of the rather political term “slum” [122] is largely linked to the Habitat Agenda and the related development goals [27,124]. The analysis of the retrieved publications with respect to these terms in combination with RS methods (see Table 2) identified “informal settlement/area” (47%) and “slum” (29%) as the most commonly used terms in the RS community, among which some researchers use both terms interchangeably (6%). Less frequently used terms that refer to the physical condition (e.g., “deprived/sub-standard”) focus on a specific issue (e.g., “refugee camps”) or on a specific national context (e.g., “migrant housing” or “urban villages” in China). Terms such as “squatter” or “unplanned,” which were common in the 1970s–1980s planning literature, are no longer commonly used. “Informal settlement/area” being the most frequently used term in the RS literature is actually awkward as it constitutes the legal (tenure) status of an area, which cannot be directly extracted from imagery. A change in tenure status does not necessarily affect the physical characteristics. In this review, we use the term “slum” to refer to urban areas with poor living conditions as this term expresses explicitly physical characteristics such as high densities or irregular patterns, indicators that can be derived by means of RS methods. Here, an ontological framework (e.g., developed by [5,7]) “provides a comprehensive description of spatial characteristics and their relationships to represent and characterize slums in an image” ([31], p. 155). Such an ontology framework—split in three phases: specification, conceptualization and implementation [5]—provides a clear conceptual foundation for developing robust image-based indicators, facilitating global knowledge acquisition and comparisons for the development of a global slum inventory. Table 2. Frequency of publications using a specific term (within the reviewed remote sensing publications). Terms
Frequency
Percent (%)
Informal settlement/area Slum Slum and informal settlement/area Squatter area Unplanned area Deprived area Refugee camp Sub-standard area Informal homesteading Informal and unplanned settlement Migrant and informal housing
41 25 5 4 3 2 2 2 1 1 1
47.1 28.7 5.8 4.6 3.5 2.3 2.3 2.3 1.1 1.1 1.1
Total
87
100
Remote Sens. 2016, 8, 455
7 of 29
4.2. Purposes of Slum Mapping Using Remote Sensing Our second contextual topic concerns the different purposes of RS-based slum-mapping studies. The review has identified three key geographical questions—where, when and what?—as the main objectives of studies. Often, researchers aim at the provision of basic information on “where” the slums are located within the urban fabric and what their areal extent is. Such information allows compensating for the non-availability of socioeconomic information (e.g., income levels) in many cities of the Global South [31]. Besides its importance for urban development [68], the where question is also relevant within a humanitarian context, for which several studies [67,76,109] developed methods to map refugee camps (e.g., under Copernicus) [125]. While development dynamics of slums at the city scale are of particular interest for local planning and decision support [10,126], only a few studies have focused on temporal slum dynamics (when) (e.g., [10]). This could be related to challenges extracting these dynamics, in particular in terms of data availability and obtaining local knowledge. Examples of studies on dynamics are the analysis of the process of forced mass evictions in Harare (Zimbabwe) [104], the investigation of built-up changes for large slum settlements such as Kibera-Nairobi [3] or the exploration of development dynamics of slums in Delhi, showing stagnation in the center versus growth in the periphery [127]. Such multi-temporal information can feed simulation models on the growth of slum areas, generating policy-relevant information of future growth scenarios [48,128–132]. Several publications have focused on what’-related issues, such as the number of slum inhabitants, since many census statistics slums are not well covered (with high uncertainty about the number of inhabitants) [133]. Moreover, RS-based population estimates allow a more detailed spatial and temporal disaggregation [133,134]. However, population estimates of slums can vary [4] as illustrated for the case of Kibera (Nairobi) [3], where estimates differed by half a million people depending on the sample data used. For the slums in Hyderabad, India, Kit et al. [134] computed slightly lower image-based population figures than the figures reported by the census. Furthermore, relying on physical proxies for population estimations can lead to errors for areas that have not yet been fully occupied, e.g., new developments in outskirts [70]. Other what-related issues deal with boundaries and effectiveness of policies for health campaigns [84,135], allocation of public services and protection of environmentally sensitive areas [68] or spatial planning and policy formulation [69]. These efforts are related to the fact that local planning authorities often lack elementary information on slums, which “has led to a deficit in policy for these areas, as without quality map data, it is often difficult to plan effectively for these areas” ([69], p. 390), leading to ad hoc plans that do not consider the specific locational context. For example, for one settlement in Johannesburg, Gunter [69] mapped 10,000 more dwellings by using Google Earth (GE) images compared to the government estimates. Such discrepancies are problematic for policy development and monitoring and may point to conceptual differences in what constitutes a slum dwelling. Spatial information on slums can support local governments in better determining the demand of basic services and other relevant amenities [136] and monitor slums via RS-based proxies of “human deprivation or well-being” ([137], p. 68). The potential application areas for RS-based information on the morphology and temporal dynamics of slums are grouped into four major domains (Table 3, [21,54,77,120,138–152]): economy, environment, governance and planning, and social applications. These domains reflect the reported spatial information needs and lack of information on slums in locally available data sets [84]. Quite a rich body of literature is connected to social issues, where “remotely sensed imagery can serve as data source for inferring socio-economic variables” ([93], p. 69). Emerging applications areas are related to land management [144,145], quality of life and crime studies [151,152].
Remote Sens. 2016, 8, 455
8 of 29
Remote Sens. 2016, 8, 455
8 of 31 Table 3. Application domains of remote sensing-based information on the morphology and temporal dynamics of slums. Table 3. Application domains of remote sensing-based information on the morphology and temporal dynamics of slums. Domain Application Areas
Economy Domain
‚
Economy
•
Environment Environment
• • • • • • • • •
Governance/Planning Governance/Planning
Social Social
Economic condition—poverty, e.g., [138] Application Areas
condition—poverty, [138] ‚ Economic Environmental deprivation, e.g., e.g., [139] deprivation, ‚ Environmental Environmental protection,e.g., e.g.,[139] [140,141] ‚ Environmental Hazards—vulnerability, e.g., [140,141] [142,143] protection, e.g., Hazards—vulnerability, e.g., [142,143] ‚ Land management—enumeration, e.g., [144,145] management—enumeration, e.g.,models, [144,145] ‚ Land Planning interventions and growth e.g., [21,146] and[54] growth models, e.g., [21,146] ‚ Planning Urban interventions governance, e.g., Urban governance, e.g., [54] ‚ Health, e.g., [120,147,148] Health, e.g., [120,147,148] ‚ Humanitarian, e.g., [76,149,150] Humanitarian, e.g., [76,149,150] ‚ Quality of life and crime, e.g., [151,152] Quality of life and crime, e.g., [151,152]
4.3. Geographic 4.3. GeographicLocations, Locations,Climate Climateand andTopography Topography Given developingaaglobal globalslum sluminventory, inventory,we weanalyze analyze Giventhe theaim aimofofidentifying identifyingrelevant relevant issues issues for developing the geographic on slums slumsby bymapping mappingthe thecase casestudy studylocations locations the geographicdistribution distributionof ofRS-based RS-based information information on found ininEnglish-language populationdensity densitymap map(Figure (Figure3).3).InIn the figure, found English-languagepublications publications on on top of a population the figure, “slum cities” aregrouped groupedinto intolocations locationswhere where object-level object-level information “slum cities” are information(roofs (roofsororroads), roads),area-based area-based slum maps,ororboth bothwere wereextracted. extracted. Object-level Object-level information Obviously, slum maps, informationisismainly mainlyavailable availableininSSA. SSA. Obviously, there is a spatial relationship between areas of high urban population densities in the Global there is a spatial relationship between areas of high urban population densities in the GlobalSouth South and the locationofofcase casestudies. studies. The The highest highest concentrations concentrations are SSA and the location arefound foundininSouth-East South-EastAsia Asiaand and SSA (East and South).Some Someclusters clusters also also exist exist in in North North and and West West Africa Africa and (East and South). and South/Central South/CentralAmerica. America. Examplesare areeven evenfound foundininthe theGlobal Global North, North, dealing dealing with Examples with the the monitoring monitoringofofinformal informaldevelopment, development, e.g., in Greece [153] and the US [119]. The cities covered range from (sub)tropic, Mediterranean, arid e.g., in Greece [153] and the US [119]. The cities covered range from (sub)tropic, Mediterranean, andand continental climates, as well as low-lying areas areas with rather flat terrain (e.g., Dhaka) up to higharid continental climates, as well as low-lying with rather flat terrain (e.g., Dhaka) up to lying cities (e.g., La Paz) with steep slopes. Still, many urban regions with very dynamic urban urban and high-lying cities (e.g., La Paz) with steep slopes. Still, many urban regions with very dynamic slum developments are not well covered in English-language publications, e.g., areas in the and slum developments are not well covered in English-language publications, e.g., areas in the Caribbean, West and Central Africa or in South-East Asia. Also, areas in Europe might become a Caribbean, West and Central Africa or in South-East Asia. Also, areas in Europe might become a future future focus, considering the recent erection of refugee camps or examples of deprived Roma focus, considering the recent erection of refugee camps or examples of deprived Roma settlements in settlements in European countries [144]. Many of the regions not covered belong to the least European countries [144]. Many of the regions not covered belong to the least developed countries with developed countries with large income inequalities and/or instable political conditions, e.g., Liberia, large income inequalities and/or instable political conditions, e.g., Liberia, Congo or Myanmar. In such Congo or Myanmar. In such countries, ground-truth or reference data accessibility might be even countries, ground-truth or reference data accessibility might be even more of a problem. Moreover, more of a problem. Moreover, many studies are about methodological developments and do not many studies are about methodological exhaustive slum create exhaustive citywide slum maps, developments illustrating thatand wedo arenot stillcreate far away from acitywide global slum maps, illustrating that we are still far away from a global slum inventory. inventory.
Figure 3. Case study cities in publications (N = 87) on slum mapping via RS methods on top of a Figure 3. Case study cities in publications (N = 87) on slum mapping via RS methods on top of a population density map (base map: population density, Source: ESRI). population density map (base map: population density, Source: ESRI).
Remote Sens. 2016, 8, 455
9 of 29
The majority of the reviewed publications are authored by academic researchers, both from universities in the Global North (48%) and Global South (21%) or combinations thereof (6%). Fewer publications stem from research centers (including national RS agencies), in the Global North (8%) and Global South (5%) and one by a commercial image provider (1%). Moreover, there is some cooperation between research centers and university in the Global North (5%) and South (2%), also across South and North (2%), or with an NGO (2%). The majority of English-language publications from the Global North links to the global slum debate. South´North and South´South cooperation are of particular relevance for knowledge exchanges and transfer, bridging technology gaps and for further expanding our knowledge to more cities including also very instable regions like the Sudan [125]. 5. Physical Characteristics of Slum Areas VHR imagery provides a detailed representation of the physical elements of a landscape, capturing physical characteristics of slums. This section conceptualizes these characteristics derived from imagery and considers their diversity. 5.1. Characterization of Slum Areas The definition of what constitutes a slum is complex. Variations exist between global, regional and local slum definitions [154] that can result in large differences of mapped slum areas [64]. Many publications adopted the global UN-Habitat definition of slums (e.g., [4,43,155]), which consists of five well-established indicators: secure tenure, adequate access to safe water, access to acceptable forms of sanitation, overcrowding, and the durability of housing considering both the quality of the structures as well as site conditions in terms of hazards. For instance, based on the work of Weeks et al. [43], Duque et al. [61] used these indicators (i.e., wall material, overcrowding, access to piped water, sanitation connection to sewers, and ownership) to build a slum index based on census data for the city of Medellin (Colombia). This index, compared with image-based information on land cover, structural and texture-based features, showed that the image-based information could explain 59% of the slum index. A major problem in employing the UN-Habitat definition in RS-based studies is that only the indicator “durability of housing conditions” has a direct link to information extracted from imagery, namely location aspects (such as location on steep slopes, along major drainage channels [112]), compliance with building codes measured via density, distance or roofing material [2]. Slums do not have “easily distinguishable spectral signatures” ([45], p. 661), meaning that roofing material may vary within slums (e.g., plastic, iron, concrete, tin, asbestos) and between different slums and globally between cities. For the example of Accra (Ghana), Engstrom et al. [64] concluded that when using the UN-Habitat definition, most of the city is classified as slums, while an image-based identification matched much better the local delineation of slums. These examples indicate that global slum definitions need to be adjusted to the local context. However, most researchers fail to start with a local characterization of the slum morphology and the development of related image-based proxies. Table 4 presents an overview of physical characterizations of slums found in literature, split into five major dimensions: building geometry, density, arrangement (pattern/road), roofing material, and site characteristics. The most frequently used characteristics are small roof sizes, high density, and irregular patterns (visible by irregular and narrow streets combined with heterogeneous building orientation). Densities in Asian cities tend to have higher values than in SSA cities (Asia ~80% and SSA ~60%) [5,41]. However, also in SSA, centrally located slums, such as those in Nairobi, Kenya with an estimated roof cover of 50%–60%, have high densities [156]. For the group of roofing material and physical site characteristics, there is a great deal of difference between cities across different geographic regions and even across slums. For instance, in Dehradun, slums are characterized by tone differences due to different roofing materials (e.g., plastic, wood etc.) [75], but in Guangzhou [97] or Ahmedabad [5], spectrally similar roofing material characterizes slums. Regarding physical site characteristics, there is also no general agreement; however, slums are often located in areas that are not suitable for constructions (e.g., on a flood plain, steep slope or other hazardous locations) [157].
Remote Sens. 2016, 8, 455
10 of 29
Table 4. Physical characteristics of slums in selected journal papers.
ACROSS
SSA
AMERICAS
ASIA
Geographical Area
Building Geometry
Density
Arrangement Pattern/Roads
Roofing Materials
Site Characteristics
Ahmedabad [5]
Small roof sizes, number of floors
High density
Absence and/or irregular roads (width/unpaved)
Specific roof materials (e.g., iron, plastic)
Lack of green/open spaces, irregularly shaped boundaries
Bangalore [84]
Low building height
Limited space between shelter units
Lack of access roads and irregular patterns
Specific (brown or grey roofs)
Lack of shadow
Dehradun [75]
Small roof sizes
Irregular patterns
Diverse (plastic, wood, cement/concrete)
Delhi [54]
Small roof sizes
High density ~80%
Irregular patterns; no access roads
Delhi [94]
Small roof sizes, mostly 1–2 floors
High density
Irregular patterns; narrow streets in bad conditions
Hyderabad [10,45]
Small roof sizes
High density
Irregular patterns; narrow streets
Mumbai [4]
Small roof sizes (50%: narrow streets/footpaths (below 1 m)
Low heterogeneity of spatial patterns
Guangzhou [97]
Mostly square roofs (~12 ˆ 12 m), additional floors
High density; distance between shelters 1 to 3 m
Patterns vary depending on location
Specific (spectrally similar)
Shenzhen and Wuhan [72]
Small roof sizes
High density
Irregular patterns
Often specific roofing material
Little vegetation and other open spaces
Guatemala City [6]
Small roof sizes, simple shapes, diverse orientation
High density
Irregular patterns
Diverse
Dirt roads; less green; poor accessibility; steep slope; proximity to hazards
Diverse
Hazardous locations (e.g., railway, river, highway) Diverse poor and non-permanent materials
Complex settlement shape, hazardous locations) Often at city edge and close to industrial sites.
Medellin [61]
Small roof sizes
High density
Complex patterns
Rio de Janeiro, Brazil [44]
Small roof sizes
High density
Irregular patterns
Sao Paulo State [96]
Small roof sizes
High density
Specific (ceramic tile and asbestos)
Accra [120]
Small roof sizes
High density
Specific (spectrally similar)
Lack of vegetation
Diverse (e.g., plastic, tin, wood)
Degradation of the local ecosystem
Lack of vegetation
Cape Town [87]
Small roof sizes
Nairobi [74]
Small roof sizes
High density; narrow roads
Irregular patterns
Specific (with low reflectance)
Caracas, Kabul, Kandahar, La Paz [46]
Small roof sizes
High density
Heterogeneity in building orientation, irregular streets
Diverse
Proximity to hazardous locations
Cape Town, Rio de Janeiro [7,71]
Small roof sizes
High density
Irregular patterns, small road segments
Irregular building materials
Only small patches of vegetation cover
Delhi, Dar es Salaam [41]
Small roof sizes
High density
Irregular patterns
19
17
16
14
12
Frequency: Asia: 11, Americas: 6, SSA: 5
Remote Sens. 2016, 8, 455
11 of 29
Remote Sens. 2016, 8, x
11 of 29
To conceptualize suchsuch physical characteristics, slumontology ontology (Figure 4), To conceptualize physical characteristics,Kohli Kohlietetal. al.[5] [5] developed developed aaslum (Figure based4),on Hofmann et al. [7], which consists of three spatial levels (object, settlement and environs). based on Hofmann et al. [7], which consists of three spatial levels (object, settlement and environs). For each indicators identify specificphysical physical slum slum characteristics. YetYet thethe ontology requires a For each level,level, indicators identify specific characteristics. ontology requires a local adaption asall notindicators all indicators are relevant a specific slum identification [158]. Thusslums local adaption as not are relevant for afor specific locallocal slum identification [158]. Thus slums are different from non-slum but homogeneous are not homogeneous are different from non-slum areas, butareas, are not [4]. [4].
Figure 4. Slum ontology—indicators associated with the three spatial levels [5]. Figure 4. Slum ontology—indicators associated with the three spatial levels [5].
5.2. The of Slums 5.2.Diversity The Diversity of Slums Besides the the commonalities ofofslums physicalcharacteristics, characteristics, explore Besides commonalities slumsin in terms terms of physical we we alsoalso explore the the heterogeneity of slums.Already Already in Stokes differentiated between “slums “slums of hope” of andhope” heterogeneity of slums. in 1962, 1962,Charles Charles Stokes differentiated between “slums of Slums vary between and within cities and within terms of and “slums of despair” despair”[159]. [159]. Slums vary between and within cities and slums withininslums in subterms of standard living conditions [122,160]. Therefore, recently, some researchers have been exploring sub-standard living conditions [122,160]. Therefore, recently, some researchers have been exploring different typologies based building sizes, sizes, density, location (Table 5). However, different slumslum typologies based ononbuilding density,pattern patternoror location (Table 5). However, slums are often not the worst off areas in terms of socioeconomic conditions [31,114,161]. Thus, such slums are often not the worst off areas in terms of socioeconomic conditions [31,114,161]. Thus, typologies include also fuzzy classes (i.e., semi-formal), reflecting the dilemma that some areas are such typologies include also fuzzy classes (i.e., semi-formal), reflecting the dilemma that some areas are formal but are physically and/or socioeconomically similar to slums, e.g., high-density resettlement formal but are physically and/or socioeconomically similar to slums,characteristics e.g., high-density resettlement colonies in Delhi [54]. On the contrary, areas can have morphological that align with colonies in Delhi On thethey contrary, morphological characteristics that align with slums, but on [54]. the ground, are notareas slumscan likehave historic core areas. slums, but on the ground, they are not slums like historic core areas. Table 5. Slum typologies and their categories. No.
‚ ‚ ‚
2
3
• Semi-formal low-cost housing Quezon City [65] Geographical Area • Slum Categories • Type low-cost I: smallto medium-sized buildings, Semi-formal housing Quezon City [65] narrow/irregular streets Caracas, Kabul 2 Slum • Type II: very small buildings and high building Kandahar, La Paz [46] density, roads Type I: smalltounidentifiable medium-sized buildings, • Informal Astreets (squatter settlement) narrow/irregular Caracas, Kabul Kandahar, La Paz [46] 3 Type • II: very Informal B (precarious Delhi [54] small buildings encroachments) and high building • Basic formal areas (often resettlement colonies density, unidentifiable roads • Slum pocket Informal A (squatter • Slum area withsettlement) small buildings Delhi [85] [54] B (precarious encroachments) 5 Informal • Slum area with mix small/large buildings Mumbai • Slum area with larger buildings/chawls Basic formal areas (often resettlement colonies • Basic formal areas 2
No. 2
Table 5. Slum typologies and their categories. Categories Geographical Area
‚ ‚ ‚ ‚
‚ Slum pocket ‚ Slum areatypologies with small(Table buildings The established 5) range from two to five categories. The main factor that 5 Mumbai ‚ Slum area with mix small/large buildings influenced authors to develop such typologies is the diversity on the ground, e.g.,[85] very deprived ‚ Slum area with larger buildings/chawls areas and areas that have an unsecure tenure status but are better off in terms of building ‚ Basic formal areas characteristics. Some differences are visible in imagery and may assist in a semi-automatic slum
identification. However, none of the reviewed studies established an (semi)-automatic imageclassification approach to extract slum 5) typologies. The established typologies (Table range from two to five categories. The main factor that
influenced authors to develop such typologies is the diversity on the ground, e.g., very deprived areas Remote Sens. 2016, 8, 455; doi:10.3390/rs8060455 www.mdpi.com/journal/remotesensing and areas that have an unsecure tenure status but are better off in terms of building characteristics. Some differences are visible in imagery and may assist in a semi-automatic slum identification. However, none of the reviewed studies established an (semi)-automatic image-classification approach to extract slum typologies.
Remote Sens. 2016, 8, 455 Remote Sens. 2016, 8, 455
12 of 29 12 of 31
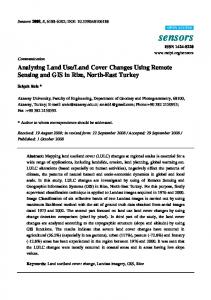
6. Data Availability and Spatial Requirements 6. Data Availability and Spatial Requirements The complexity of physical slum characteristics requires advanced sensor systems for mapping The This complexity physicalonslum characteristics advanced sensor systems for in mapping purposes. sectionoffocuses available imageryrequires data and the spatial requirements terms of purposes. This section focuses on available imagery data and the spatial requirements in terms of spatial resolution and extent (settlement to urban region level) of reviewed studies. spatial resolution and extent (settlement to urban region level) of reviewed studies. 6.1. Our Remote Eyes: Available Sensors 6.1. Our Remote Eyes: Available Sensors The successful launch of Ikonos-2 on 24 September 1999 heralded a new era of urban RS. The successful launch Ikonos-2 on 24 September 1999imagery heraldedproduced a new era by of urban RS.such The as The increased availability ofofhigh and very-high-resolution sensors increased availability of high and very-high-resolution imagery produced by sensors such as Ikonos, Ikonos, QuickBird, WorldView (very-high-resolution sensors (VHR) have spatial resolutions of the QuickBird, (very-high-resolution sensors(HR) (VHR) have have spatialbetween resolutions of 5the PAN band of WorldView 1 m and below, while high-resolution sensors 1 and m PAN spatial band of 1 m and below, while high-resolution (HR) sensors have between 1 and 5 m spatial resolutions) have provided a new and rich data repository for urban research in general and for resolutions)research have provided a new and data repository for detailed urban research general and for slumslum-related in particular, asrich it allows for a more spatialinanalysis [162]. Besides related research in particular, as it allows for a more detailed spatial analysis [162]. Besides commercial VHR imagery, since 2005, GE has provided universal web-based access to VHR imagery, commercial VHR imagery, since 2005, GE has provided universal web-based access to VHR imagery, although not providing the original spectral bands, which limits potential analysis. although not providing the original spectral bands, which limits potential analysis. An increasing number of multi-spectral (MS) and panchromatic (PAN) VHR sensors has become An increasing number of multi-spectral (MS) and panchromatic (PAN) VHR sensors has become available (see Figure 5). For instance, since August 2014, the first commercial satellite with a spatial available (see Figure 5). For instance, since August 2014, the first commercial satellite with a spatial resolution of of 0.31 mm(PAN) improvedobject-level object-levelanalysis. analysis.While While first resolution 0.31 (PAN)and and1.24 1.24mm(MS) (MS)allows allows an an improved thethe first sensors were launched by countries in the Global North, there is an increasing number of launches sensors were launched by countries in the Global North, there is an increasing number of launches of of (V)HR sensors bybycountries as NigeriaSat). NigeriaSat).Also, Also,China Chinahas has launched (V)HR sensors countriesininthe theGlobal Global South South (such (such as launched a a large number of (V)HR sensors; however, access to data from outside China is an issue. Besides optical large number of (V)HR sensors; however, access to data from outside China is an issue. Besides systems, (SAR) systems gaining increasing role in extracting information opticalsynthetic systems, aperture syntheticradar aperture radar (SAR)are systems areangaining an increasing role in extracting oninformation slums, especially sinceespecially the availability of (V)HR systems, e.g., PALSAR: m (2006), Terra SAR-X: 1m on slums, since the availability of (V)HR systems,7e.g., PALSAR: 7m (2006), (2007), 5 m (2014). TerraSENTINEL-1: SAR-X: 1 m (2007), SENTINEL-1: 5 m (2014).
Figure Overviewspatial spatial and and temporal ofof very high andand high-resolution satellites; in Figure 5. 5. Overview temporalcharacteristics characteristics very high high-resolution satellites; brackets: percentage of image data sources of reviewed publications (percentages are displayed for in brackets: percentage of image data sources of reviewed publications (percentages are displayed bands (when available): this combines the percentage of MS of and PAN (N = 122,(Nsome forthe theMS MS bands (when available): this combines the percentage MS andbands) PAN bands) = 122, publications useuse multiple image data, in addition to aerial sensors: 8.2%, GE:GE: 6.6%, and moderate some publications multiple image data, in addition to aerial sensors: 8.2%, 6.6%, and moderate resolution systems: Landsat:8.2%, 8.2%,Envisat Envisat ASAR: ASAR: 4.9%, 1.6%, MODIS: 0.8%). resolution systems: Landsat: 4.9%,Terra TerraASTER: ASTER:2.5%, 2.5%,PALSAR: PALSAR: 1.6%, MODIS: 0.8%).
Remote Sens. 2016, 8, 455
13 of 29
Analyzing the imagery used in the reviewed studies (Figure 5), we identify QuickBird, launched in 2001 with a spatial resolution of 0.61 and 2.44 m (PAN and MS) and a revisit time of 3 days, as the most frequently used sensor (33%). The revisit time does not equal repetition rate, e.g., WV-3 needs 4.5 days until capturing a scene with the same geometric characteristics (20˝ off-nadir or less at exactly the same position). While, images taken