Smoothing Based Model for Images of Isolated Buried EUV Multilayer Defects Chris H. Clifford* and Andrew R. Neureuther EECS Department, University of California, Berkeley, CA 94720 ABSTRACT A new fast-CAD imaging model for buried extreme ultra violet (EUV) mask defects is presented that exploits the smoothing process used to mitigate buried EUV multilayer defects. Since the characteristics of the smoothing process dictate nearly identical surface shapes for all defects a single parameter, the peak height of the final profile, is sufficient to predict the projection printed image for an arbitrary buried defect. Data is presented on the effect of smoothing on the reflected field and final wafer image. The degree of similarity among defects with different initial heights, widths and shapes is explored. A compact algebraic model to predict the aerial image dip strength is developed that depends only on the surface height of the EUV mask blank. This model is then integrated into a standard perturbation model for defect feature interaction, and the importance of accounting for absorber features shadowing of buried defects is demonstrated. Keywords: EUV mask, buried defect, defective multilayer, defect feature interaction, fast simulation, ray tracing, single surface approximation. Refractive Indices of Simulation Domain 0
1
1. INTRODUCTION
Y-Axis (nm) Z distance (nm)
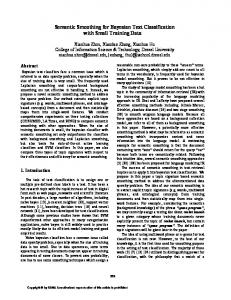
Buried defects in extreme ultraviolet (EUV) masks are Output Plane 0.98 50 one of the main hurdles in the development of EUV lithography [1]. Any method to compensate for buried 0.96 100 defects would require a reliable simulator to predict the 0.94 interaction of the defect and absorber patterns accurately. 150 This simulator would also need to be fast enough that the 0.92 Interface 200 Reference many possible layout designs and defect types could be Plane for 0.9 Near Field to simulated to assist with process and design changes. 250 Plane Wave 0.88 Conversions An example geometry which shows the complexity of the 300 mask structure is shown in Figure 1. The defect is on the 0.86 substrate below the multilayer. The multilayer is grown 350 0.84 on top of the defect, burying the defect, using the z smoothing model described in [2]. The absorber pattern 400 0.82 y sits on top of the multilayer. x 450 0.8 Many methods have been used to simulate EUV masks 0 50 100 150 200 250 300 350 400 450 500 X X-axis distance (nm) (nm) with varying speed and accuracy [3,4,5,6,7,8]. The most Figure 1. Refractive index map showing geometry rigorous method is the Finite Difference Time Domain simulated (FDTD). Unfortunately, in EUV masks FDTD is very computationally intensive and has questionable accuracy for off-axis rays. Another simulator, RADICAL, has been shown to be much more computationally efficient, while maintaining accuracy comparable to FDTD for simulating a defective EUV mask with absorber features. The fastest simulation method is the single surface approximation (SSA), but this method has been shown to be inaccurate and does not simulate absorber features [9]. RADICAL is a modular program, which means a fast multilayer simulator like SSA could be integrated into it to simulate the multilayer portion of the mask which would greatly increase the overall speed. A goal of this paper is to create an accurate model as fast as SSA to be integrated into RADICAL in the future. This paper exploits the smoothing deposition process to develop a model for the aerial image of an isolated defect that is as fast as SSA but more accurate. Since smoothing transforms arbitrary defects on the substrate into smooth and standard defects on the surface, a reduced model requiring only a single input parameter is possible. Artificially controlling the smoothing model parameters to isolate the effects of the surface and buried layers in the multilayer stack *
[email protected]; phone: (651) 238-9628
shows that a simple model that depends only on the surface defect height is possible. Finally, this model is integrated into a conventional defect feature interaction model to produce a compact algebraic model for line width variation from a buried defect. Unfortunately, more research needs to be done to account for the defect shadowing by the absorber features in this integrated model. Absorber Pattern Specifications
Incident Wave
Absorber Layout Simulator
Defect and Multilayer Specifications
FT{
Step 2
Near Field
Multilayer Simulator
}
Step 3
Step 4
Plane Wave Near Field
Step 6
Step 5
Absorber Layout Simulator
Final Result
FT{ Near Field }
Figure 2. Block Diagram of Radical
2. RADICAL A new simulator, RADICAL, was presented in [10] which can simulate EUV masks with buried defects and absorber features over 400 times faster than rigorous methods using 300 times less memory. This speedup is accomplished by simulating the absorber features and defective multilayer separately using simulation methods optimized for each. The simulator flow is shown in Figure 2. The absorber layout simulator runs without regard for the multilayer geometry and the multilayer simulator runs without regard for the absorber layout. This modularity makes the fast and accurate simulation of the entire mask possible. Step one of RADICAL is to read in the input information. Using parameters and models from [2], a multilayer geometry is created that is formatted for the multilayer ray tracing simulator. RADICAL performs step two by propagating the incident wave down through the absorber pattern with a single run of the absorber layout simulator. This step outputs the downward traveling near field at the interface reference plane shown in Figure 2. The multilayer simulator accepts plane wave inputs only, so the downward traveling near field at the interface reference plane is Fourier transformed into a set of plane waves. In step 4, each wave is reflected off the multilayer using the multilayer simulator. A near field at the interface reference plane is output for each plane wave input. The many near fields that result from the many runs of the multilayer simulator are summed together at the interface reference plane to give the total upward traveling near field reflected from the multilayer. In step five this near field is transformed, exactly as was done in step three, into a set of plane waves to be input to the absorber layout simulator for the propagation up through the absorber. Finally, the output fields of each run of the absorber layout simulator are summed. This field, the final output of the simulator, is the total upward traveling complex electric field at the output plane shown in Figure 1 The multilayer simulator, implemented by Michael Lam and described in detail in [11], is the most computationally intensive component of RADICAL. It is responsible for simulating the reflection of any incident plane wave from an arbitrary multilayer mask blank with a buried defect. The basic method of the simulator is ray tracing. Rays are traced from the top of the multilayer down to each interface below, and then the fields at each interface are Fourier transformed,
TEMPEST
RADICAL (1 processor)
(FDTD on 4 processors)
Without Improvements
Exploiting Symmetry
Using Precomputed Fields
1D Pattern (Lines)
13hour 32min
2min 43sec
1min 40sec
7sec
2D Pattern (Elbow)
13hour 32min
13min
4min
25sec
Figure 3. Runtime comparison between FDTD and RADICAL with two speed improvements for RADICAL implemented.
propagated back up through the multilayer, and summed together to give the final reflected near field. Ray tracing is a very accurate method for an EUV mask because the material interfaces within the mask are nearly perpendicular to the direction of propagation, so the direction of propagation doesn’t vary much. This simulator is as accurate, or more accurate, than the rigorous electromagnetic simulation method FDTD [11]. Figure 3 shows the runtime of RADICAL with two speed improvement methods implemented. The basic version of RADICAL is 300 times faster than FDTD for simulating a 3D defect near an absorber line. If there is symmetry in the defect, then algorithm improvements are possible to make RADICAL nearly 500 times faster than FDTD. This is because fewer multilayer simulations are required. The final column in Figure 3 shows the tremendous speed increase possible, nearly 7,000X, if the multilayer simulations are performed before the RADICAL simulation, so they can be accessed instantly as needed during the RADICAL run.
3. MOTIVATION FOR FASTER MODEL As explained above, pre-computing the multilayer response reduces the runtime of RADICAL to just a few seconds for a full 3D defective EUV mask simulation. Another way to achieve this runtime is to replace the multilayer simulator with a multilayer reflection model that has a runtime which is negligible compared to the runtime of the absorber simulation and Fourier transform steps. An example of a model that fits this speed requirement is the single surface approximation (SSA). This model to predict the nearfield is entirely described by the following equation from [7].
E ( x, y ) = e
j
4πh ( x , y )
λ
where h(x,y) is the surface profile of the EUV multilayer blank This method treats the defect as purely a phase perturbation. It sets the phase of the electric field to match the path difference between light that hits the top of the defect and the unperturbed flat part of the mask. The magnitude of the nearfield is assumed to be unaffected by the defect and constant. Unfortunately, the single surface approximation has been shown to be inaccurate and under predict the effect of defects in EUV masks [9,12]. The goal of this paper is to develop a new method which is as fast as SSA but more accurate in predicting the reflected field. The fast multilayer simulator described in [11] is able to accurately simulate an arbitrary defective multilayer geometry. But, actual multilayer geometries aren’t arbitrary. They are created using a smoothing model which transforms arbitrary substrate defects to smooth nearly Gaussian surface defects. This smoothing process has a significant effect on the reflected field from the mask and can be exploited to create a fast and accurate model for the aerial image produced by an isolated buried EUV mask defect. Surface Height as a Function of Buriend Width for Buried Height=48nm 6
Surface Height (nm)
5 4 3 2 1 0 60
Berkeley Sim Intel Experiment 65
70
75 80 Buried Width (nm)
85
90
Surface Width as a Function of Buriend Width for Buried Height=48nm 70
Surface Width (nm)
60 50 40 30 20 10 0 60
65
70
75 80 Buried Width (nm)
85
90
Figure 4. Comparison of experimental and simulated growth results for a defect with buried a height of 48nm and a square base with varying width.
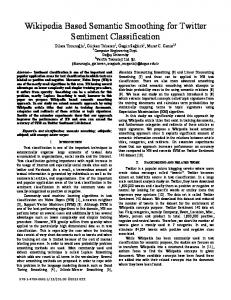
4. INTRODUCTION TO SMOOTHING Multilayer smoothing during deposition has been shown to effectively reduce printability of substrate defects. The basic method used for smoothing is to intentionally deposit excess silicon for each bilayer, and then use ion beam sputter etching to etch back the silicon to the desired thickness for each layer. Since the etch rate varies depending on the incident angle on the silicon, each layer deposited has a shorter and smoother defect than the previous layer [13]. A mathematical model has been developed to describe this growth process [2]. This model will be used, with specific input parameters varied, for all the simulations in this paper. Figure 4 shows the growth results, surface defect height and width as a function of buried defect size, from experiments and simulations. In this experiment, the buried defects had a constant height of 48nm, and square bases with widths that varied from 60nm to 90nm. The results show that the final surface defects all have relatively constant widths of about 5060nm but heights that vary from 1.5nm to 5.5nm. This is surprising because the height of the buried defects was constant and the width was varied. These results demonstrate an important feature of smoothing: surface defects from arbitrary buried defect sizes have fairly constant widths. The surface height is what is determined by the buried defect size and shape. This feature of smoothing is what makes a fast and accurate model possible.
5. ANALYSIS OF SMOOTHING
Height (nm)
250 200 150 100 50 0
50
100
150
200
250
300
350
400
450
500
300
Height (nm)
250 200 150
Dip Strength (Ibackground-Icenter)/Ibackground
Aerial Image Dip Strength for Constant Surface Defect Height 3.86nm and (FWHM): 68nm 1 Ray Tracing SSA 0.8
300
0.6
0.4
0.2
0
5
10
15
20 25 30 Buried Defect Height (nm)
35
40
45
Figure 6. Aerial image dip strength as a function of buried defect height for a constant surface defect size. NA=0.25 σ=0.75
100 50 0
50
100
150
200 250 300 X Distance (nm)
350
400
450
500
Figure 5. Multilayer geometries with smoothing model parameters adjusted to force a constant surface defect. 1 0.9
Ibackground
0.8 0.7 0.6 0.5
Icenter
The flexible model defined in [2] allows interesting and physically impossible simulations to be performed. These simulations allow the effects of certain parameters of the multilayer to be isolated to determine what is important for a fast model. For example, the smoothing model parameters can be varied to force a constant surface defect size for varying buried defect sizes. Also, for constant buried defects the model parameters can be adjusted to produce different surface defects. The reflected fields and aerial images produced by these two sets of geometries give important insight into what features are important. All simulations were done in three-dimensions. The geometries shown in the figures are cutlines. The Gaussian defects are rotationally symmetric. The box defects, referred to as “tetra,” have square bases.
0.4
Constant Surface Defect Simulations Figure 5 shows two multilayer geometries with the same size surface 0.2 defect, but different buried defects. Each surface defect has a height of 0.1 3.86nm and a full width half max (FWHM) of 67.5nm. The smoothing 0 0 50 100 150 200 250 300 350 400 450 500 process parameters were adjusted by an iterative method to produce I background − I center these geometries. The top geometry in Figure 5 has a Gaussian buried Dip = defect with a height of 10nm and a FWHM of 50nm, the bottom I background geometry has a height and FWHM of 50nm. The top geometry was Figure 7. Definition of dip strength produced by etching 0.24nm of Si for each bilayer deposition and the bottom geometry was created by etching 1.18nm. The resulting aerial image dip strengths are plotted in Figure 6. The dip strength is defined in Figure 7. Both the results from the ray tracing simulator [11] and the single surface approximation [7] are shown, the differences between the two results are discussed below. The dip strength of the aerial image is nearly constant for the constant surface defects. This is a surprising result considering the apparent differences in the geometries shown in Figure 5. It suggests that only the top surface of the multilayer determines that reflection. This is an encouraging result for modeling because if only information from the top layer is needed then a reduced model that doesn’t require the full defective mask blank geometry is possible. Upon closer inspection of the multilayer geometries in Figure 5, the results in Figure 6 are not that surprising. Most of the light reflected from an EUV mask doesn’t penetrate very deep into the multilayer stack so only the top few layers are important for predicting the reflected field. In Figure 5 the top few layers of the two geometries are nearly identical. 0.3
250
Height (nm)
0.6
300
200 150 100
0.4
50 0
0.2
0
50
300
100
150
200 250 300 X Distance (nm)
350
400
450
500
250
3.4
3.6
3.8
4 4.2 4.4 4.6 4.8 Surface Defect Height (nm)
5
5.2
5.4 Height (nm)
Dip Strength (Ibackground-Icenter)/Ibackground
Aerial Image Dip Strength for Constant Buried Gaussian Defect Height 30nm and (FWHM): 50nm 1 Ray Tracing SSA 0.8
Figure 9. Aerial image dip strength as a function of surface defect height for a constant buried defect size. NA=0.25 σ=0.75
200 150
6
Constant Surface Defect
4 2 0 -2 0
100
200 300 X Distance (nm)
400
500
Phase of Near Field (rad)
Phase of Near Field (rad)
100 Constant Buried Defect Simulations Figure 8 shows two multilayer blank geometries with identical 50 buried Gaussian defects 30nm tall and 50nm wide, but different 0 surface defects. The smoothing model parameters used are those 50 100 150 200 250 300 350 400 450 500 X Distance (nm) from the constant surface defect simulations above. The top Figure 8. Multilayer geometries with smoothing geometry was produced by etching 0.24nm of Si for each bilayer model parameters adjusted to force a constant deposition and the bottom geometry was created by etching surface defect. 1.18nm. The geometries look very similar. The upper geometry has a surface defect height of 3.28nm and the lower geometry has a surface defect height of 5.47nm. Figure 9 shows the resulting dip strength of the aerial image from these geometries and others with a constant buried defect. The minimum dip strength is 0.5 and the maximum is 0.8. This is a much more significant increase than that seen in Figure 6 for the constant surface defect case. Although the geometries in Figure 8 look very similar, discovering they produce very different images is not very surprising. The minimum defect height is 24% of the 13.5nm wavelength and the maximum defect height is 41% of the height. The interference caused by phase defects of this size relative to the wavelength should be different due to the different phases of the reflected orders created by the defect. These constant surface defect results support the evidence from the constant surface defect simulations that suggest that the surface defect profile is what affects printing. Physically small defects on the multilayer surface caused non-trivial variation in the resulting aerial image. Figure 10 gives even more insight into what parameters are important for a fast model. It shows the reflected phases for the two groups of simulations shown above. For the constant defect case, the reflected phase is virtually unchanged between the simulations. For the constant buried defect simulations, there is significant variation between the simulations. This variation in phase corresponds to the variation in dip strength shown above. This suggests that predicting the reflected phase is critical to predicting the aerial image dip. X Distance (nm)
6
Constant Buried Defect 5.47nm
4 2 3.28nm
0 -2 0
100
200 300 X Distance (nm)
400
500
Figure 10. Phases of reflected nearfields for the two types of defective blank geometries simulated. Labels correspond to surface defect height
Constant Smoothing Model The two sets of simulations above used artificial smoothing model parameters to isolate the effects of the surface and lower layers of the mask. To develop a useable model, more realistic simulations are needed. The goal of the following simulations is to develop a very fast model for defect printability. The previous simulations have suggested that by using only the surface information, the dip strength can be predicted. This set of simulations will be used to quantify that into a new fast model. Figure 4 shows actual experimental data along with simulation results calibrated to match the data. The following simulations were performed using these smoothing model parameters for many different sizes and shapes of substrate defects. The results of the smoothing simulations are shown in Figure 11. Surface Height
Surface Width
10
100 Gauss_w75 Gauss_w75
80 Surface Width (nm)
Surface Height (nm)
8
6 Gauss_w50
4 Tetra_w75
2
Gauss_w50
60
Tetra_w75 Tetra_w50
40
20 Tetra_w50
0
0
0.5
1
1.5
2
2.5
3
3
0
3.5
0
0.5
1
Buried Defect Volume (nm )
1.5
2
2.5
3
3.5
Buried Defect Volume (nm3)
5
x 10
5
x 10
Figure 11. Surface defect height and width as a function of buried defect volume. The labels correspond to the shape and width of the buried defect. The resulting height and width appears to be a predictable function of height for a given buried shape and width, but this function is different for different buried shapes and widths.
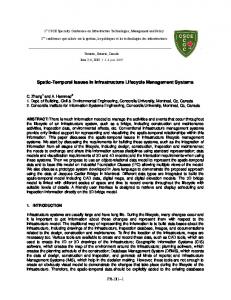
Figure 11 shows the complexity of the smoothing process. The surface defect size depends on the buried defect’s shape and size and there does not appear to be any simple model to predict the surface defect size. This strong dependence on shape means that quickly predicting the growth, and resulting image, based on knowledge of the substrate defect only would be very difficult. The resulting simulated reflected electric fields for the all of the geometries shown in Figure 11 are shown in Figure 12. These near field dip strength results are not a simple function of surface defect height. The four branches in the dip strength plot, corresponding to the four branches in the plots in Figure 11, suggest that the more complicated lower layer geometries, not just the surface profile, affect the reflected electric field magnitude. This makes a simple model for the near field dip strength impossible. Figure 14 shows the resulting aerial images computed from the electric fields in Figure 12. These results show the same single parameter dependence as the constant buried and constant surface defect cases. The major reason for the single Near Field Dip Strength 0.7
0.8 0.6 0.4 0.2
0
50
100
150
200 250 300 X Distance (nm)
350
400
450
500
10
5
0
-5
0
50
100
150
200 250 300 X Distance (nm)
350
400
450
500
Dip Strength: (background-center)/background)
Phase of Near Field (rad)
Magnitude Near Field(E)
Reflected Near Field 1
0.6
0.5
0.4
0.3
0.2
0.1
0
0
1
2
3
4 5 6 7 Surface Defect Height (nm)
8
9
10
Figure 12. Reflected magnitude, phase, and dip strength of the magnitude for the electric fields reflected from EUV mask blanks created with experimentally based smoothing parameters
parameter dependence is the smoothing process. Due to the smoothing process, the final height and width are correlated and the shape of the top surface of the multilayer is independent of buried defect shapes. Also, the surface profile is always very close to Gaussian for any buried defect geometry. This single parameter dependence means a simple and fast model for the aerial image is possible. Aerial Image Cutlines
Aerial Image Dip Strength for Constant Smoothing Model 1
0.8
0.9 Dip Strength (Ibackground-Icenter)/Ibackground
Aerial Image Intensity (E2)
0.7
0.6
0.5
0.4
0.3
0.2
0.8 0.7 0.6 0.5 0.4 0.3 0.2 0.1
0.1
0
50
100
150
200 250 300 X Distance (nm)
350
400
450
500
0
1
2
3
4 5 6 Surface Defect Height (nm)
7
8
9
Figure 14. Reflected aerial image and aerial image dip strength from EUV mask blanks created with experimentally based smoothing parameters. NA=0.25 σ=0.75 Linear Approximation of Aerial Image Dip Strength
6. ALGEBRAIC ISOLATED DEFECT MODEL
0.8
Figure 13 shows how well the dip strength of the aerial image can be approximated by a linear model for small defects. This means that the results of a simulation that would take days with TEMPEST and minutes with RADICAL can now be predicted instantly. The following formula gives the dip strength as a function of surface defect height.
Dip Strength (Ibackground-Icenter)/Ibackground
0.7 0.6 0.5 0.4 0.3 0.2
Dip(h) = 0.191nm −1 ⋅ h − 0.094
0.1 0 -0.1
0
0.5
1
1.5 2 2.5 3 3.5 Surface Defect Height (nm)
4
4.5
5
7. MODIFIED SINGLE SURFACE APPROXIMATION
The algebraic model above is more accurate than the single surface approximation, though it actually requires less information than SSA. Unlike the single surface approximation, this model has no physical basis; it’s just a curve-fit of simulation results. The single surface approximation on the other hand has real physical meaning. It turns out that SSA can be modified slightly to produce better results while still being physically based. In Figure 6, Figure 9 and the left plot of Figure 16 below, it’s clear that SSA consistently under predicts the printability of buried defects. The reason for the error is shown clearly in Figure 15. On the left, the reflected phases from the standard SSA model and ray tracing simulator are shown. The SSA phase change due to the defect is less than the actual phase change calculated by ray tracing. This is an important result because it shows that even though the reflected phase is determined mainly the surface defect profile, it isn’t just a phase correction based on path difference as SSA assumes. There is actually a more pronounced effect due to the lower layers in the multilayer. Since, due to smoothing, each layer has a slightly lower defect height than the defect below it, using a lower layer as the “single surface” in SSA produces more accurate results. For this smoothing model it turned out that using the third layer from the top makes the results of SSA most accurate. Because the light reflected does propagate down to layers below the top surface, using a lower layer as an effective or average single surface is a physically reasonable model. The right plot in Figure 15 shows that using this lower layer produces a more accurate reflected phase. The right plot in Figure 16 shows that for small defects this Figure 13. Linear portion of aerial image dip strength from Figure 14 with linear fit.
4
Phase of Near Field (rad)
Phase of Near Field (rad)
modified SSA becomes more accurate than the standard SSA method. Small defects, less than 4nm on the multilayer surface, are assumed to be the most important because as substrate quality and smoothing methods improve large defects will become rare, but small defects that still affect printing will remain. It’s important to note that in [7] SSA was introduced and used with a separate approximate method to predict the aerial image. Previous publications have used both SSA and the approximate aerial image method and concluded that SSA was very inaccurate [12]. Figure 16 shows that when a more rigorous and accurate aerial image simulator is used, the near fields generated by SSA are fairly accurate, even without the lower surface modifications. Also, the accuracy variation of SSA with varied smoothing is shown in Figure 9. As the surface defect size increases, the effects of smoothing decrease. Therefore, the top surface layer profile is a better approximation for the lower layer profiles, making SSA more accurate SSA Phase Ray Tracing Phase
3 2 1 0 0
50
100
150
200 250 300 X Distance (nm)
350
400
450
4
SSA Phase Ray Tracing Phase
3 2 1 0 0
500
50
100
150
200 250 300 X Distance (nm)
350
400
450
500
Figure 15. Comparison of phase of reflected field between SSA and ray tracing from a 3.2nm tall surface defect. Left: Standard SSA Model. Right: Modified SSA model using lower layer A erial Im age Dip S trength for C ons tant S m oothing M odel
A erial Im age Dip S trength for C ons tant S m oothing M odel
1
1
background
0.8
)/I
0.7
background center
0.6 0.5 0.4
Dip Strength (I
Dip Strength (I
M odified S S A
0.8 0.7 0.6
-I
background
)/I
0.9
SSA
-I
background center
Ray Trac ing
R ay Trac ing
0.9
0.3 0.2
0.4 0.3 0.2 0.1
0.1 0
0.5
1
2
3
4 5 6 S urfac e Defec t H eight (nm )
7
8
9
0
1
2
3
4 5 6 S urfac e Defec t H eight (nm )
7
8
9
Figure 16. Plots of aerial image dip strength for ray tracing and SSA as a function of surface defect height. Left: Standard SSA method on top surface. Right: Modified SSA method using lower surface
8. PREDICTING CD VARIATION USING IMAGE PERTURBATION A buried defect aerial image dip strength model by itself is not very useful. What is important is being able to calculate the effect of the defect on features. Work has been done previously to quickly estimate the change in linewidth from a defect for conventional DUV lithography [14], and this work can be extended to use the algebraic dip strength model presented above. The first step to extend the model is to convert the dip strength formula above into a formula for minimum intensity. Assuming the defect free background level is one this becomes:
I min = 1 − mdefect ⋅h SurfaceDefect +bdefect where
mdefect = 0.191nm and bdefect = −0.094
The defect perturbation model from [14] assumes the following simple form to predict the change in intensity from a defect:
I min = 1 + 2 ⋅ E Defect ⋅ cos(− φ Defect ) Combining the two equations for Imin gives the following value for |EDefect|, assuming φdefect=0.
E Defect =
mdefect ⋅h SurfaceDefect +bdefect 2
The following expressions predict the intensity at the edge of a line in the presence of a defect.
I edge = I NoDefect + 2 ⋅ I NoDefect ⋅ E Defect cos(φ Defect ) = I NoDefect + 2 ⋅ I NoDefect ⋅
mdefect ⋅h SurfaceDefect +bdefect 2
To calculate the change in linewidth, the change in intensity due to the defect must be divided by the slope of the aerial image.
∆L =
∆I edge ImageSlope 2
=
I NoDefect ⋅ (m Defect ⋅hSurfaceDefect + bDefect ) ImageSlope
3 s
0
10
Distance (nm)
20
30
40
50
60 0
10
20
30 40 Distance (nm)
50
60
Figure 17. Aerial image produced by a 3D FDTD TEMPEST simulation of a buried defect producing a 3.19nm tall surface defect. The cutline shown is at I=0.3.
Figure 18. 2D cutline of mask geometry simulated in TEMPEST
Assuming a threshold of Iedge=0.3 and using an image slope of 0.0471nm-1, which was derived from an aerial image simulation of a defect free mask, the predicted line width change is ∆L=6.0nm for a 3.19nm tall defect. Figure 17 shows the aerial image results of a rigorous FDTD simulation of a 32nm line on the wafer with a 3.19nm tall defect on the mask. The linewidth change predicted by this rigorous simulation is only 3.8nm, which is much less than the 6.0nm predicted by the algebraic model. Further inspection of the TEMPEST simulation geometry gives some insight into this difference. Figure 18 shows a cutline of the geometry simulated in TEMPEST. The defect is centered directly below the edge of the absorber, which means that half of the defect is covered by the absorber. The simplest way to correct for this is to just reduce the effect of the defect by 50%, to account for the 50% of the defect that is covered. This changes the algebraic prediction to a linewidth change of 3nm. This is closer, but still 27% different than the FDTD results. For this simple algebraic method to be useful in predicting linewidth variation, future research is required to develop a method to scale the effect of the defect as a function of position relative to absorber.
9. CONCLUSION A new method has been presented to instantly and accurately predict the dip strength of the aerial image resulting from an isolated buried defect in an EUV mask blank. A careful analysis of the effects of smoothing to isolate what geometry characteristics are important was performed. When smoothing parameters were chosen to force a constant surface profile for different buried defects, the resulting aerial image dip strengths were fairly constant. For constant buried
defects, but varying surface defects, the aerial image dip strength varied significantly. This showed that the most important characteristic of a defective EUV mask blank is its surface profile. It was shown that the reflected phase determines the aerial image on the wafer, but the reflected phase isn’t simply determined by the standard single surface approximation. A modified SSA model, using the third layer in the multilayer stack, was shown to be more accurate than the standard SSA model. Also, the results of many simulations for different buried defects, but constant smoothing model parameters, were accurately described by a simple linear formula depending only on surface defect height for small defects. This linear approximation was integrated into a conventional defect feature perturbation model. The shadowing of defects by the absorber added a complication to this model that requires further research to understand. But, even with this complication, this paper shows that full ray tracing simulations may not me necessary to predict the effect of a buried defect. Defects will likely be a reality in production EUV lithography, but fast models should make understanding and compensating for these defects a simpler and faster process. Acknowledgements: This research was funded by a grant from Intel Corp. Aerial image simulations were performed using EMSuite from Panoramic Technology Inc.
1. 2 3 4. 5 6. 7. 8 9. 10 11 12 13 14
The National Technology Roadmap for Semiconductors (ITRS) Stearns, D.G., et al., “Localized defects in multilayer coatings”, Thin Solid Films 446 Issue 1, 37-49 (2004). Bollepalli, B.S., et al. “On the computation of reflected images from extreme ultraviolet masks.” Proc. SPIE 3676, (1999). Gordon, R. L., et al., “Mask Topography Simulation for EUV Lithography,” Proc. SPIE 3676, (1999). Pistor, T., et al., "Extreme ultraviolet mask defect simulation: low-profile defects," J. Vac. Sci. Technol. B 18, 2926–2929 (2000). Brukman, M., et al. “Simulation of EUV Multilayer Mirror Buried Defects,” Proc. SPIE 3997, (2000). Gullikson, E. M., et al. “Practical approach for modeling extreme ultraviolet lithography mask defects,” J. Vac. Sci. Technol. B 20, 81 (2002). Erdmann, A., et al. “ Efficient simulation of light diffraction from three dimensional EUV masks using field decomposition techniques,” Proc. SPIE 5037, (2003) Lam, M.C., et al., “Modeling methodologies and defect printability maps for buried defects in EUV mask blanks,” Proc. SPIE 6151, (2006). Clifford, C. H., et al. “Fast Three-Dimensional Simulation of Buried EUV Mask Defect Interaction with Absorber Features,” Proc. of SPIE 6730, (2007). Lam, C. H., et. al. “A 3D substrate and buried defect simulator for EUV mask blanks,” Proc. of SPIE 5751, (2005). Deng, Y. et al. “Models for characterizing the printability of buried EUV defects,” Proc. of SPIE 4343, (2001). Rajul, R., et al. “Defect Mitigation and Reduction in EUVL Mask Blanks,” Proc. of SPIE 6517, (2007). Neureuther, A.R., et.al. “Coherence of defect interactions with features in optical imaging,” J. Vac. Sci. Technol. B 5, 308-312 (1987).