Judd and Kennedy
313
Software and Internet usage in a shared computing environment Terry S. Judd and Gregor E. Kennedy Biomedical Multimedia Unit The University of Melbourne, Australia Abstract We describe the development and implementation of a monitoring system for capturing and analysing sessional data on software and Internet usage on shared computer workstations. The system was installed on 80 workstations across several locations within our faculty. Results from one location containing 49 workstations covering the first eight weeks of Semester I, 2005 are presented. Forty-one applications were monitored and these were launched a total of 11,339 times during 6,303 sessions averaging 56 minutes. Web-browsers were used during 94% of sessions and accounted for more than half of all application usage. Thirty-three of the 41 applications are specialised teaching software and all were used at least once during the study period. Casual (unscheduled) usage of several of these increased corresponding to their recommendation by course coordinators. Students viewed 118,000 web pages during the first five weeks of the study. Internal (University) sites accounted for 51% of all pages visited with the Faculty’s learning management system being the most frequented location. Web-based email providers were the most commonly accessed external sites. Some potential applications of software and Internet usage data in relation to computer-based teaching resources are discussed. These data can be employed independently to provide simple measures of ‘usefulness’ or can be combined with other techniques (including more sophisticated automated monitoring approaches) to inform a wide range of evaluation and research-related activities.
Introduction Legitimate monitoring of software and computer usage is employed to inform a range of activities from basic asset management and Internet usage to sophisticated usability studies (e.g. Baron & Spiliopoulou, 2004; Hilbert & Redmiles, 2000). A variety of methods are employed, including self-reporting by users (e.g. surveys and interviews), direct or indirect observation, web-log analysis, and automated software-based agents. Automated monitoring can be particularly useful in situations where data needs to be collected in naturalistic settings and/or for large numbers of users (Hilbert & Redmiles, 2001). In such situations it has the added advantages over self-reporting of being unprejudiced by either researcher or user bias and of generally avoiding the need to recode data prior to analysis. The Faculty of Medicine, Dentistry and Health Sciences (Faculty) at The University of Melbourne has a strong record of promoting the development and implementation of educational technologies that support the delivery of its various curricula. This is particularly true for the undergraduate medical degree, which over the last five years has moved from a traditional to a problem-based format. Self-directed learning is a key tenet of the problem-based approach and educational technology plays a crucial role in facilitating and supporting students’ access to, and use of, course-related resources (Harris, Keppell, & Elliott, 2002; Kennedy, Kennedy, & Eizenberg, 2000; Keppell, Kennedy, Elliott, & Harris, 2001). The Biomedical Multimedia Unit (BMU) is a research and development unit located within the Faculty. Its mandate is to support the design, development, implementation and evaluation of technology for teaching and learning. The BMU is active in the design and development of both web-based and standalone resources, with the former typically delivered through a learning management system (LMS) and the latter installed on computers in shared spaces across a number of on and off-campus locations. The Faculty provides on-campus general computing and Internet access to students via approximately 80 Macintosh computers located in either the Student Computer Resource Centre (SCRC), (50 workstations in two adjoining rooms) or individually in tutorial rooms. All 80 workstations are managed through a networked server. Despite minor differences in their configuration, both the SCRC and tutorial room workstations provide students with access to the same set of preinstalled software and networked services.
314
ascilite 2005: Balance, Fidelity, Mobility: maintaining the momentum?
Regular and ongoing evaluation of the resources it develops is a fundamental component of the BMU’s activities. It typically begins during the design phase and continues, in various forms, right through to deployment and integration with the target curriculum (Kennedy, 2003; Kennedy, Eizenberg, & Kennedy, 2000; Liaw, Kennedy, Keppell, Marty, & McNair, 2000). Software-based monitoring approaches play an important role in this process. In particular, they aid in the identification and resolution of usability and educational design issues (Judd & Kennedy, 2001a; 2001b; Kennedy & Judd, 2004). However, while such monitoring provides detailed information on the way users interact with specific aspects of individual resources, it cannot address some of the broader issues that are of interest at a Faculty or wider level: namely how do students use computer-based resources generally and what relationships, if any, exist between their use of individual resources? Resolution of these issues requires input from a system or systems that are capable of monitoring the use of any computer-based resource by students, not just those developed in house, across many computers and multiple locations. While systems that monitor general application and Internet usage (and more) are commercially available, they lack either Macintosh support (e.g. Track4Win: www.track4win.com, Spector: www.spectorsoft.com) or key capabilities (e.g. AppTracker: www.cyberkare.com, netOctopus: www.netopia.com). The use of such systems may be relatively commonplace in corporate environments (Barlow, Bean, & Hott, 2003) but if the available literature (or lack of) is anything to go by, their level and type of use in educational settings is an unknown quantity. The remainder of this paper describes the development and implementation of a customised monitoring system designed to meet our specific technical and educational requirements. We present some preliminary data collected by the system and discuss its implications in relation to the administration and evaluation of educational technology within our own Faculty and the wider educational community.
Methods The monitoring system consists of two components: a software agent that is installed on each client workstation, to collect and store data on application and Internet usage, and a parsing application that collates and processes these data. Both the agent and parsing tool were created using Revolution (www.runrev.com), a cross-platform rapid application development tool. The agent The software agent runs as a background process and is automatically launched when a user logs in. It collects data on a sessional basis — a session begins when the user logs in and ends when they log out — and writes output (xml) to a logfile when the user logs out (or their session is timed out). It collects three types of data: applications used, web pages visited and documents opened. The agent’s primary function is to log which applications are used, when they are used and for how long. Only sanctioned applications are logged, a list of these being provided in a settings file that is read by the agent during startup. Applications are monitored by regularly polling the current application processes. The returned list is compared to the list of sanctioned applications and a subset of this list that includes those applications that have been launched during the current session and whether or not they are currently active (or at least whether they were active when the previous poll was conducted). Through these comparisons it is possible to determine, with the accuracy the polling frequency, when a sanctioned application has been launched or quit. A list of web pages visited during a session is captured at the end of each session by determining which browsers were launched during the session and parsing the contents of their history files. The agent clears all history files at the start of each session so that only those pages visited during the current session are captured. The parsed data are saved in a standard format that includes the page title, the full url and the number of times the page was visited during the session. A list of opened documents is similarly collated at the end of each session by parsing the user’s ‘recent items’ list. This list is also cleared at the beginning of each session. The parser The parsing application can simultaneously import any number of logfiles. These can then be filtered on the basis of computer name, by selecting individual files to be included or excluded, and/or by time interval. It produces the following output:
Judd and Kennedy
315
•
basic statistics on computer usage, including the number of sessions and the combined session time for all records
•
the number of uses and average use-time for each sanctioned application
•
a composite list of visited page urls
•
a composite list of opened documents.
The returned list of page urls can then be further processed by applying a series of filters based on user-defined partial urls. Related filters are grouped into categories and can be applied selectively and sequentially to generate lists of pages corresponding to the various categories and a residual list comprising urls of unspecified origin. Filters have been developed iteratively by filtering the urls, examining the residual for common or related urls and using these to modify existing or create new filters. We currently apply an initial filter to separate page urls into ‘internal’ (i.e. those with a ‘unimelb.edu.au’ address) and ‘external’ sites before processing them with different filter sets. Our document filtering procedure is less advanced at this stage with a simple distinction being made, based on assumptions relating to file types and paths, between documents created by the user (predominantly Microsoft Office documents), documents being downloaded via the Faculty’s LMS (exclusively PDFs) and documents being downloaded from external websites (predominantly PDFs). The list of downloaded documents can be verified by parsing the page urls for the session where necessary. Implementation The software agent is currently configured to monitor 41 individual applications, which we have grouped into four categories: (i) teaching software (self-contained educational programs), (ii) web-browsers, (iii) web-helper applications (PDF and QuickTime viewers), and (iv) productivity applications (Microsoft Office suite). Web page visits are monitored for the following three browsers; Safari, Internet Explorer and Netscape. Software usage is being monitored in both the SCRC and tutorial rooms on an ongoing basis and will continue at least until the end of 2005. The data presented below are preliminary and span the first eight weeks of semester (14/2/05 to 10/4/05). The data are limited to the SCRC workstations and are related only to application and Internet usage (i.e. document capture and filtering are not reported). Privacy Privacy is obviously a concern in any situation where users are monitored covertly. We are required to seek ethics approval before undertaking this type of monitoring and we openly inform users that their activities may be monitored and used for evaluation purposes. We currently employ generic logins — users need only enter their computer’s ‘name’ to initiate a valid login. However, this will change later in 2005 when all workstations in the SCRC will move to centrally managed individual logins. When that occurs we will implement measures to de-identify the collected data by encoding login information. Logfiles are currently stored locally and are collected intermittently using a networked software management system. These logfiles will be phased out and sessional data will instead be stored in a secure networked database once individual logins are implemented.
Results General usage The software agent accurately captured and stored sessional data on application, web page and document usage for 80 Macintosh workstations across a number of locations over the eight-week study period. The forty-one monitored applications were launched 11,339 times during 6,303 sessions across the 49 workstations (one of the original 50 workstations ‘died’ halfway through the study) in the SCRC. The average session time was 56 minutes. Applications Web browsers were used in 94% of all sessions and accounted for more than half of all applications used, rising to 78% when combined with helper applications. Teaching software accounted for a further 13% of all applications used, with the remaining 9% attributable to the various Microsoft Office applications.
316
ascilite 2005: Balance, Fidelity, Mobility: maintaining the momentum?
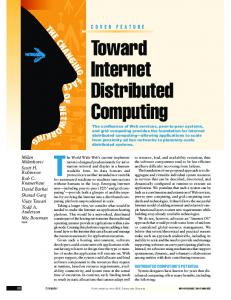
Web browsers Of the three available web browsers (Safari, Internet Explorer and Netscape), Internet Explorer was clearly the web browser of choice accounting for 73% of all uses. Safari was the least favoured (7%), despite being the default browser. Individual browser and helper application usage remained relatively consistent throughout the study period. 90 80 70
Internet Explorer
60
Netscape
50
Safari
40
Adobe Reader Preview
30 20 10 0 1
2
3
4
5
6
7
8
Week
Figure 1: Use of web browser and browser helper applications Productivity applications Microsoft Word was the most frequently used of the three productivity related applications and was the fifth most used application overall. Whereas all other browser, helper and productivity applications attracted relatively consistent levels of usage during the sampling period, usage of Word showed a clear increasing trend. 25 Word Excel
20
Powerpoint
15
R 2 = 0.78
10 5 0 1
2
3
4
5
6
7
8
Week
Figure 2: Use of productivity-related applications Teaching applications All 33 teaching applications were used during the data collection period, with usage ranging from one (for five separate applications) to 600 times. Only 10 of the 33 applications were used on more than 10 occasions. Average usage times for individual applications were highly variable although they were typically low (less than 10 minutes) for most of the less used applications, suggesting that users were ‘browsing’ rather than actively engaging with these applications.
Judd and Kennedy
317
Six of the teaching applications were recommended, at different times, as resources to second-year medical students during the course of the study. Usage of these applications is presented in Figure 3. With the exception of an@tomedia, usage of all rose from a very low base rate to peak during the week/s in which they were recommended. This effect was most pronounced for Tired Patient, although its usage figures include a scheduled class session during week 4 that accounted for approximately half of its use during that week. Use of the other five applications during the study period was entirely self-directed and optional. Disregarding an@tomedia and assuming each application was used by any given student only once during the study period, uptake of this selection of teaching applications by students (based on a annual student cohort of 220) ranged from 17% (Gas Exchange) to 86% (Tired Patient) and mean usage times varied from 17 (Cardiac Cycle) to 38 minutes (Hypercardiac). The markedly different pattern of usage of an@tomedia (see Figure 3) was probably due to: (a) its format (i.e. an encyclopaedic reference on human anatomy) with content relevant to many aspects of the medical curriculum, and (b) familiarity, given most if not all second (and later) year medical students would previously have used it extensively. 14
an@tomedia Tired Patient
12
MedicalGenetiX 10
Gas Exchange Cardiac Cycle
8
Hypercardiac
6 4 2 0 1
2
3
4
5
6
7
8
Week
Figure 3: Use of selected teaching applications; larger symbols indicate weeks when individual applications were recommended by subject coordinators Web pages A total of 118,000 web pages were visited during the first five weeks of the study period with 51% accounted for by Melbourne University sites. Of these internal pages, almost 10% were accounted for by the browsers’ default home pages. Pages within the Faculty’s LMS were the most visited (34.3% of all internal urls), followed by the University’s web-based email (20%), LMS (6.9%) and library (6.7%), (see Figure 4). This level of access of pages located within the Faculty’s LMS represents approximately 25% of total LMS-related access according to a recent survey (Petrovic & Kennedy, 2005). Web pages located within the Faculty but outside its LMS accounted for 5.4% of internal pages while student-centred (vs. course or content-centred) sites outside of the Faculty accounted for a further 8.3%. Approximately 8% of all internal urls were not classified during the filtering process. Of the external pages visited (see Figure 5), 37.2% were communication related. Of those, the vast majority (84.1%) were related to web-based email. Web-based forums, blogs, sms and messaging attracted consistent but comparatively low levels of visitation compared with social networking sites (e.g. www.friendster.com), which were surprisingly popular (see Figure 6). Search-related sites accounted for 10.6% of external urls, with the majority (72.4%) attributable to the major search engine sites (predominantly Google). Specialised biomedical reference sites attracted 21.3% of all search-related hits, with the remaining 6.3% of search-related pages accounted for by general reference sites (e.g. online dictionaries), directory sites (e.g. ‘White Pages’, street directories) and online journals not accessed through the library.
318
ascilite 2005: Balance, Fidelity, Mobility: maintaining the momentum?
Other major categories of urls visited included financial sites (6.9% of external urls — banking and shares), leisure related sites (7.5% — sports, games, music, eFiction and entertainment) and portals (3.5% — Yahoo and MSN). Approximately 22% of all external urls were not classified during the filtering process. other 2%
student information 3%
unspecified 8%
Faculty LMS 34% student portal 4% MDHS sites 5% library 7%
University LMS 7%
default home pages 10%
email 20%
Figure 4: Major destinations of internal (University) web pages visited by students — ‘Other’ category is an amalgamation of several minor categories; ‘Unspecified’ category includes all pages not captured by internal filters; LMS = learning management system; MDHS = Faculty of Medicine, Dentistry & Health Sciences
unspecified 22% communicate 36%
other 16%
financial 7%
search 11% leisure 8%
Figure 5: Major destinations of external web pages visited by students — ‘Other’ category is an amalgamation of several minor categories; ‘Unspecified’ category includes all pages not captured by external filters
Judd and Kennedy
blogs 3%
sms 3%
messaging 2%
319
forums 1%
social networks 8%
email 83%
Figure 6: Breakdown of ‘communication’ category of external web pages visited by students
Discussion The monitoring system we designed and implemented enabled us to successfully capture and analyse general application and Internet usage data. Although rudimentary, such analyses can nevertheless prove extremely valuable in educational settings by contributing data that can feed into a range of administration, evaluation and research-related programs of various levels of sophistication. For example, while it has generated monthly web-usage statistics for some time, prior to the current study our Faculty possessed little or no data on application usage on its shared student workstations. Even basic computer usage information (i.e. which workstations were being used, when and for how long) was minimal and limited to bookings of scheduled classes in the SCRC. Analysis of data captured by our system revealed that even that data was unreliable with some bookings clearly not being kept and other unscheduled classes being run during the study period. Moreover, casual usage, which we estimate accounted for around 90% of all activity during the study period, was not monitored in any systematic way. At a basic level computer usage data can assist our IT administrators and delivery staff to more accurately match resources with demand. Are any computers under-utilised? Are there sufficient computers to meet peak demand? What is peak demand and when and where is it likely to occur? Similarly, basic application usage statistics can reveal whether particular applications are widely or rarely used and whether these usage levels are consistent or variable. Answers to these types of questions have obvious economic ramifications relating to hardware and software purchasing and licensing and required levels of support and maintenance. Basic usage data can also provide some measure — sometimes the only available measure — of the relative ‘usefulness’ (a term coined by Grudin in 1992 to embrace both usability and utility) of the various software-based resources available to students. For example, the monitoring system provides data on what software students are using, when they are using it and for how long they are using it. In our case we also know that the majority of students’ use of workstations (generally) and individual resources (specifically), is casual and that much of this casual usage (web browsing excepted) is related to self-directed learning activities. Thus, assuming that all applications are equally accessible, those that attract little and/or superficial use (indicated by short access times) are nominally less useful than applications that are used frequently and intensively. Of course, the usefulness of any given resource is not necessarily constant but may wax and wane over time in line with its relevance to the curriculum. This effect is demonstrated by the comparison of several applications that were recommended as resources by subject coordinators during the study period. On the above criteria, the usefulness of five of the six applications increased in line with their recommendation (see Figure 3). Given that all six applications were recommended to and used by the same cohort of students we might also infer that Tired Patient (used by 86 % of students; average usage time = 36 mins) was generally more useful than Gas Exchange (used by 17% of students; average usage time = 18 mins). To probe deeper requires additional data. These might include questionnaire, interview, or even observational data. Alternatively, or additionally, we can and do employ automated monitoring techniques to gather more detailed information on how users interact within individual software environments. Software agents that capture keystrokes (e.g. MonitorerX Pro — www.red-byte.com) make this type of monitoring possible for virtually any environment, web-browser, teaching application or otherwise.
320
ascilite 2005: Balance, Fidelity, Mobility: maintaining the momentum?
However, unravelling the data collected by these keystroke agents and associating it with specific tasks and activities in a meaningful way can be an onerous and difficult task (Thomas, Kennedy, Crease, Draper, Evans, Gray et al., 2003). We are fortunate in that many of the teaching applications installed on the workstations in the SCRC and tutorial rooms have been developed in-house, providing us with the opportunity to embed and configure customised monitoring capabilities during their development. We have developed a separate monitoring system for this task (Judd & Kennedy, 2001a). It includes versions that are compatible with a range of authoring environments (Director, Flash, Revolution, HTML/Javascript) and can be configured to collect virtually any type of information or behaviour that is related to or mediated by mouse or keyboard actions by the user. To date, data collected by this system have been used as the basis for both evaluation and research-focused investigations, whose aims vary from formative evaluation of instructional tasks (Judd & Kennedy, 2001b; Kennedy & Judd, 2000) to the verification of learning designs (Kennedy & Judd, 2004). Data analysis is often complex and highly specialised and we have developed, or adopted from other domains, a range of analytical techniques, including data clustering and ordination approaches and sequence analysis (Hilbert & Redmiles, 2000; Judd & Kennedy, 2004; Kennedy & Judd, 2004). One of the outcomes of these investigations has been the identification and classification of recurrent patterns of use within individual resources, to create profiles of common user types (Kennedy & Judd, 2004). As we gather more data from the application and Internet monitoring system described we expect to be able to extend this type of analysis to students’ use of computer-based resources in general. Our ability to do so will be enhanced once individual logins are implemented in the SCRC by allowing us to combine sessional data for individual users. Planned improvements to the software agent should also help. By extending our current polling routine to monitor the foreground application (and the name of its topmost window and any other relevant information where applicable), we will be able to construct accurate historical records of users’ activities, including critical transitional movements between resources.
References Barlow, J., Bean, L., & Hott, D. D. (2003). Employee “spy” software: Should you use it? Journal of Corporate Accounting & Finance, 14(4), 7–12. Baron, S., & Spiliopoulou, M. (2004). Monitoring the evolution of web usage patterns. Lecture Notes in Computer Science, 3209, 181–200. Grudin, J. (1992). Utility and usability: Research issues and development contexts. Interacting with Computers, 4(2). Harris, P. J., Keppell, M., & Elliott, K. A. (2002). Integration of multimedia in the problem-based learning curriculum. Journal of Medical Education, 6(4), 24–30. Hilbert, D. M., & Redmiles, D. F. (2000). Extracting usability information from user interface events. ACM Computing Surveys, 32(4), 384–421. Hilbert, D. M., & Redmiles, D. F. (2001). Large-scale collection of usage data to inform design. In M. Hirose (Ed.), INTERACT ‘01: Proceedings of the 8th IFIP conference on human–computer interaction (pp. 569–576). Tokyo: IFIP. Judd, T. S., & Kennedy, G. E. (2004). More sense from audit trails: Exploratory sequential data analysis. In R. Atkinson, C. McBeath, D. Jonas-Dwyer, & R. Phillips, (Eds.), Beyond the comfort zone: Proceedings of the 21st annual ascilite conference (pp. 476–484). Perth: Australasian Society for Computers in Learning in Tertiary Education. Judd, T., & Kennedy, G. (2001a). Extending the roles of audit trails: A modular approach. Journal of Educational Multimedia and Hypermedia, 10(4), 377–395. Judd, T., & Kennedy, G. (2001b). Flexible audit trailing in interactive courseware. In C. Montgomerie & J. Viteli (Eds.), Ed-Media 2001: World conference on educational multimedia, hypermedia & telecommunications (pp. 943–948). (n.p.): AACE. Kennedy, D., Eizenberg, N., & Kennedy, G. (2000). An evaluation of the use of multiple perspectives in the design of computer facilitated learning. Australian Journal of Educational Technology, 16(1), 13–25. Kennedy, G. E. (2003). An institutional approach to the evaluation of educational technology. Educational Media International, 40(3/4), 187–199.
Judd and Kennedy
321
Kennedy, G. E., & Judd, T. S. (2004). Making sense of audit trail data. Australasian Journal of Educational Technology, 20(1), 18–32. Kennedy, G., & Judd, T. (2000). Pilot testing of a system of electronic evaluation. In R. Sims, M. O’Reilly & S. Sawkins (Eds.), Learning to choose: Choosing to learn: Proceedings of the 17th annual ascilite conference [Short papers and works in progress] (pp. 187–192). Lismore, NSW: Southern Cross University Press. Kennedy, G., Kennedy, D., & Eizenberg, N. (2001). Integrating computer facilitated learning resources into problem-based learning curricula. Interactive Multimedia: Electronic Journal of Computer-Enhanced Learning, 3(1). Keppell, M., Kennedy, G., Elliott, K., & Harris, P. (2001, April,). Transforming traditional curricula: Enhancing medical education through problem based learning, multimedia and web based resources. Interactive Multimedia: Electronic Journal of Computer Enhanced Learning, 3(1). Liaw, T., Kennedy, G., Keppell, M., Marty, J., & McNair, R. (2000). Using multimedia to assist students with communication skills and biopsychosocial integration: An evaluation. Australian Journal of Educational Technology, 16(2), 104–125. Petrovic, T., & Kennedy, G. (2005). TopClass evaluation, 2004. Unpublished report, Faculty of Medicine, Dentistry & Health Sciences, The University of Melbourne. Thomas, R., Kennedy, G., Crease, M., Draper, S., Evans, H., Gray, P. et al. (2003). Generic usage monitoring of programming students. In G. Crisp, D. Thiele, I. Scholton, S. Barker & J. Baron (Eds.), Integrate, interact, impact: Proceedings of the 20th annual ascilite conference (pp. 715–719). (n.p.): Australasian Society for Computers in Learning in Tertiary Education.
Acknowledgments Alvin Wong assisted with the installation and administration of the monitoring system and provided technical advice during its design and development phase. Wai Chan helped to develop a routine for parsing Netscape history files. Lauren Bennett provided valuable comments on an earlier draft of the manuscript.
Author contact details Terry Judd (
[email protected]) and Gregor Kennedy (
[email protected]) Biomedical Multimedia Unit Faculty of Medicine, Dentistry & Health Sciences The University of Melbourne, 3010 Vic, Australia Copyright © 2005 Terry S. Judd and Gregor E. Kennedy The author(s) assign to ascilite and educational non-profit institutions a non-exclusive licence to use this document for personal use and in courses of instruction provided that the article is used in full and this copyright statement is reproduced. The author(s) also grant a non-exclusive licence to ascilite to publish this document on the ascilite web site (including any mirror or archival sites that may be developed) and in printed form within the ascilite 2005 conference proceedings. Any other usage is prohibited without the express permission of the author(s).


![Internet Usage in a Malaysian Sub-Urban Community - CiteSeerX [PDF]](https://m.moam.info/img/260x300/internet-usage-in-a-malaysian-sub-urban-community-_647d750c098a9e007d8b458d.jpg)