Software Development Process Enhancement: a Framework for Decision-Making Support Department of Computer Science and Civil Engineering Ph.D. in Computer Science ...
Software Development Process Enhancement: a Framework for Decision-Making Support Giovanni Cantone Advisor
Manuel Mastrofini Ph.D. Candidate
Forrest Shull Co-Advisor
Department of Computer Science and Civil Engineering Ph.D. in Computer Science, Control and Geoinformation Ph.D. Program Coordinator: Giovanni Schiavon
2010-2013
Page intentionally left blank.
2 | Software Development Process Enhancement: a Framework for Measurement-Based Decision-Making
Acknowledgements At the very beginning, I thought it would have been fun writing this part of the thesis. Now that I am doing it, I actually believe it is a good thing that everyone who collaborated to this achievement be aware and can receive the due recognition. This way, everyone will share his or her own responsibilities and will not be allowed to complain that it does not work, it is not clear, it is boring and blablabla. However, do not try to get too much credit: I did it. It is my treasure. You just somehow contributed.
Also, you may remember that in my Master thesis, other than a few typos, I mentioned everyone, name by name. This time I decided to be slightly less explicit and much more concise, so let’s start.
Everything I have done, I dedicate it to my family. My extended family, the ones I love. I hope they are proud of me, as this would make me proud of myself. And happy. I owe a profound and sincere gratitude to Prof. Giovanni Cantone, carrot and stick and continuous encouragement, as well as to Dr. Forrest Shull, illuminating guide. I still strongly believe that, without friends, life would be very sad and ugly. I am lucky, because I have some of these friends that still walk on my side, as I walk on their side, so that we are not alone when it is stormy where we are.
As of today, challenges keep coming, but I am steady. So, please, stay with me, do not leave me alone, and I will keep being steady and will keep walking on your side. As a reward, I will thank you also in my next acknowledgment section (which is going to be something that you really do not expect) and I might even offer you some good cake or a beer, as soon as I manage to get some free time.
Thanks.
Science demands nothing less than the fervent and unconditional dedication of our entire lives. 3 | Software Development Process Enhancement: a Framework for Measurement-Based Decision-Making
Table of Contents Abstract…………………………………………………………………………………………………………………………………..7 Structure of the thesis……………………………………………………………………………………………………………..8
SECTION I: BEHIND THE CURTAIN CHAPTER I. CHAPTER II. CHAPTER III. CHAPTER IV.
DECISION MAKERS IN THE FIELD OF SOFTWARE ENGINEERING: THE GPS METAPHOR ............... 10 THE ROLE OF EMPIRICAL SOFTWARE ENGINEERING ................................................................ 11 CONTRIBUTION OF THIS WORK: THE IMPACT VECTOR MODEL................................................. 13 CONCEPTUAL ARCHITECTURE OF THE MODEL ......................................................................... 14
SECTION II: IMPACT VECTOR MODEL CHAPTER V. SHAPING THE MODEL ............................................................................................................ 18 V.I. ASSUMPTIONS............................................................................................................................................18 V.II. CHARACTERISTICS OF THE MODEL ..................................................................................................................19 V.III. TAXONOMY ...............................................................................................................................................19 CHAPTER VI. MATHEMATICAL FOUNDATION .............................................................................................. 20 VI.I. FORMULATION ...........................................................................................................................................20 VI.II. USING THE MODEL ......................................................................................................................................22 CHAPTER VII. ADDRESSING THE OPEN PROBLEMS OF THE IMPACT VECTOR MODEL ...................................... 25 VII.I. ACCOUNTING FOR PARALLEL PROCESS ACTIVITIES .............................................................................................26 VII.II. IMPACT VECTOR CONSTRAINTS ......................................................................................................................27 VII.III. EMPIRICAL DEFINITION OF THE ACTIVITY PERFORMANCE FUNCTION AND COMBINATION FUNCTION ............................28
SECTION III: IMPACT VECTOR MODEL: LEVERAGING THE EXCELLENCE CHAPTER VIII. WHERE DO IMPACT VECTORS COME FROM? .......................................................................... 32 CHAPTER IX. ENABLING VALUE-BASED DECISIONS VIA THE IMPACT VECTOR MODEL ................................... 32 CHAPTER X. QIP AND GQM: CONTINUOUS PROCESS IMPROVEMENT VIA IMPACT VECTORS ........................ 36 X.I. QIP: QUALITY IMPROVEMENT PARADIGM .......................................................................................................36 X.II. GQM+S: GOAL, QUESTION, METRIC + STRATEGIES..........................................................................................37 X.III. MODELING CHOICES AND ALTERNATIVES WITH IMPACT VECTORS.........................................................................39 CHAPTER XI. IMPACT VECTOR MODEL: POINTS OF CONTACT WITH CMMI, ISO/IEC 15504 AND SIX SIGMA .... 41
SECTION IV: IMPACT VECTOR FRAMEWORK CHAPTER XII. IMPACT VECTOR SCHEMA: ORGANIZE AND STORE IMPACT VECTORS ...................................... 48 XII.I. IMPACT VECTOR SCHEMA: MAIN REQUIREMENTS .............................................................................................49 XII.II. IMPACT VECTOR SCHEMA: ARCHITECTURE AND TECHNOLOGY .............................................................................50
4 | Software Development Process Enhancement: a Framework for Measurement-Based Decision-Making
CHAPTER XIII. USING IBM COGNOS INSIGHT™ TO VISUALIZE, EXPLORE, AND ANALYZE IMPACT VECTORS ....... 52 CHAPTER XIV. IBM METHOD COMPOSER™ & IBM TEAM CONCERT™: INFUSE, ESTIMATE, MANAGE, MEASURE, AND IMPROVE WITH IMPACT VECTORS .......................................................................................................... 54
SECTION V: IMPACT VECTOR MODEL: EXPERIMENTATION CHAPTER XV. IMPACT-ONE: VIRTUOUS COMPANY LEVERAGING THE IMPACT VECTOR FRAMEWORK ............ 58 XV.I. FIRST STEPS FOR APPLYING THE IMPACT VECTOR MODEL: CONTEXT .....................................................................58 XV.II. FIRST STEPS: ACTIVITY IDENTIFICATION, DEFINITION, AND CHARACTERIZATION .......................................................61 CHAPTER XVI. TAILORING THE IBM RATIONAL HARMONY FOR EMBEDDED SOFTWARE .................................. 63 XVI.I. PROCESS DESCRIPTION.................................................................................................................................63 XVI.i.1. Process Description: an Example .......................................................................................................67 XVI.II. ROLES IN OUR TAILORED HARMONY PROCESS ..................................................................................................68 XVI.ii.1. Mapping Between Roles and Activities .............................................................................................70 XVI.III. DESCRIPTION OF PROCESS ACTIVITIES .............................................................................................................70 XVI.iii.1. Analyze Stakeholder Requests ...........................................................................................................70 XVI.iii.2. Define System Validation Plan...........................................................................................................72 XVI.iii.3. Specify Requirements and Traceability to Stakeholder Requests ......................................................73 XVI.iii.4. Reviews and Risk Analysis .................................................................................................................74 XVI.iii.5. Review of Requirements ....................................................................................................................75 XVI.iii.6. Review of Black Box Use Case Design, System Test Plan, and Verification Reports ..........................75 XVI.iii.7. Review of Architecture, White Box Use Case Design, System Integration Test Plan, and Reports ....76 XVI.iii.8. Review Traceability Matrices.............................................................................................................77 XVI.iii.9. Analysis of Risks .................................................................................................................................78 XVI.iii.10. Identify and Trace Use-cases to Requirements .............................................................................78 XVI.iii.11. Black Box Use Case Design ............................................................................................................80 XVI.iii.12. Define and Trace System, System Integration, and Unit Test Plans ..............................................84 XVI.iii.13. Verify Black-Box and White Box Use Case Design through Execution...........................................85 XVI.iii.14. Define System Architecture ...........................................................................................................87 XVI.iii.15. White Box Use Case Design ...........................................................................................................90 XVI.iii.16. Develop or Generate Units and Trace to White Box Use Case Design ..........................................92 XVI.iii.17. Perform Unit Test, System Integration Test, and System Test ......................................................93 XVI.iii.18. Perform System Validation............................................................................................................93 XVI.iii.19. Further Activities ...........................................................................................................................94 XVI.IV. ARTIFACTS AND TOOLS.................................................................................................................................94 XVI.iv.1. Checklists: a Support Tool for Reviews ..............................................................................................96 XVI.iv.2. Contribution of Agile Models to the Proposed Development Process ...............................................99 XVI.V. REQUIREMENTS ENGINEERING DISCIPLINE PROPOSAL ........................................................................................99 XVI.VI. ANALYSIS AND PACKAGING OF RESULTS.........................................................................................................102 CHAPTER XVII. TESTING ACTIVITIES: A COMPLETE EXAMPLE OF ACTIVITY CHARACTERIZATION...................... 107 CHAPTER XVIII. SEQUENCING VERIFICATION TECHNIQUES: AN EXPERIMENT ................................................. 115 XVIII.i.1. Introduction.................................................................................................................................115 XVIII.i.2. Related Work ..............................................................................................................................117
5 | Software Development Process Enhancement: a Framework for Measurement-Based Decision-Making
XVIII.i.3. Experiment Description and Design ............................................................................................118 XVIII.i.4. Result Analysis.............................................................................................................................123 XVIII.i.5. Results Interpretation .................................................................................................................126 XVIII.i.6. Conclusion ...................................................................................................................................127 CHAPTER XIX. TEST PERFORMANCE EVALUATION ....................................................................................... 128 XIX.I. ANALYSIS OF RESULTS ................................................................................................................................129 CHAPTER XX. SELECTING TECHNOLOGIES FOR INCREASING PRODUCTIVITY: AN EXAMPLE WITH MOBILE TECHNOLOGIES 136 XX.I. INTRODUCTION.........................................................................................................................................136 XX.II. PURPOSES OF THE STUDY AND RESEARCH METHODS .......................................................................................137 XX.III. CHARACTERIZING THE TECHNOLOGIES TO STUDY .............................................................................................138 XX.iii.1. HTML5 + CSS3 + JavaScript (DT1) ....................................................................................................140 XX.iii.2. Platform Specific Software Development Kit (DT2,3) ......................................................................140 XX.iii.3. Appcelerator® Titanium Mobile (1.8.1) (DT4)..................................................................................140 XX.iii.4. Adobe® Flex Mobile (4.5) + Adobe Air (DT5)....................................................................................140 XX.iii.5. PhoneGap (1.7.0) (DT6, 7, 8) ...........................................................................................................140 XX.IV. DRIVERS FOR TECHNOLOGY SELECTION .........................................................................................................141 XX.V. A MODEL FOR EVALUATING MOBILE TECHNOLOGY .........................................................................................142 XX.v.1. Implementation and Graphical View of the Model .........................................................................143 XX.VI. THE PROCESS OF TECHNOLOGY DECISION MAKING FOR MOBILE ........................................................................146 XX.VII. CASE STUDY .............................................................................................................................................147 XX.VIII. VALIDITY ISSUES, SOLUTION LIMITATIONS, AND LESSON LEARNED ......................................................................149 CHAPTER XXI. EXPLOITING SOFTWARE INSPECTION DATA FOR EARLY DEFECT REMOVAL ............................. 150 XXI.I. INSPECTIONS AT IMPACT-ONE: STATE OF THE PRACTICE ...................................................................................152 XXI.II. DECISION MODEL: STATISTICAL ANALYSIS ......................................................................................................156 XXI.ii.1. Metrics .............................................................................................................................................156 XXI.ii.2. Statistical Tests ................................................................................................................................156 XXI.III. DECISION MODEL: INTERPRETATION OF RESULTS ............................................................................................158 XXI.IV. THREATS .................................................................................................................................................160 CHAPTER XXII. OVERALL EXPERIMENTATION THREATS ................................................................................ 161
SECTION VI: FINAL THOUGHTS AND FUTURE WORK CHAPTER XXIII. FINAL THOUGHTS ................................................................................................................ 164 CHAPTER XXIV. FUTURE WORK .................................................................................................................... 164 XXIV.i.1. Consolidating the Impact Vector Framework..............................................................................164 XXIV.i.2. Impact Vector Model and Empirical Software Engineering 2.0 ..................................................165 XXIV.i.3. Business Analytics and the Impact Vector Framework ...............................................................165 XXIV.i.4. Further Contexts of Application of the Impact Vector Framework .............................................166
6 | Software Development Process Enhancement: a Framework for Measurement-Based Decision-Making
Abstract BACKGROUND. Software development is a mixture of technical, human and contextual factors, which make it complex and hard to manage. As in physics, medicine and social sciences, experimentation is the fundamental way for Software Engineering to understand, predict and cost-effectively control the software development process. In this thesis we deal with the improvement of the software development process, which may depend on a remarkable number of variables, even dozens; however, the currently available improvement models consider only small numbers of variables. CONTEXT. The present work is a PhD thesis conceived and realized between 2009 and 2013 and developed partly in Italy and partly in the United States, with the contributions of the University of Rome Tor Vergata, the Fraunhofer Center for Experimental Software Engineering - Maryland, the National Aeronautics and Space Administration (NASA) and MBDA Italia. GOAL. The purpose of this study is to understand, predict and control the software development process with focus on performance - modeled as a set of variables of the necessary cardinality, from the point of view of decision makers, in the context of companies and agencies willing to achieve their business goals via a rigorous, predictable and engineered approach to software development. In other words, we aim to provide decision makers with a coherent and encompassing set of models and tools to support their Software Engineering job. METHOD. In order to achieve this goal, we first need to define a theoretical foundation for our approach; then we need to validate such theoretical model, so to refine and complete its formulation. Subsequently, we need to enable decision makers to use and leverage the validated model in practice. RESULTS. The main result of this thesis is a framework, tailored to both researchers’ and practitioners’ needs, to support the experimental investigation, and consequent improvement, of the software development process of organizations by detecting, modeling, and aggregating as many variables as necessary (up to ninety-four in our experience), and eventually use them to build measurement models. In this work, we report on the theoretical foundation of our framework and evidence of its successful preliminary validation on the field, with different organizations, including three major international companies, each having diverse goals and constraints in place. Specifically, the outputs of this study consist in a set of tailorable and usable methods to help experts make decisions concerning software development, along with a significant series of experiences to show its functionality and with some recommendations on how to turn the framework into practice.
7 | Software Development Process Enhancement: a Framework for Measurement-Based Decision-Making
Structure of the Thesis In order to detail the roadmap to achieve the stated goal, this work has been structured as follow: 1. Section I tells the Global Positioning System (GPS) metaphor, i.e., a soft introduction to the standpoint the reader is expected to assume while approaching this work. 2. Section II provides the mathematical formulation of the Impact Vector Model, i.e. the model that we propose to enable meeting the stated goal. This mathematical formulation also includes definitions and assumptions which contextualize and scope the model. Eventually, some open problems of the model are pointed out and addressed. 3. Section III consolidates the model foundation by linking the Impact Vector Model to some pre-existing works which represent bright achievements in the history of Software Engineering. Such foundation includes: the concepts of the Value-Based Software Engineering; the Goal, Question, Metric plus Strategy paradigm; the Quality Improvement Paradigm; CMMI: ISO standards. Furthermore, a quick, but broad analysis of software (and system) development process models is provided. 4. Section IV packages the Impact Vector Model into a framework by providing a tool chain for supporting the model infusion in practice. 5. Section V focuses on the validation of the Impact Vector Model. We propose the application of impact vectors to a hypothetical “synthetic” company, which abstracts on and consolidates experiences that we gained by working with some real organizations worldwide across several years. In fact, data from trenches are precious and subject to restriction; so, we merge fiction and reality in such a synthetic company: while telling true stories of application of the Impact Vector Model, we subvert the outcomes of our studies. This way, we can illustrate quite real examples of application of our model, along with related limits and validity threats, while assuring the confidentiality of results and preserving sensitive data from being published. 6. Section VI reports some final thoughts and anticipates some future developments. Appendices and References conclude the dissertation.
Since the structure of the thesis is top-down (first the context, second the theoretical model, and last model validation), a recommendation for the reader is not to linger on the formalisms of Section II, because a shallow understanding is enough to be able to easily follow and enjoy the next Sections. Eventually, a second reading of the theory will be faster and easier.
8 | Software Development Process Enhancement: a Framework for Measurement-Based Decision-Making
Section I: Behind the Curtain
«As our circle of knowledge expands, so does the circumference of darkness surrounding it». Albert Einstein
9 | Software Development Process Enhancement: a Framework for Measurement-Based Decision-Making
Chapter I. Decision Makers in the Field of Software Engineering: the GPS Metaphor In our daily lives, we use many tools and devices which support us in making choices. When such instruments are not available, we have to rely on our sensibility and intuition to undertake our decisions. An example of such instruments is a GPS (Global Positioning System) device with navigation software: given our current position and our destination, it can figure out the way to get there. An interesting aspect of GPS devices is that, at the very beginning of the trip, they provide the driver with an estimation of distance and drive time. The distance is often very precise, as its calculation is based pretty much on certain data: satellite triangulation has a high resolution and, if the road model is accurate enough, then the computation of the distance is accurate as well. However, the time estimation is harder to provide. In fact, many variation factors can affect it, including: traffic, traffic lights, car characteristics, road conditions, driving style, stops, and unexpected events. Therefore, as long as you proceed in your trip, the time estimation may need to be adjusted. Let us go a bit more in detail and give you a couple of examples. For a trip of 30 miles on the US-95 N/Veterans Memorial Highway, East of the Death Valley Park and 140 miles north of Las Vegas – basically, in the middle of nowhere –, the time estimation can be very accurate: factors like traffic, traffic lights and stops can be easily and reasonability ignored; therefore, assuming an average speed and that everything will be alright, the GPS makes life easy to a father answering his kid’s question: “are we there yet?”. The estimation of the GPS is very likely to be satisfying and appropriate: “30 minutes”. I challenge you to use the same GPS, which worked perfectly in Nevada, for a trip of 10 miles on the crowded Great Ring Road around Rome – or any of your “favorite” roads you drive on every day to go to work – at around 8:30 PM. We do not want to put salt in your (and our) wound, but just point out that the estimation of the GPS can be highly ineffective in some conditions, if it accounts only for distance and average speed. In this situation, GPS devices should account for additional aspects, in particular real-time traffic condition, accidents and road work; and some GPS devices do, so that drivers can keep monitoring the trend of their trips and, maybe, they can notify their boss that they will be late for the planned meeting. So, the GPS may not fix the problem, but it can still be very useful to understand what is going on and, possibly, to take some precautions and countermeasures. Also, some GPS devices are adaptive and change the road accordingly to some conditions, so they can get even smarter and try to mitigate the problem, but we do not want to discuss this example any deeper. 10 | S o f t w a r e D e v e l o p m e n t P r o c e s s E n h a n c e m e n t : a F r a m e w o r k f o r Measurement-Based Decision-Making
Once that the GPS story has been told, let us jump on our beloved field of Software Engineering. During our experience, we realized that many large scale projects are much closer to the “Rome” example than to the “Death Valley” example. Uncountable factors must be considered by the decision makers, innumerable things can go wrong and accounting all possible attributes influencing the development is a utopia. However, if we are willing to accept to live with some degree of uncertainty, then we could be happy with having something like a GPS, providing some form of support to our development and some clue on what is happening with the project. Maybe, this sort of GPS for software development could be even capable to provide us with some advice on “road adjustments”. Project management questions should be addressed by such hypothetical device, e.g.: “what testing technique is the most appropriate now, given my project status and goals?” or “can we do this task within the planned budget?” or “how can we assure that the Mars Rover will land the planet and will accomplish its mission with great success for the entire mankind?”. The answer to any of those questions can be very hard to provide and we do not want just a trivial “yes” or “very soon”, even though it could make everyone happy (for a while, at least). How can we answer, then? «Progress in any discipline depends on our ability to understand the basic units necessary to solve a problem. It involves the building of models […].We need to be able to model various product characteristics […], as well as model various project characteristics». Victor Robert Basili
Chapter II.
The Role of Empirical Software Engineering
Empirical is an adjective denoting something derived or guided by experience, case studies or experiments. An empirical method, then, is an approach based on the collection of data to base a theory or derive scientifically valid conclusions. Also the notorious scientific method, by Galileo Galilei, founds on empirical methods and it is a stronghold in every field of science. In the domain of Software Engineering (SE), the Empirical Software Engineering research field has emphasized the use of empirical methods (e.g. experiments, case studies, surveys and statistical analysis) to accumulate knowledge, in order to advance the state-of-art and the state-of-practice of SE. 11 | S o f t w a r e D e v e l o p m e n t P r o c e s s E n h a n c e m e n t : a F r a m e w o r k f o r Measurement-Based Decision-Making
In 1996, in the Editorial of the first volume of the “Empirical Software Engineering” journal, Victor R. Basili proposed a vision that, after 15 years of inspiration for great research in SE, also inspired the Impact Vector Model that will be presented in this work. Instead of proposing a synthesis of Basili’s vision, some excerpts are reported, which will settle the most appropriate standpoint for approaching next chapters. “[…] physics, medicine, manufacturing. What do these fields have in common? They evolved as disciplines when they began learning by applying the cycle of observation, theory formulation, and experimentation. In most cases, they began with observation and the recording of what was observed in theories or specific models. They then evolved to manipulating the variables and studying the effects of change in the variables. How does the paradigm differ for these fields? The differences lie in the objects they study, the properties of those objects, the properties of the systems that contain them and the relationship of the objects to the systems. So differences exist in how the theories are formulated, how models are built, and how studies are performed; often affecting the details of the research methods. Software engineering has things in common with each of these other disciplines and several differences. […] like other disciplines, software engineering requires the cycle of model building, experimentation, and learning; the belief that software engineering requires empirical study as one of its components.” About 15 years later, the goal of predictable Software Engineering has clearly not been achieved yet and this work is a contribution towards that objective. For skeptics and detractors of the feasibility of this goal, the following, additional thought, coming from the same source, might be illuminating. “It is hard to build models and verify them via experiments - as with medicine. As with the other disciplines, there are a large number of variables that cause differences and their effects need to be studied and understood. “ Therefore, if we can attempt summarizing, SE is hard and complicated, but not more than many other sciences. And if we want to keep naming it “Engineering”, then we need to go ahead and build our models and theories, supported by experimentation, so to make software development more and more manageable.
12 | S o f t w a r e D e v e l o p m e n t P r o c e s s E n h a n c e m e n t : a F r a m e w o r k f o r Measurement-Based Decision-Making
Chapter III. Contribution of This Work: the Impact Vector Model In very mature fields, scientists and engineers build models, according to some theories, in order to support the resolution of problems of the real world. Solving problems implies making choices, among some existing alternatives, on the way the problem should be solved. The choices that a decision maker picks are unarguably crucial, as they can determine the failure of the project; maybe choices cannot always determine the success of the project, which can depend also on external and uncontrollable factors, but we can be fairly sure that bad choices are likely to lead to bad failures. The model we want to build should help make such choices, according to the set business goals and constraints. We name this model the “Impact Vector Model”. Several attempts of supporting decision makers, at different levels, exist in the history of Software Engineer, e.g.: CoCoMo for estimating software cost and supporting resource allocation; GQM approach for measuring software development and support team managers understand where to improve it; architectural, design and implementation patterns to establish a set of reusable solutions to help developers build good software. These achievements share the idea of making the world of software development more understandable, manageable, engineered and predictable, while keeping the flexibility and tailorability that software development requires. The step further we propose in this work consists in formalizing the concept of choice in our thinking, be it a technological choice (e.g. a cutting-edge technology rather than a well-proven technology), a process choice (e.g. performing a code inspection rather than using pair programming) or a project choice (e.g. acquiring a COTS and a consultant rather than developing in-house). We do not expect to finalize the construction of a general model, to apply in all possible contexts and for all possible choices. We rather expect to propose a way of organizing, representing, accessing and leveraging knowledge gathered experimentally in the course of decades via research and on-the-field experiences. This way, our model could be instantiated in each single context, where it will be leveraging context-specific data and will propose solutions tailored down to the context itself.
13 | S o f t w a r e D e v e l o p m e n t P r o c e s s E n h a n c e m e n t : a F r a m e w o r k f o r Measurement-Based Decision-Making
Also, our model is thought to be suitable for extension and refinement via long-term, multifaceted and collaborative work, where experienced professionals and far-looking scientists can join their efforts to leverage, augment and improve it, without breaking what has already been put in place, possibly exploiting and sharing the same data and repositories.
Chapter IV.
Conceptual Architecture of the Model
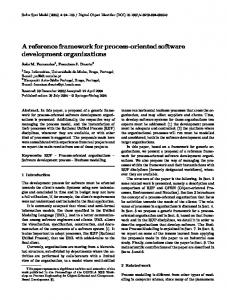
So far, we have presented many good intentions, but nothing really practical has existed, yet. Section II will fix this issue, but first readers may like to have a high-level understanding of how this model is expected to work. Therefore, a conceptual view of the model is provided in this chapter, identifying inputs, outputs, actors and the general idea of the model functionality. Consider a typical industrial context, where the decision maker is the one responsible for a new project that the company has to lead off. Management sets goals and constraints for the project and, based on some contextual factors, the decision maker has to make choices. Such choices, according to constraints and goals, are made based on the decision maker’s experience and knowledge and are transformed into tasks for the development teams. The model we propose can be leveraged during the decision process to support the decision step, i.e. help the decision maker formulate tasks for the development team. Other than goals and constraints set by management, the model will probably take some additional information, e.g. project-specific or team-specific characteristics or needs, additional constraints on the team composition or task assignment, or technical information and data to be used by the model for qualitative or quantitative reference. The desirable output of the model should some reliable information the decision maker can immediately leverage in order to elaborate or refine choices and tasks for the development teams. The term “reliable” means that the output of the model should be based on some evidence, i.e. qualitative and quantitative information with some form of objectivity and confidence on the part of the decision maker and the top management. Some form of iteration is also introduced: choices may reveal some team behaviors or results which differ from the expectations and may require further actions; similarly, the model could suggest paths that require an interaction with top management (e.g. the acquisition of new skills or products), which may lead to the adjustment of budget or time constraints, as well as to the introduction of new constraints.
14 | S o f t w a r e D e v e l o p m e n t P r o c e s s E n h a n c e m e n t : a F r a m e w o r k f o r Measurement-Based Decision-Making
Figure 1 Conceptual view of the model and its context
Of course, the main question is: how can we build such a smart, evidence-based model? First of all, we want the model to be able to leverage mathematical and statistical analysis, as well as data mining techniques. This implies the existence of data, or, more precisely, a data-driven approach enabling such methods to operate, with the aim of producing some “reliable supportive information” for making evidence-based decisions. Readers willing to have a concrete example will need to wait until the end of the mathematical formalization of the model. Our next step, in fact, is the definition of a mathematical foundation, which will unveil part of the internal structure of our black box.
15 | S o f t w a r e D e v e l o p m e n t P r o c e s s E n h a n c e m e n t : a F r a m e w o r k f o r Measurement-Based Decision-Making
Page intentionally left blank.
16 | S o f t w a r e D e v e l o p m e n t P r o c e s s E n h a n c e m e n t : a F r a m e w o r k f o r Measurement-Based Decision-Making
Section II: Impact Vector Model «There are problems to whose solution I would attach an infinitely greater importance than to those of mathematics, for example touching ethics, or our relation to God, or concerning our destiny and our future; but their solution lies wholly beyond us and completely outside the province of science». Carl Friedrich Gauss
17 | S o f t w a r e D e v e l o p m e n t P r o c e s s E n h a n c e m e n t : a F r a m e w o r k f o r Measurement-Based Decision-Making
Chapter V. V.i.
Shaping the Model
Assumptions
The model that will be presented founds on some assumptions that need to be discussed and made explicit in order to agree and find soundness in the rest of the work. The first point is to clarify the term “model”, which we will use pretty much freely, sometimes as synonym of theory – i.e. a working hypothesis that is considered probable based on experimental evidence or factual or conceptual analysis and is accepted as a basis for experimentation – and sometimes to indicate the mathematical formulation that will be provided in the next Section. Eventually, model, theory and mathematical formulation will correspond to the same idea (from a Platonic point of view), which is the same represented in Figure 1. We name this the “Impact Vector Model” (IVM). Reasons for such name will be clear later on. The second point to focus is that the IVM requires the awareness of its users, i.e. the decision makers. This means that the model cannot replace the human judgment, but can only assist it and support it during the decision making process. This is required to compensate all the missing aspects of the reality, i.e. those aspects which are not accounted for by IVM, including global economic trends, future opportunities, personal opinion, political influences, hard-tomodel dynamics, and, very frequently, gaps in available data. Since we do not aim to model “the whole”, nor we do expect this being feasible, the underlying assumptions are: (A1) We accept to deal with an incomplete-knowledge model. (A2) We assume the presence of a user capable to interact with the model and interpret its output accounting for contextual factors that are not modeled explicitly. The first assumption is pretty much true for every model of the real world, including physical and mechanical laws. The counterpart of this assumption is that the model is required to be “complete enough” to provide usable and useful information. The achievement of “enough completeness” will be shown in the rest of the work. The second assumption is hopefully true in many safety- and mission-critical environments, including the Space and Defense Fields, where decision makers are expert, prepared and skilled enough to address both technical and managerial problems. In particular, we expect the decision makers to have a broad view on both the system under development and its context; this means that the user should also be able to figure out when the model cannot be applied, e.g. because of the high incompleteness of data or the singularity of the specific issue to solve. 18 | S o f t w a r e D e v e l o p m e n t P r o c e s s E n h a n c e m e n t : a F r a m e w o r k f o r Measurement-Based Decision-Making
Based on this second assumption, we derive that the field of applicability of the model is limited to those contexts in which A2 holds.
V.ii. Characteristics of the Model Given these assumptions, we want the IVM to be used in the following scenario: Given: (i) (ii) (iii) (iv) (v) (vi)
Some product and process goals and constraints (e.g. a given quality or a maximum project time); The current status of both process and product; The history of the process executed so far; Potential solutions coming from standards, literature, practice and creativity; Data collected overtime (on the current and other projects); Information on the specific context;
the model should provide a set of possible process solutions that will lead to achieving the project goals while respecting the given constraints This scenario includes, as particular case, the situation in which the decision maker is at the beginning of the development and no history exists. An important characteristic we want the IVM to have is that it should be evidence-based: a particular instance of the IVM should be the result of a systematic empirical investigation of phenomena. This means that the model is built on the basis of qualitative and quantitative data. Furthermore, its output should be measurable as well, i.e. supported by measures associated to a well-defined interpretation. One more characteristic is the real-time capability: we want the model to constantly provide the decision maker with fresh and reliable information, which can be used to monitor the progress and to make decision on how to correct the plan or improve it. Finally, very desirable characteristics of the model also include: • Flexibility: we want the decision maker to be able to define his/her own goals on any characteristic of the product, the process or the context. • Usability: we want the model to provide actionable and quickly understandable information.
V.iii. Taxonomy We start formalizing the model by providing details on some terms we will use. Most of them are widely spread in the field of SE, but conclusive definitions are always hard to provide and 19 | S o f t w a r e D e v e l o p m e n t P r o c e s s E n h a n c e m e n t : a F r a m e w o r k f o r Measurement-Based Decision-Making
agree upon. We do not want to speculate on what definition is most appropriate for any given term, so we will not provide any formal definitions at all, but just a few words to transfer an intuition of our interpretation of the terms. • Development process: a multi-set of process activities executed according to a given schedule. • Development process activity: a task that requires resources to be executed and that causes a development process to evolve because of its execution. • Product: an artifact or set of artifacts, either tangible or not, which is output of some development process activities. • Product attribute: a measurable characteristic of a product. • Process attribute: a measurable characteristic of a process. • Project attribute: a measurable characteristic of a project. • Context attribute: a measurable characteristic of the environment where a process is enacted to realize a product. • Scale (scale of measure): a model which enables a variable to be measured and assigned a value in some set of admissible values.
«Do not worry about your difficulties in Mathematics. I can assure you mine are still greater». Albert Einstein
Chapter VI.
Mathematical Foundation
VI.i. Formulation We now define our model by providing some formal definitions and properties. 1. Be X ⊆ = {x|x is a product attribute, process attribute, project attribute or context attribute}. X is the subset of containing only the attributes we are interested in considering. Every element in Xk, for any given k≥0 is named Impact Vector (IV). 2. Be A ⊆ X = {a|a is a development process activity}, where n=|X| and X denotes the nfold Cartesian product over X. Furthermore, an activity is defined as a vector of product attributes, process attributes, project attributes, and context attributes with no repetitions, i.e.: 20 | S o f t w a r e D e v e l o p m e n t P r o c e s s E n h a n c e m e n t : a F r a m e w o r k f o r Measurement-Based Decision-Making
∀ ∈
.
=
= 〈 〉
≠ →
≠
F. 1
We name such vector Activity Performance Impact Vector (APIV). 3. Be A ⊆ X the set of all software development activities; then, a development process is a sequence of zero or more activities, i.e., be D the set of all development processes, then: ⊆ (X )∗
F. 2
We name Process Performance Impact Vector (PPIV) an element in (X )∗ . 4. Be V = {v|v is a scale}. 5. Be the admission function : → ", i.e. the function that maps each attribute to the set of its admissible values (i.e. to its scale). o It holds that each attribute has one and only one scale, i.e.: ∀ ∈ ∃! % ∈ " . % =
&( )
6. Be Dist = {dist|dist is a probability distribution function or a mass function on v ∈ " } the set of all probability distribution/mass functions on any scale. 7. The Activity Performance Function (APF) '()*: A ∗ D → (X ∗ Dist) represents the vector of n probability density/mass functions, reminding that n=|X|. Informally, we are saying that, given an activity a in a process d, the performance of the activity is a vector of n probability distribution/mass functions, each representing the performance in terms of an attribute. 8. The Combination Function (CF) /0 1: ( ∗ 23) ∗ ( ∗ 23) → (X ∗ Dist) maps a pair of APIVs of a process - each associated to its performance - to a single Impact Vector, having its attribute associated to their performance (i.e. random variables). Informally, we are reducing the performance of two activities in a process to the performance of one equivalent activity. 9. The Process Performance Function (PPF) ''*′: → ( ∗ 23) for a process d of k activities is defined recursively as follow: 556′( ) = 7
89&:;556′;d => ? , 5AB6( , )? 6 0 < ≤ F 〈 GHH〉 6 = 0
F. 3
F. 4
where the notation indicates the sub-development process composed of the first j activities (0 ≤ ≤ F) of the process d and 〈 GHH〉 denotes the Null Impact Vector (NIV), whose properties we will define later. Something to highlight is that, based on this definition, the performance of each activity (and, in particular, the performance of each activity in terms of each attribute) depends on the entire 21 | S o f t w a r e D e v e l o p m e n t P r o c e s s E n h a n c e m e n t : a F r a m e w o r k f o r Measurement-Based Decision-Making
process; in fact, the second parameter of comb is 5AB6( , ), which computes the
performance function for the activity a as j-th activity of the process d. We now want to make an assumption to simplify the model: (A3) The performance of an activity does not depend on the future of the development process. Therefore, the definition of the PPF ppf for a process d composed of k activities becomes: 556( ) = 7
89&:;556;d => ? , 5AB6( , => )? 6 0 < ≤ F 〈 GHH〉 6 = 0
F. 5
In this final formulation of PPF, the performance of the j-th activity depends on the process up to the (j-1)-th activity, not on the ones which will be executed after the j-th activity. It is important to remark that the choice of an activity can obviously depend on the future of the process; nevertheless, the independence from the future, that we are assuming, is limited to the performance of that activity, not to the absence of correlations or synergies among activities during process planning. However, the assumption A3 might still be violated, e.g. because some psychological dynamics can improve or worsen the performance of some developers who are aware of next planned activities. Some studies report quantitative analyses on these dynamics – e.g. “An Empirical Study on Software Engineers Motivational Factors”, by França and da Silva –, but, in order to keep the complexity of this model at a manageable level, we will keep assumption A3 until the end of this work and demand the problem of managing the social and motivational factors to the decision maker’s consideration (see assumption A2). One more important point to notice is that the model does not forbid that the performance of an activity in terms of an attribute may depend on the performance of other attributes. In fact, this reflects something realistic: just to give an example, we can imagine that there should be attributes like “complexity of the product” and that the expected cost of testing depends on (i.e. is a function of) such complexity. Notice also that, at the moment, the APF (Activity Performance Function) perf and the CF (Combination Function) comb are still undefined and we postpone their discussion to the next chapter.
VI.ii. Using the model We now provide an example of use of the model. Given the trivial development process d1= , we want to compute its performance in terms of cost, recall (i.e. percentage of removed defects) and amount of produced material (apm). According to the previous paragraph, we can write: 22 | S o f t w a r e D e v e l o p m e n t P r o c e s s E n h a n c e m e n t : a F r a m e w o r k f o r Measurement-Based Decision-Making
• • •
X = {cost, recall, apm} D = {d1} A = {requirements, implementation, test}
Moreover, we arbitrarily define the following scales: • V = {Vcost, Vrecall, Vapm } o Vcost = {c|c is a non-negative real number}. The real number is assumed to represent the cost in $. o Vrecall = {not applicable, low, high}. The value “not applicable” means that an activity having this value in the recall dimension does not affect the recall anyhow. The value low indicates that less than 33% of existing defects are detected by the activity, while high means that at least 33% of the existing defects are identified by the activity. o Vapm = {very small, small, medium, high, very high}. The values of the ordinal scale indicates if the amount of pages is very small (0-2 pages), small (3-5), medium (6-10), high (11-25), or very high (>25). We can think of some conversion factors, e.g. for code, transforming lines of code to pages. However, in this example, we are not really interested in this level of detail and we prefer to leave the intuition to the reader. Additionally, the admission function is completely defined as follow: • adm={, , } We can also arbitrarily assume that the performance function is defined as follow: • perf(requirements,)=Prequirements, •
perf(implementation, )=Pimplementation,
•
perf(test, )= Ptest,
where P*, are vectors of 3 random variables – one each for cost, recall and apm – associated to the probability distribution/mass functions constituting the co-domain of the function perf (i.e. the APF). Let us assume we somehow know that such random variables have the following distribution and mass functions: • Prequirements, = < >
23 | S o f t w a r e D e v e l o p m e n t P r o c e s s E n h a n c e m e n t : a F r a m e w o r k f o r Measurement-Based Decision-Making
•
> > Pimplementation, = < >
•
< api, < , , , , > > > Ptest, = < >
< apm, < , , , , > > > Now we need to compute ppf(d1) and the steps are provided below. In order to support the reader, the two arguments of the functions comb and perf are formatted and numbered hierarchically, according to their depth in the function call stack. Also, we highlight with colors some invocations; the same color marks the same invocation of the comb and perf functions at different steps of the computation. ppf (d1) = = ppf () = = comb ( 1. ppf (), 2. perf ( 2.1. test, 2.2. )) = = comb ( 1. comb ( 1.1. ppf (), 1.2. perf ( 1.2.1 test, 1.2.2 )), 2. perf ( 2.1. implementation, 2.2. )) = = comb ( 1. comb ( 1.1. comb ( 24 | S o f t w a r e D e v e l o p m e n t P r o c e s s E n h a n c e m e n t : a F r a m e w o r k f o r Measurement-Based Decision-Making
1.1.1. ppf () 1.1.2. perf ( 1.1.2.1 test, 1.1.2.2 )) 1.2. perf ( 1.2.1 implementation, 1.2.2 ) 2. perf ( 2.1. requirements, 2.2. )) We do not need to expand the expression any longer, in fact: ppf() is known and is the Null Impact Vector (NIV) by definition of ppf; the perf function is known and explicitly defined for all required values of its arguments; and the combination function comb is expected to provide an element in X3, even though it has not been defined, yet. We can intuitively say that, for cost, the comb function is a simple sum: computing the cost of two activities is equal to add the cost of the first activity to the cost of the second activity (computed being aware of the application of the first activity). More specifically: I9B& H (5000,2) + I9B& H (1500,1) + I9B& H (1000,0.1) ∼ Normal(7500, 3.1)
For recall and apm, instead, we have a different scale type (ordinal) and we cannot have an immediate similar intuition (and the same would hold for nominal scales). Concerning the recall, however, it is still fairly easy; in fact, only one of the activities has a relevant value, i.e. test, because the “not applicable” value of the scale means that an activity does not affect the recall. Therefore we can say that the recall of the process is a random variable with a mass function of the form .
Chapter VII. Addressing the Open Problems of the Impact Vector Model In the defined models a number of issues can be identified. In the following, the most relevant ones are pointed out and a solution is sketched for each.
25 | S o f t w a r e D e v e l o p m e n t P r o c e s s E n h a n c e m e n t : a F r a m e w o r k f o r Measurement-Based Decision-Making
VII.i. Accounting for Parallel Process Activities As stated in the previous chapters, the current mathematical formulation of the Impact Vector Model does not support parallelism of process activities, i.e. multiple activities being executed at the same time. In order to model the parallelism of activities, we extend the definition of activity to include a new attribute. This attribute is a pair representing an interval of execution of the activity with respect to a nominal time (i.e. a reference time). When two activities a1 and a2 are executed at the same time, e.g. they start at the same time t1 and end at the same time t2, the activity attributes have both the pair . When the time overlap between the two activities is partial, then the nominal time reflects this partial overlap; e.g. if a2 starts when half a1 has been executed, then the attribute value for a1 is and the one for a2 is . Nominal time shall be measured in a ratio scale. Following this extension, the nominal duration of the process is tf-ti, where tf is the end time of the last activity of the process (i.e. the one ending last), while ti is the start time of the first activity of the process. A further extension can support modeling activities that are not continuous, but that can be suspended and resumed in the future; the extension consists in having a sequence of pairs instead of a single pair as attribute. Pairs of this sequence shall be totally ordered with respect to time; therefore there should be no overlap between intervals of execution (i.e. an activity cannot be ongoing and suspended at the same time). The introduction of such an extension (either the one supporting activity suspend-and-resume or the former one) has an impact on the complexity of the problem: in fact, without the extension, interactions and synergies between activities only depend on their order of execution, but not on their simultaneity. By introducing the concept of time, instead, simultaneity of activities may lead to much higher a complexity: multiple activities may interact and provoke changes in performance and causality can become hard to understand. E.g. a new question may arise: which activity (or activities) is causing a performance variation on which other activity (or activities)? An exponential grows of potential answers shall be expected with the increase of the number of simultaneous activities. Furthermore, also partial overlap of activities shall be accounted for. Because of this complexity, an exhaustive analysis of all possible and reasonable situations is not viable. However, extending the Impact Vector Model to support simultaneous activities is necessary, as time is of undeniable importance in every practical context. Nevertheless, despite the uncountable realistic scenarios one can encounter, it is expectable that in many contexts only some activities are executed simultaneously, as well as only some sequences of activities 26 | S o f t w a r e D e v e l o p m e n t P r o c e s s E n h a n c e m e n t : a F r a m e w o r k f o r Measurement-Based Decision-Making
are implemented, while most admissible combinations, though reasonable, are not of interest. This can cut down the complexity of the theoretical problem to a more practical and treatable task. This way, decision makers can perform targeted investigations, e.g. if they detect that a particular activity is sometimes executed parallel with another activity (e.g. they start and ends at the same time), while sometimes they are executed in isolation, they could investigate the existence of an overall performance variation by targeting those two specific process configurations (i.e. parallel or isolated activities); assuming this standpoint avoids an extensive and exhaustive empirical investigation trying to cover all possible configuration of process activities.
VII.ii. Impact Vector Constraints One more aspect we want to report is that, in some conditions, not all values of a scale are reasonable or feasible (e.g. a project manager wants to put a cap to costs, which makes some values of the corresponding scale not acceptable). How can the model account for such conditions? In order to satisfy this need, we formally introduce the concept of Attribute Constraint (AC), i.e. a function that, given a scale of values, maps it into a new scale of values that is a subset of the former scale. Even though the formalization effort for this extension is small, it turns into great benefits in practice. In fact, putting ACs may filter out a big set of alternative solutions that, for a given context, are not feasible, not viable or considered not convenient. The usefulness of ACs become evident when trying to build automation engines to elaborate impact vectors: by putting constraints, the search space can be drastically reduced, making the computation accomplishable in acceptable time. One more type of constraints relates to activity sequencing: some activities may be executed only after some other activities have been already executed, e.g. because they require artifacts produced by some previous activities. For similar situations, we formalize sequencing constraints by extending the Process Performance Function (PPF) as follow: 89&:;556;d => ? , 5AB6( , => )? 6 0 < ≤ F 556( ) = W〈 GHH〉 6 = 0 G A6 A 6 &G23 :A A A8G3A :A69BA 83 % 3X 96 =>
The undefined value means that the performance of the process dj cannot be computed. Such formulation further helps create engines for automatically elaborating impact vectors, because the search space can be reduced by excluding undefined sequences of activities.
27 | S o f t w a r e D e v e l o p m e n t P r o c e s s E n h a n c e m e n t : a F r a m e w o r k f o r Measurement-Based Decision-Making
VII.iii. Empirical Definition of the Activity Performance Function and Combination Function The next point we need to cope with concerns the perf and comb functions. That is probably the hardest aspect to define, but it leads to the most valuable result of using the Impact Vector Model, i.e. the process performance, both expected and historical, at the level of granularity chosen by the decision maker. For executing a performing development process, some good practices can often be identified and leveraged, as well as some bad practices can be detected and discouraged. However, on the side of these practices, in order to i) find local, tailored and specialized optima, ii) concretely and practically instantiate such practices in specific situations, and iii) interpret the obtained results, every context needs its own models. Therefore, other than globally valid information (e.g. best practices), there is some local information to account for. Such local information is specific to a given context, but it is not necessarily one-shot. In a totally different environment, this local knowledge might still be useful. Let us analyze when this could happen. When configuring the Impact Vector Model for a given context, one of the steps is the selection of performance attributes of interest. Among such attributes, big importance has to be assigned to characterization attributes, i.e. those attributes that represent distinctive aspects of the process and the product under development, e.g. the complexity of the project and the domain of application. Doing so corresponds to preparing statistical models and data mining agents for a correct analysis, because such attributes allow slicing and dicing of data in order to find meaningful trends. For example, suppose a company C1 is working on two product lines, one about mobile GUIs for existing websites and one about native mobile apps for home automation; an aggregate analysis can reveal some global and context-specific knowledge, but a by-product line analysis may reveal some different and product line-specific knowledge. Packaging such product linespecific knowledge can represent an added value to be leveraged by someone else, when the product line is appropriately characterized. Keeping on this example, in fact, we can imagine of a Defense company C2 that has to develop a wrapper for its intranet portal to offer functionality on mobile. Data collected by C2 are hardly usable to predict the performance on such task; but if C2 could access data of C1, limited to the product line on mobile interfaces, then C2 could gather something useful, e.g., C2 could get to know that the presence of one person highly skilled on the target platform may cut down cost by 40%, in the average, and up to 60% when the target platform is iOs. The aforementioned appropriate characterization of the context could help C2 find the needed information via data look up and exploration. 28 | S o f t w a r e D e v e l o p m e n t P r o c e s s E n h a n c e m e n t : a F r a m e w o r k f o r Measurement-Based Decision-Making
We postpone to the last Section of this document a discussion on the so called Empirical Software Engineering 2.0 [1], which matches our viewpoint on sharing data across companies and researchers. Jumping back to the point of this chapter, we can now imagine of having a repository with data as previously described, i.e. vectors of attributes representing the performance of an activity and including characterization attributes to use for data look up and exploration. Such a repository could be queried and automatically analyzed via statistics and data mining to predict what the performance of an activity (or an entire process) will be, based on the characterization of the current context to slice and dice the repository and use only the data representative and really usable for a prediction in that specific situations, in terms of both a single activity performance (Activity Performance Function), and multiple activities (Combination Function).
29 | S o f t w a r e D e v e l o p m e n t P r o c e s s E n h a n c e m e n t : a F r a m e w o r k f o r Measurement-Based Decision-Making
Page intentionally left blank.
30 | S o f t w a r e D e v e l o p m e n t P r o c e s s E n h a n c e m e n t : a F r a m e w o r k f o r Measurement-Based Decision-Making
Section III: III: Impact Vector Model: Leveraging the Excellence «Not to know what happened before you were born is to remain forever a child». Marcus Tullius Cicero
31 | S o f t w a r e D e v e l o p m e n t P r o c e s s E n h a n c e m e n t : a F r a m e w o r k f o r Measurement-Based Decision-Making
In Section III we perform a comparative analysis between the Impact Vector Model and some previous work in the field of Software Engineering, specifically for process and quality Management during software development.
Chapter VIII. Where do Impact Vectors Come from? The Impact Vector Model is the results of leveraging, reinterpreting, merging, slicing and dicing, adapting and augmenting a number of pre-existing models in software – and not only – literature. The biggest influence has been provided by the Quality Improvement Paradigm, by GQM+S, and by the Value-Based approaches applied to Software Engineering. For each of those, a chapter provides a summary description and a close examination on how they interact and relate to the Impact Vector Model. A minor, but still crucial contribution to our model has been given by further influent paradigms, namely CMMI, SPICE and Six Sigma. Additional methods and techniques should obviously be leveraged to implement the Impact Vector Model, e.g. the Weighted Objectives Model, Statistical Process Control, Root Cause Analysis, Regression Analysis, checklists and so on. In the next chapters, we will mostly focus on the aspects that the Impact Vector Model has in common with other approaches and methodologies, and sometimes we will mention techniques or methods that can be used to address specific technical issues. However, we do not aim to carry on a detailed comparative analysis between impact vectors and other approaches, but only to highlight what impact vectors are leveraging and reusing from the past.
Chapter IX. Enabling Value-Based Decisions via the Impact Vector Model The Value-Based Software Engineering (VBSE) is a discipline of Software Engineering that heavily accounts for business aspects related to software development. Among the pioneers of VBSE is Barry Boehm. One of the books he co-authored – “Value-Based Software Engineering” – contains, in its first chapter, a number of key-drivers for the definition and use of the Impact Vector Model. The re-elaboration and synthesis of Boehm’s words, reported below, highlights the most relevant aspects for our model. “Most studies of the critical success factors distinguishing successful from failed software projects find that the primary critical success factors lie in the value domain. In earlier times, when software decisions had relatively minor influences on a system’s cost, schedule, and value, a value neutral approach was reasonably workable: every requirement, use case, 32 | S o f t w a r e D e v e l o p m e n t P r o c e s s E n h a n c e m e n t : a F r a m e w o r k f o r Measurement-Based Decision-Making
object, test case and defect was treated as equally important and the responsibility of software engineers was confined to turning software requirements into verified code.” However, “software has a major impact on cost, schedule and value” of today’s systems. Furthermore, value-neutrality clashes with the definition of engineering itself, which recalls to the application of science and mathematics in order to produce results useful to people. The Value-Based Software Engineering (VBSE) aims at “integrating value considerations into the full range of existing and emerging software engineering principles and practices”. This enables making value-based decision, i.e. decisions driven by the awareness of what is most valuable doing in order to achieve the defined business goals. In particular, decision makers “need to have a clear understanding of the sources of value to be exploited and link between technical decisions and the capture of value”. “Value-based decisions are of the essence in product and process design, the structure and dynamic management of larger programs, the distribution of programs in a portfolio of strategic initiatives, and national software policy. Better decision making is the key enabler of greater value added”. These words remark the substantial need of including value considerations when trying to address decision making issues. In the cited book, the authors also shape a theory of value for SE, elaborating, adapting and leveraging ideas and theories of value defined in fields other than SE. That is only one of the works that have been done on VBSE and we can reasonably assert that a fairly strong and fervid background exists for VBSE. Though interesting, we will not focus on the details of VBSE, as it is not the core of this work. Rather, the goal of this paragraph is to focus how the Impact Vector Model enables value-based decision making. In order to focus this
A2 D2
c
Impact Vector Constraint
D1 D3
o2 Ideal path A1
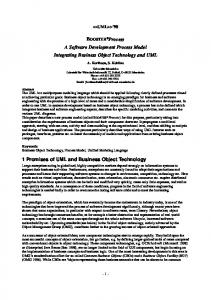
o1 Figure 2 Geometrical representation of the Impact Vector Model.
33 | S o f t w a r e D e v e l o p m e n t P r o c e s s E n h a n c e m e n t : a F r a m e w o r k f o r Measurement-Based Decision-Making
point, we want to propose a graphical representation of the Impact Vector Model. Because of the limits of our paper sheets and our ability to deal with 2 dimensions only, we will propose a trivial example in which we consider only two attributes (A1 and A2) and three processes (D1, D2 and D3). In Figure 2 many elements are represented. D1, D2 and D3 are represented as sequences of, respectively, 4, 1 and 5 activities, where each activity is indicated as a bold dot. All development processes start from the origin, i.e. the Null Impact Vector. Every activity is a move in the 2D space we are considering. The move corresponds to the impact that the activity has on the development process. Each point in the space (i.e. an Impact Vector), in fact, represents a performance in terms of A1 and A2. In particular, each point of type indicates that the performance is a1 in terms of A1 and a2 in terms of A2. The big green dot represents an optimum, i.e. the point that, ideally, the decision maker would like to achieve. For example, if we think of A1 and A2 as time and cost, the green dot represents the ideal tradeoff for a process in terms of cost effectiveness, i.e. a time o1 and a cost o2. Finally a portion of the space is marked with a curved line, which represents a limit to the admitted values for the attribute A2, i.e. an Impact Vector Constraint. Again, if A2 represents cost, then the value c for A2 is the maximum budget that can be used by a process we want to consider as acceptable. In this example, no development process is expected to get to the ideal performance (green dot). We have three options, but one of them is to be discarded. In fact, the process D2 ends up in the forbidden space, as it violates the constraints on A2. D1 and D3 are the remaining candidates: how can the decision maker choose? Here comes the idea of value-based decision making. Based on the graphical representation, the decision maker should start reasoning on the relative importance of A1 and A2. In fact, if we still think of A1 and A2 as time and cost, D3 seems to cost less than D1, but it is expected to take longer. Which alternative is the best? The answer definitely depends on the context. If a new project is expected to start shortly, the decision maker may want to be faster to complete the current project, even though it is more expensive, so to free resources for the new projects. In different conditions, however, the decision can be different; therefore the model cannot really provide the conclusive answer. What the model can do is to provide the decision maker with the entire amount of information available in order to him/her to make a value-based decision. We also want to remind that another desirable characteristic is the evidence-based foundation of the model: how can we introduce quantitative reasoning to support value-based decisions, then? A perfect fit could be the Weighted Objectives Method (WOM), a quantitative method described by Cross in his “Engineering design methods: strategies for product design”, and commonly used in the field of Systems Engineering to evaluate a set of candidate solutions to the same technical problem. It consists in computing a single score for each alternative and 34 | S o f t w a r e D e v e l o p m e n t P r o c e s s E n h a n c e m e n t : a F r a m e w o r k f o r Measurement-Based Decision-Making
picking the solution corresponding to the highest score. In our context, the alternatives are the development processes (e.g. D1 and D3), while the scores can be computed by following four steps: 1. Assign a weight to each dimension of the space (e.g. cost and time), so that the higher the weight, the more important the dimension; notice that the weights add up to 1. 2. Define a ratio scale, with minimum and maximum values, representing the extent to which a given alternative is appropriate with respect to the given dimension. 3. For each dimension, assign a value of the scale associated to the current alternative; notice that, regardless of the dimension, the method works in such a way that the higher the value, the better is the alternative (e.g., in terms of cost, the cheapest solution is expected to have the highest score). 4. For each alternative, sum the scores assigned to each dimension multiplied by its weight. Notice that, for dimensions originally associated to a ratio scale, step 2 can be skipped and step 3 is systematic, i.e. the score for those dimensions can be analytically computed based on the value presented by each alternative for those dimensions. For ordinal and nominal scales, instead, step 2 and 3 are the enablers to the use of the weighted objectives method and must be executed. WOM is just one of the possible methods; it is easy to apply and does not require a lot of effort. On the other side, there are some more accurate methods that have been proposed in the past [2, 3, 4, 5]. However, the selection of the most appropriate method, which may also be context-specific and vary according to the available resources and support tool, is not the focus of this chapter. The point that we want to make in this chapter is that with any of such methods, we can give rigor to the way the decision maker could leverage the information represented geometrically in Figure 2, in order to support his/her decision making in a value-based fashion.
35 | S o f t w a r e D e v e l o p m eFigure n t 3PAn r oexample c e s sof Eimpact n h avectors ncement: a Framework for Measurement-Based Decision-Making
We also want to remind the importance of flexibility, listed in 0 as one of the desirable characteristics of the framework. Being able to accommodate different needs (i.e. different goals) is a first step towards flexibility and, by using the WOM together with impact vectors, as different weight assignments to vector attributes can lead to different outcomes and consequently to different choices. Of course, using WOM is not mandatory and a decision maker can pick any preferred method to plug onto the impact vector to assign importance to the attributes.
Chapter X. QIP and GQM: Continuous Improvement via Impact Vectors X.i.
Process
QIP: Quality Improvement Paradigm
The Quality Improvement Paradigm (QIP) is a model designed to support continuous process improvement and engineering of the development processes, and to help in technology infusion. The QIP takes the premise that all project environments and products are different; in fact, software development is human-based and design-intensive, which makes the use of statistical control (e.g. used for manufacturing) extremely hard to apply. Therefore, the idea of statistical control of processes is brought into question and replaced, at least partially, with the need for constant experimentation. The QIP closed-loop approach is represented in Figure 4. The QIP cycle is composed of two closed loop cycles: organizational and project. The organization-level cycle provides feedback to the organization after the completion of a project, whilst the project-level cycle provides feedback to the project during the execution phase, with the goal of preventing and solving problems, monitoring and supporting the project, and aligning processes with goals. Additional details on each phase of
Figure 4. Quality Improvement Paradigm.
36 | S o f t w a r e D e v e l o p m e n t P r o c e s s E n h a n c e m e n t : a F r a m e w o r k f o r Measurement-Based Decision-Making
QIP will be provided later on, when describing the GQM, which can leverage, and is complementary to the QIP (and vice versa). During that description, we will also remark how the Impact Vector Model complies with and extends QIP (other than GQM).
X.ii. GQM+S: Goal, Question, Metric + Strategies The Goal, Question, Metric (GQM) is an approach to software measurement proposed by V. R. Basili and the Software Engineering Institute at the NASA Goddard Space Flight Center. The approach founds on three concepts: goals, questions and metrics. Goals can be defined according to the GQM template as follow: Schema
Examples
Sentence
Object
Process, product, resource…
Analyze
Purpose
Characterize, understand, evaluate, predict, improve
For the purpose of
Quality Focus
Cost, correctness, reliability…
With respect to
Viewpoint
Customer, manager, developer, corporation…
Form, the point of view of
Context
Problem factors, resource factors, process factors…
In the context of
Table 1. GQM template.
Starting from defined goals, questions shall be generated, so to make the goals quantifiable. Such questions should address those aspects relevant for the achievement of the goals, e.g., they could aim at identifying relevant process areas and at determining the influential characteristics of the product, and context factor that impact the performance of teams. Given the questions, measures shall be specified to collect data in order to answer the generated questions and track process/product progress with respect to the goals.
Figure 5 The Goal, Question, Metric
A concept underlying GQM is that measurement is not a goal per se, but it is functional to an end which has a value for the organization. Such value is expressed in the form of goals. The extension of GQM to GQM + Strategies (GQM+S) addresses specifically this issue by introducing 37 | S o f t w a r e D e v e l o p m e n t P r o c e s s E n h a n c e m e n t : a F r a m e w o r k f o r Measurement-Based Decision-Making
the concept of strategy, i.e. a possible approach for the achievement of a goal in the context under study. Consequently, a multi-level hierarchy of goals and questions should be created in order to sufficiently address, decompose and detail the top-level goals, so to accommodate organizational structure and tractability of the problem. In order to precisely illustrate how the Impact Vector Model can be plugged in to GQM+S (or vice versa, depending on the point of view), we will first be traveling through the process to implement the GQM+S approach in an organization; then, we will explain which steps of the process can be affected and augmented by the Impact Vector Model. The process can be summarized in 7 steps, which retrace the QIP (steps 2-7). 1. Initialize. The management should be made aware of and prepared to implementing the approach. This includes staffing, assigning Figure 6. GQM + Strategy. responsibilities, training, and planning schedule and cost. 2. Characterize. Processes, products, projects, technologies, customers and organization should be characterized, as well as pre-existing measurement programs (e.g. repositories, goals or models). 3. Set goals. Organizational units (e.g. business units) involved should be identified and interrelationships should be detected. Furthermore, the current status should be precisely described and goals should be set for each organizational unit, along with potential issues, strategies for achieving the goals and data to be used for assessing the goals. This step includes the definition of both metrics and interpretation models to evaluate success at achieving goal. 4. Choose process. Create or reuse measurement programs to collect and analyze data, providing the appropriate level of detail to precisely specify who is responsible for collecting which metrics and the technical procedure to collect them (schedule and technologies). 5. Execute model. Run the strategies, collect and monitor data, assess consistency and completeness and provide real time feedback and adjustments. 6. Analyze results. Filter and prepare data, create descriptive statistics, visualize, and explain and evaluate results according to the interpretation models and baselines.
38 | S o f t w a r e D e v e l o p m e n t P r o c e s s E n h a n c e m e n t : a F r a m e w o r k f o r Measurement-Based Decision-Making
7. Package and improve. Disseminate results, perform a cost-benefit analysis and store reusable and relevant outcomes. Connect to step 2 for next round of goals.
Figure 7. GQM process.
X.iii. Modeling Choices and Alternatives with Impact Vectors The Impact Vector Model settles on and augments the steps of QIP and GQM. First of all, we focus on the process, which is mostly shared by QIP and GQM. After the first step of initialization, the GQM proceeds with the characterization phase; in term of Impact Vector Model, during step 2, the set X of “process, product, project and context attributes” shall be defined. From a geometrical point of view, characterizing the elements listed in step 2, in fact, consists in defining the Impact Vector space, i.e. the dimensions of the impact vectors. During step 3, the objective Process Performance Impact Vector (PPIV) is defined. Multiple business goals can still be summarized in a single PPIV: its coordinates, in fact, encompass all interesting attributes and different objective values can be set on any number of attributes.
39 | S o f t w a r e D e v e l o p m e n t P r o c e s s E n h a n c e m e n t : a F r a m e w o r k f o r Measurement-Based Decision-Making
Step 4, i.e. the definition and planning of data to collect, and methods for their collection, is conceptually unchanged and it consists in the determination of actions to collect data and organize them in the form of impact vectors. During step 5, the geometrical interpretation of the Impact Vector Model provides a quantitative way of measuring and evaluating the progress. The distance between the three points - initial PPIV, current PPIV and objective PPIV – represents the extent to which the goal has already been achieved, i.e. its progression. The projection of the current PPIV onto the dimensions on which goals have been set during step 3 represents the progress with respect to each single goal. Based on such progress, the decision maker could enact some changes. However, GQM+S does not provide the decision maker with any guidelines or methods on how to pick the best alternative, because actually the concept of “alternative strategy” is not explicit in GQM+S. This does not mean that GQM+S is ignoring this issue: step 7, in fact, includes storing the data during last iteration into a knowledge base. Such knowledge is something that can be leveraged to make decisions, and, in step 4, it is explicitly stated that existing measurement plans should be accounted for and reused as possible to set new goals and make choices. Nevertheless, no systematic ways to reusing previous plans are part of GQM+S. More in general, the concept of alternative is not explicitly dealt with in the approach and choices are demanded to implementers’ craft. Here the Impact Vector Model can provide its contribution. When previous and potential choices are modeled as impact vectors, estimations and predictions can be built upon them, each of which leads to a point in the impact vector space. In practice, instead of choosing a single strategy, a decision maker picks the entire set of known possible alternatives and builds an augmented GQM graph. This way, something similar to Figure 3 can be created. The next action has already been described in 0: value-based decision making is enabled and the decision makers can apply the preferred technique to quantitatively come up with the most promising strategies. These strategies will be the nodes in the new GQM graph and the GQM+S process will continue. As already pointed out, the Impact Vector Model can be plugged in also to step 5 of the process, i.e. when real-time feedback are provided at project-level instead of corporate-level; in this case, the type of choices will be different, e.g. selecting a technology or a testing tool, but the procedure for determining the most promising strategies remains the same. It is fairly obvious, but still useful to remark, the high influence of QIP on GQM+S, and, in turn, of QIP and GQM+S on the Impact Vector Model. In particular, impact vectors perform best only in presence of a continuous learning cycle and when evidence-based approaches are planned to pervade the software development process. Furthermore, since the organization of the impact 40 | S o f t w a r e D e v e l o p m e n t P r o c e s s E n h a n c e m e n t : a F r a m e w o r k f o r Measurement-Based Decision-Making
vector repository, as well as the use of impact vectors, requires some form of analysis, synthesis and re-elaboration, it would be useful to have an ad hoc group mediating development teams and repository, e.g. an Experience Factory [6, 7, 8], so to minimize the formalization effort and the population of the space of alternatives.
Chapter XI. Impact Vector Model: Points of Contact with CMMI, ISO/IEC 15504 and Six Sigma Capability Maturity Model Integration (CMMI) [9]: this is a process improvement training and certification program and service administered and marketed by Carnegie Mellon University. CMMI aims to increase the business value produced by the organization via enhancement of the development process, and our Impact Vector Model shares this CMMI aim. According to CMMI authors, CMMI can be used in process improvement activities as a collection of best practices, i.e. a framework for organizing, prioritizing and coordinating activities. However, CMMI is not a process, but rather it describes the characteristics for an effective process to have. CMMI holds both for improving technical processes, including development processes, service processes, and acquisition processes. In order to obtain “process improvement”, CMMI identifies 22 “process areas”, so that activities composing a process to improve can be mapped to one or more process areas to address. For each process area, there are specific “goals”, for which specific “practices” are expected. A process area is a cluster of related practices that, when implemented collectively, contribute satisfy a set of (CMMI) “goals” considered important for making improvement in that area. Depending on which practices are being implemented, an organization can be rated from level 2 to level 5, which corresponds to the capability of the organization. In order to achieve a given level (capability), a pre-determined subset of process areas must be addressed; every level adds some process areas to the ones that are necessary to achieve the lower level. Specific practices can be composed of “sub-practices”, i.e., detailed descriptions providing guidance for interpreting and implementing a specific practice; in our taxonomy, the CMMI terms “specific practice” or “sub-practice” correspond to “activity”. The CMMI idea of “goal”, in the Impact Vector Model, is meant only in terms of measurement, i.e. our requirement is that each CMMI goal should be stated by defining a goal vector, i.e. a PPIV. Therefore, the definition of a goal in our model is more stringent (more similar to “goals” in the GQM paradigm) than CMMI goal definition.
41 | S o f t w a r e D e v e l o p m e n t P r o c e s s E n h a n c e m e n t : a F r a m e w o r k f o r Measurement-Based Decision-Making
Along with “specific practices” and “specific goals”, as implicitly referred above, CMMI identifies “generic practices” and “generic goals”. These lasts describe the characteristics that must be present to institutionalize the practices that are implemented for a process area. Generic practices are activities that ensure that the practices associated with the process area will be effective, repeatable and lasting; they are named generic because they appear in multiple process areas. For our purpose and from a formalization standpoint, the distinction between specific and general practices and goals is marginally important. Conceptually, each application of an activity, including the ones referable to generic practices, is an instance of impact vector. Impact vector attributes (i.e. the coordinates of each impact vector) do not have an equivalent in CMMI, which postpones measurement to maturity levels 4 and 5 and delegates to process managers the identification of suitable metrics and their management, interpretation and use.
Figure 8 CMMI levels and capabilities
Summarizing, concerning companies interested in achieving CMMI levels, impact vectors may play a useful role as soon as an organization aims to achieve levels 4 or 5: use of collected metrics for process improvement are effectively and efficiently viable by using the impact vectors; more specifically, the main targets of the Impact Vector Model are the following process areas: 42 | S o f t w a r e D e v e l o p m e n t P r o c e s s E n h a n c e m e n t : a F r a m e w o r k f o r Measurement-Based Decision-Making
• • •
“Quantitative Project/Work Management” (L4), “Organizational Process Performance” (L4), and “Organizational Performance Management” (L5).
During maturity levels lower than 4, impact vectors can still be leveraged for the following process areas: • “Measurement and Analysis” (L2), • Project/Work Monitoring and Control (L2), • Project/Work Planning (L2), • Process and Product Quality Assurance (L2), • Integrated Project/Work Management (L3), • Organizational Process Definition (L3), and • Decision Analysis and Resolution (L3). At CMMI L2 and L3, the Impact Vector Model can provide qualitative support and a structured approach of addressing decision problems; at L4 and L5, instead, with data being collected systematically, decisions should be based on quantitative information and impact vectors can be totally exploited for control and enhancement purpose. In fact, they can be combined to produce prediction models for different performance attributes, including quality attributes, cost for activities and sub-processes, and every attribute required to perform a quantitative software development management. ISO/IEC 15504 information technology – Process assessment [10], also known as Software Process Improvement and Capability Determination (SPICE), is a set of technical standards documents for software development process. In SPICE, processes are organized in five process “categories”: customer/supplier, engineering, supporting, management, and organization. Each process is assigned a “capability level” between 0 and 5; the level is measured using nine “process attributes”, each consisting of one or more “generic practices”. Then, each generic practice is composed of “practice indicators”, used to assess performance. Performance “assessment” utilizes the degree of fulfillment of process attributes, as measured in the scale {Not-achieved, Partially-achieved, Largely-achieved, Fully-achieved}; values of this scale are assigned to attributes based upon evidence collected against the practice indicators. In other words, while the CMMI appraisal is standardized, the SPICE assessment is not entirely standardized; in fact, the conversion from an indicator to the degree of fulfillment is standardized, but the translation of collected evidence into an indicator is not unambiguously defined. However, some form of tailoring and flexibility is accepted (and actually planned) for both evaluation processes.
43 | S o f t w a r e D e v e l o p m e n t P r o c e s s E n h a n c e m e n t : a F r a m e w o r k f o r Measurement-Based Decision-Making
Figure 9 ISO/IEC 15504 levels and capabilities
Similarly to the comparison with CMMI, also for the case of SPICE impact vectors can represent a good fit for supporting process management and improvement since the beginning of the path (level 1); however, only at the highest capability levels they become most useful, when measurement, control and predictability become keywords for further process enhancement. Six Sigma is a set of tools and techniques for process improvement originally developed by Motorola in 1981 for its manufacturing and business processes. One of the assumptions of Six Sigma is that the development process has “characteristics” that can be measured, analyzed, controlled, and improved. Based on this assumption, Six Sigma encourages continuous efforts to enact a predictable development process, which has to be measured, and includes the definition of quantified value targets, e.g. process cycle time reduction, increase of customer satisfaction, or cost reduction. Value targets correspond to what we call PPIV, hence GQM goals, and the term “characteristics” to be measured is equivalent to our “attributes”. Also in Six
Figure 10 Six Sigma Process
44 | S o f t w a r e D e v e l o p m e n t P r o c e s s E n h a n c e m e n t : a F r a m e w o r k f o r Measurement-Based Decision-Making
Sigma, as well as in the Impact Vector Model, identifying characteristics that are “critical to quality“ (the so called CQs) is one of the most important steps to perform either to identify or to improve, depending on the methodology being (DMADV for process definition or DMAIC for process improvement). Additionally, in the case of definition of a new process (or, by extension, the introduction of new sub-process in an existing process), it requires the identification of alternatives to implement the process, which is something we have already focused on in the previous chapter on GQM+S, when we introduced the concept of choice among different strategies to augment the GQM+S methodology.
45 | S o f t w a r e D e v e l o p m e n t P r o c e s s E n h a n c e m e n t : a F r a m e w o r k f o r Measurement-Based Decision-Making
Page intentionally left blank.
46 | S o f t w a r e D e v e l o p m e n t P r o c e s s E n h a n c e m e n t : a F r a m e w o r k f o r Measurement-Based Decision-Making
Section IV: Impact Vector Framework «In almost everything, experience is more valuable than percept». Marcus Tullius Cicero
47 | S o f t w a r e D e v e l o p m e n t P r o c e s s E n h a n c e m e n t : a F r a m e w o r k f o r Measurement-Based Decision-Making
In Section IV, we present a tool chain that supports the use of the Impact Vector Model in practical contexts. The first tool of the tool chain – Impact Vector Schema - is a piece of Java software of our creation, while the rest of the tool chain leverages existing tools currently used for different purposes.
Chapter XII. Impact Vector Schema: Organize and Store Impact Vectors For the realization of a tool for organizing, storing, and managing impact vectors, we took inspirations from a paper by Sira Vegas and Victor Basili: “A Characterization Schema for Software Testing Technique”, which focuses on software verification technique characterization. According to such paper, a verification technique can be characterized by a hierarchy of levels, elements and attributes. Each technique is characterized across several levels, each level is composed of several elements and each element is composed of several attributes. Each attribute is assigned a value of some data type. The term “attribute” in the aforementioned paper has a meaning alike the one we use in the Impact Vector Model; in fact, if we admit that the value of an attribute can be a probability distribution function on a scale, the term “attribute” makes sense both in the V&V schema by Vegas and Basili, and in the Impact Vector Model. However, the V&V Schema admits free text values for its attributes; even though the Impact Vector Model does not explicitly forbid the use of free text for some attributes, it is recommended that admissible values be machineunderstandable, so to enable automatic analysis. Consequently, the Impact Vector Model requires a higher degree of formalism in the technique characterization than the V&V schema. Also, V&V schema expects to have one sheet (i.e. one instance of the schema) for each verification technique. In the case of the Impact Vector Model, instead, we expect to have a number of impact vectors referring to the same techniques, i.e., an impact vector for each execution of that technique. Subsequently, we can combine such impact vectors referring to the same technique and build a new impact vector that represents the expected performance of that technique, so to help predict the performance of such technique in new applications. In the V&V schema, knowledge about the activity is aggregated in a single sheet (e.g., the cost of a technique falls approximately in a given range, which is supposed to be true for every execution of that technique), which is good for humans, but not precise enough for the automatic processing purpose we defined nor for fitting the Impact Vector Model approach. In conclusion, in order to realize a tool to store impact vector effectively, we can take inspiration from the V&V schema, but we need to place additional constraints, i.e. the ones 48 | S o f t w a r e D e v e l o p m e n t P r o c e s s E n h a n c e m e n t : a F r a m e w o r k f o r Measurement-Based Decision-Making
defined in the model formalization of the Impact Vector Model. Furthermore, we need to widen the focus to including techniques other than verification. Also, structuring attributes in “elements” and “levels” may represent a good idea to cope with management issues: when the number of attributes becomes hardly treatable by a single human, having them organized hierarchically could be an effective way of focusing the attention on those dimensions most relevant to the specific context. In order to allow such structure, however, we do not need to add further formalism in the Impact Vector Model: we intend elements as sets of attributes and levels as sets of elements, but nor elements nor levels do offer specific properties or do have a peculiar theoretical meaning; they are just a way of aggregating attributes in an easier-tomanage hierarchy. One last remark is that one could expect a first identification of some relevant attributes with their consequent organization in levels and elements. However, we recall that the importance of an attribute strictly depends on the context of application. This means that an attribute which is important in a particular context may have no interest in a different context; for example, the “all-p-use coverage” metric of an automatic test case generation tool may be relevant for a safety-critical project, where such a coverage metric may be mandatory to collect and maximize up to a given value, but it may have no interest for a web entertainment application project. Therefore, we do not want to propose here a set of attributes and their structure; we rather postpone such a task to Section V, where we will report on some practical applications of the Impact Vector Model and will show some attributes we identified. In the following of this chapter, we list the main requirements we elicited and implemented for IV-schema, i.e. the tool we realized to store and structure the impact vectors.
XII.i. Impact Vector Schema: Main Requirements Requirements are organized in two sets: the first set includes requirements for managing the impact vectors (data), while the second set includes requirements for managing the structure of the data (dimensions and their hierarchical organization). The following synthesis lists some main requirements implemented for the beta version. A. Managing the structure of the data a. Manage attributes i. List attributes 1. By techniques giving it a value: not all impact vectors have a valid value for each attribute, as some attributes make no sense for some impact vectors (e.g. all-p-uses coverage for a risk management activity) b. Manage activities 49 | S o f t w a r e D e v e l o p m e n t P r o c e s s E n h a n c e m e n t : a F r a m e w o r k f o r Measurement-Based Decision-Making
c. Manage scales d. Manage elements e. Manage levels B. Managing the impact vectors a. List i. By technique ii. By attribute iii. By level b. Create and associate to a technique c. Edit i. For a single impact vector, i.e. those attributes not shared by other impact vector because referred to a specific instance of an activity (e.g. efficiency attributes). ii. For all impact vectors referring to the same activity (e.g. name, element or description) d. Delete impact vector e. Export to datasheet “Manage” requirements include create, read, update and delete operations, as well as export functions.
XII.ii. Impact Vector Schema: Architecture and Technology Typical Software Engineering best practices were employed in the realization of the tool, along with well-known technologies and frameworks. Just to mention some of them: a tailored version of IBM RUP as development process (iterative and incremental); Java as development language; JBoss Seam as development framework, configured to work with JSF and RichFaces, Javascript and Ajax for the view layer (other than HTML+CSS), and Hibernate for the data layer. A view of the data model is reported in the following E-R diagram; the RDBMS used for the current version is MySql, but a migration to DB2 is planned for reasons which will be made explicit later in this work. For an easy understanding, a “record” in the model represents an impact vector instance, while a “vvnode” represents a technique. “Value” and “datatype”, instead, are the way we currently represent a scale, i.e. by means of a member (value) and its semantics (datatype); for this beta version, this representation is enough, but in the future it will require refactoring and improvement in order to accommodate the implementation of algebras for attributes. The rest of the entities and relationships is intuitive and matches our taxonomy.
50 | S o f t w a r e D e v e l o p m e n t P r o c e s s E n h a n c e m e n t : a F r a m e w o r k f o r Measurement-Based Decision-Making
Figure 11. E-R diagram of IV-Schema
The business logic is implemented via the Home Controller pattern, heavily used by JBoss Seam; the business logic model is reported in the following UML class diagram.
Figure 12. Business Logic Layer: Use of the Home Controller Pattern
51 | S o f t w a r e D e v e l o p m e n t P r o c e s s E n h a n c e m e n t : a F r a m e w o r k f o r Measurement-Based Decision-Making
The application server used to test the tool is JBoss AS and the integrated development environment is Eclipse. The complete and exact technology stack is as follow: • MySQL Community Server. v5.1 • MySQL Workbench. v5.2 • MySQL Java Connector v5.1 • Eclipse IDE for Java EE Developers. v.3.6 Helios SR2 • JBoss Tool. v3.2 • JBoss Application Server. v.6.1.0.Final • JBoss Seam. v2.2.2.Final (including Hibernate) • Apache Ant. v1.8.2-4 The current version of the tool can be found on www.mastrofini.it/iv-schema.
Chapter XIII. Using IBM Cognos Insight™ to Visualize, Explore, and Analyze Impact Vectors Once impact vectors and their structure are exported as Excel files, they can be imported in more sophisticated tools for visualization, exploration and analysis. In particular, we identified IBM Cognos Insight™ [12] as an adequate tool for managing multidimensional data, doing reporting and facilitating visualization and exploration of impact vectors. Cognos Insight is a tool for Business Intelligence (BI), where by BI we mean a set of theories, methodologies, processes, and technologies to transform raw date to information useful for business performance improvement. Cognos Insight permits to study business performance, identify patterns and trends in the data, and plan improvement strategies. Among its main concepts, we highlight the following: (i) workspace: a composition of graphical elements (widgets) for the analysis, exploration, filtering, and visualization of business data; (ii) dimension: set of pieces of information that describe an aspect of the business, e.g., geographic dimension or time dimension; (iii) level: a slice of a dimension, e.g. region, nation, and city are three levels of the geographic dimension; (iv) measure: a quantifiable performance indicator, e.g., sell price or margin; (v) cube: a multidimensional representation of business data like dimension and measure. Cognos Insight can import data from csv, xls, xlsx, txt, asc, tab, cma file formats, but also from proprietary formats and from IBM databases. For this reason, we plan to port the IV-Schema tool from MySQL to DB2, which is natively supported by Cognos Insight. When importing data, Cognos Insight allows to map data to match the planned structure with its inner representation. 52 | S o f t w a r e D e v e l o p m e n t P r o c e s s E n h a n c e m e n t : a F r a m e w o r k f o r Measurement-Based Decision-Making
In particular, Cognos Insight tries to automatically map data to identify hierarchies and measures. This is an important feature: as we have seen in the previous chapter, in fact, we want to group and organize impact vectors in hierarchies (i.e. level, elements and attributes). With the only issue of taxonomy mismatches, we can easily map IV-Schema (or, equivalently, V&V Schema) members to IBM Cognos Insight members. What Cognos Insight calls “measure” is actually a dependent variable, i.e., a performance indicator that has to be optimized in order to increase the business value produced by the company. In the Impact Vector Model, every attribute can play the role of Cognos Insight measure, but, of course, some of them make more sense, depending on the context and on the needs. Therefore, during the mapping step, a decision maker can indicate which attributes being imported should be represented as measures in Cognos Insight. A limitation of Cognos Insight is that it can manage non nominal scales of measure. However, nominal scales can be dealt with as non-measures and obtain an equivalent effect in terms of visualization, exploration and analysis capability. One more limitation, instead, is that the data types “probability distribution function” and “mass function” are not managed. On the other side, visualizing this type of data may be problematic and we are currently investigating ways to cope with this issue, as well as whether resolving this is issue can bring some added value to the tool chain and to the entire framework. Additional features of the tool include: drill up and drill down; sorting; exploration points (for filtering and organizing data); calculations; time rollup. Cognos Insight offers a number of chart types, that can be automatically generated starting from the available data. Slicing and dicing of data is really efficient when done via Cognos Insight and it reveals a number of aspects of interest of the data under study. Finally, commercial versions of Cognos Insight also allow to share workspaces and strategies among users, so to enable spreading the information across the company and a collaborative approach to data production and provisioning, according to the established access rights to the platform. However, Cognos Insight only supports qualitative analyses and reporting, so additional tools are needed for quantitative statistics, hypothesis testing and data mining. IBM SPSS Modeler can be integrated with Cognos Insight, as the first can read and write data for the latter. SPSS supports the creation of predictive analytics and advanced statistical analysis, so to complement most of the functionality required for data analysis. On the side of IBM tools, there are many other offerings, both commercial (e.g. by Microsoft and Oracle) and free/open source (e.g. Weka). For time constraints, we did not yet perform an extensive comparative study to identify the statistical and data mining tools that best fit the structure of our model. 53 | S o f t w a r e D e v e l o p m e n t P r o c e s s E n h a n c e m e n t : a F r a m e w o r k f o r Measurement-Based Decision-Making
However, once we jump in the statistical or data mining world, the concept of impact vector becomes less visible and has a minor influence on the way such analyses are performed; therefore, we do not need not investigate this aspect any longer in this work and redirect the interested reader to more focused books and manuals.
Chapter XIV. IBM Method Composer™ & IBM Team Concert™: Infuse, Estimate, Manage, Measure, and Improve with Impact Vectors One last point of interest, on which we want to focus for the definition of a tool chain for impact vectors, is on how to concretely employ the Impact Vector Model via existing tools used to manage the development process. The first tool we want to focus on is IBM Rational Method Composer (RMC), a flexible process management platform, built on top of Eclipse, with a method authoring tool and a process asset library to help implement measured improvement. Through RMC, one can create, tailor, manage, and publish process descriptions. In particular, among the many features, we want to highlight the possibility of creating estimation models. As explained in the IBM information center (http://pic.dhe.ibm.com/infocenter/rmchelp/v7r5m1), an estimating model is a way of calculating estimates that can use any number of estimating factors. An estimating factor is something that has a quantitative influence on the effort required to perform a task or activity. Examples of estimating factors are use case complexity (complex, medium, simple), business areas, platforms, screens, classes, use cases number. In order to compute an estimate, estimating formulas are used. The estimating formula is a relatively simple algebraic equation and the estimating factors are the parameters used in that equation. After the estimating factors are defined, the estimation formula can be used to calculate the estimated effort required to complete a task or work breakdown element. The result of the calculation is typically expressed in hours. Estimating factors can be associated with a task or activity, and estimates and summary values can be computed via a predefined list of formulas that cannot be edited. As well as for the Impact Vector Model, RMC provides a bottom-up estimating approach. Estimates are created for tasks in a work breakdown structure (WBS) for a project and summed through the WBS to arrive at an estimate for the whole project. The depth where the bottom up approach is selected is not necessary a leaf of the WBS, but one can select any level and then climb the WBS structure up to the root of the project. 54 | S o f t w a r e D e v e l o p m e n t P r o c e s s E n h a n c e m e n t : a F r a m e w o r k f o r Measurement-Based Decision-Making
Summarizing, RMC fixes the set of combination functions to a predefined one, allows to estimate the effort of an activity or task, and supports the definition of estimation factors (i.e., impact vector attributes). Even though the combination function is a crucial part of the Impact Vector Model and the effort is not the one dependent variable we are interested in estimating, RMC resulted as the most useful tool to infuse the Impact Vector Model in the practice of an enterprise. Its native integration with Rational Team Concert (RTC), another IBM tool for lifecycle management, allows carrying the impact vectors throughout the process tasks in teams’ everyday work that can be characterized, planned, monitored, measured, and improved with a fine-grained development process quantitative management. For further details on RMC and RTC, we demand the reader to the next section, where examples of application and integration between these tools and the Impact Vector Model are proposed. Again, we want to remark that our survey of the state of the practice was not exhaustive, but rather driven by our industrial partners. For the future, we plan to investigate new tools and alternatives to support the Impact Vector Model. In conclusion, as of today, the tool chain suggested for using the Impact Vector Model in a practical context is represented in Figure 13.
Figure 13. The recommended tool chain end-to-end for using the Impact Vector Model.
55 | S o f t w a r e D e v e l o p m e n t P r o c e s s E n h a n c e m e n t : a F r a m e w o r k f o r Measurement-Based Decision-Making
Page intentionally left blank.
56 | S o f t w a r e D e v e l o p m e n t P r o c e s s E n h a n c e m e n t : a F r a m e w o r k f o r Measurement-Based Decision-Making
Section V: Impact Vector Model: Experimentation
57 | S o f t w a r e D e v e l o p m e n t P r o c e s s E n h a n c e m e n t : a F r a m e w o r k f o r Measurement-Based Decision-Making
In this Section, excerpts from our published papers and our work executed at companies’ are reported, as documentation of the practical application of the Impact Vector Model. Even though we did not have the time to fully employ impact vectors in a single, encompassing context, we actually had the chance to experiment nearly all parts of the framework in isolation and in different contexts, with different goals and different issues. Therefore, for presentation reasons, we made the decision to create an abstract company, the Impact-One, and report our real experiences as they were performed in this context. Furthermore, given the criticality and sensitiveness of the content of our studies, we will often obfuscate the results and provide only partial views, according to the restriction and classification policies enacted by our partners. So, the reported results, though representative and realistic, do not necessarily reflect the reality. We catch the opportunity to mention the organizations that contributed to the experimental validation of our model and supported our investigations. In order of intervention during the validation process: • University of Rome Tor Vergata, Italy (2010-2013); • MBDA Italia, Italy (2011-2012); • Fraunhofer Center for Experimental Software Engineering - Maryland, USA (2012-2013); • NASA, USA (2012); • IBM Italia, Italy (2012); • Keymind, USA (2013).
Chapter XV. Impact-One: Virtuous Company Leveraging the Impact Vector Framework XV.i. First Steps for Applying the Impact Vector Model: Context The Impact-One is a philanthropic, young, innovative and florid organization operating in the field of complex medical devices development. The devices developed by the company operate in an integrated way, so to form a network of devices collecting a lot of data from many patients. Data are stored on some servers geographically distributed that interact and exchange data transparently to the devices. Then, Impact-One technology supports physicians for their diagnoses via a distributed web application, which assures privacy to patients while interactively guiding the physician through the evaluation of plausible alternatives via data exploration, including data collected on other servers.
58 | S o f t w a r e D e v e l o p m e n t P r o c e s s E n h a n c e m e n t : a F r a m e w o r k f o r Measurement-Based Decision-Making
Therefore, Impact-One IT progress requires a diverse and broad set of skills within the software division. The company has so far outsourced the development of all pieces of software to a couple of companies; however, the software development, though not under direct control of ImpactOne, has always been executed in tight connection and continuous collaboration with the rest of the company teams. As of now, management has decided to incorporate software development into the company as an internal, new division, with the goal of reducing software development costs while maintaining the current quality of produced software. In order to achieve this goal successfully, the Quality Division has been assigned a new software quality assurance head: Jed Squa. Squa’s goal is to support the company at defining a sustainable, predictable, innovative, and high-end software development process; he is highly skilled in the impact vector model methodology. Without entering the organizational details of all the Impact-One’s divisions, we just want to list them and provide some overview information: • Development division (cyan squares and yellow squares on the left side of Figure 14), including the 3 groups of Electronics, Mechanics, and System (cyan), now extended to 4 groups with the inclusion of Software (yellow); • Quality division (green and brown squares, in the middle of Figure 14), with one Quality Assurance (QA) group per development group (green), including software QA (brown); • Human Resources division (dark blue squares on the right); • Marketing division (very dark blue squares on the right); • Finance division (light blue squares); • Administration division (very light blue squares), with its Legal and Accounting groups. If we focus on the Software Development group within the Development Division, the following teams exist: Architecture and Analysis (3 people); Design (4 people); Coding (11 people). Software QA (SQA) group within the Quality Division is composed of 8 people: a SQA lead (i.e., Jed Squa), a team leader for each used software verification technique (i.e., test, formal methods, simulation, and inspections), a responsible for software reliability, one more for software safety and the last one for software process. SQA team leaders have the authority to require that Development people be assigned to assurance activities. Software Development group and SQA group form the so called software intergroup. Since many consultants have been working full time at the company for several months, some of them were acquired as employees and already have a good baseline experience with the domain; however, a few new people were also hired and assigned to the Software Development group. 59 | S o f t w a r e D e v e l o p m e n t P r o c e s s E n h a n c e m e n t : a F r a m e w o r k f o r Measurement-Based Decision-Making
Figure 14 Organizational Structure
All development groups, but software, have a well-established development process, clear standards to follow, and interaction dynamics among groups and teams are consolidated. The part of those dynamics that is most interesting to the new software group is the interaction with the system group, which takes care of: (i) system requirements definition, breakdown and allocation to subsystems; (ii) system integration for putting together the developed subsystems, assess and possibly forward change requests coming from other development groups. Therefore, the software team is expected to integrate with those dynamics and get to be part 60 | S o f t w a r e D e v e l o p m e n t P r o c e s s E n h a n c e m e n t : a F r a m e w o r k f o r Measurement-Based Decision-Making
of the game. This lets Squa believe that the most critical point be project time: a not well consolidated team, whose interaction dynamics are not established nor known, may lead stretching development time unexpectedly. For this reason, particular care to project time control shall be taken. On the other side, it would be unreasonably expensive to implement the same development process both for the embedded software and for the web platform. Therefore, a very rigorous process shall be proposed for the embedded software, while a more flexible and free process shall be implemented by the teams working on the web software.
XV.ii. First Steps: Activity Characterization
Identification,
Definition,
and
Once given the general description of the company, we focus on the software intergroup. More specifically, we want to begin by focusing on the work of establishing a development process for the embedded software; this step starts by identifying and defining process activities required to be performed. As part of activity definition, also their characterization in terms of measurable indicators is expected. In the taxonomy of the Impact Vector Model, Dr. Jed Squa well knows that this means to define the set of attributes we are interested in considering in the context under study. This is the first, mandatory step to start applying the Impact Vector framework. After a deep analysis of the state of practice and the state of the art, under suggestion of Dr. Squa, the company proposed to adopt the IBM Rational Harmony Process for Embedded Software™ [13], tailored to accommodate the organizational structure, contexts, needs, and goals. Aside this process, the IBM Rational Rhapsody™ tool was selected as Integrated Development Environment. Afterwards, a picky analysis of each single activity and task in Harmony has started, along with a review of the related literature with the goal of concretely and precisely characterize the activities’ performance in a measurable way. As an example, if we take the task “Definition of the architecture”, the identified metrics of interest are: • Average time spent to define each architectural element; • Average time spent to define all communication links for a given architectural element; • Average time required to generate all architectural elements related to a single use case. It should seem obvious that those metrics are some sort of dependent variables, because we would like to tune the activity – i.e., to manipulate some other attributes of the activity – to optimize those metrics (i.e., to reduce the average times as much as possible without compromising the quality). Attributes to manipulate include: 61 | S o f t w a r e D e v e l o p m e n t P r o c e s s E n h a n c e m e n t : a F r a m e w o r k f o r Measurement-Based Decision-Making
• • • • • •
•
Presence in the architecture definition team of an architect with more than 20 years of experience, a Boolean value; Presence in the architecture definition team of an architect with at least 10 years of experience, a Boolean value; Presence in the architecture definition team of an architect with at least 5 years of experience, a Boolean value; Number of people directly involved in the definition of the architecture, an Integer value; Average number of years of experience of all involved architects, a Real value; Degree of innovation of the selected technologies (e.g. frameworks or tools), a value in an ordinal scale: very low (no unused technology), low (1 new technology selected, for which a well historical record of application exists in literature), medium (2-5 new technologies selected, for which well historical records of application exist in literature), high (1 new technology selected for which no historical record of application exists in literature), critical (more than one new technology selected for which no historical records of application exist in literature) Average number of requirements change requests generated per architecture element.
So, the first three metrics, along with the last 6 metrics, are dimensions of the space in which the impact vectors will live and evolve. Every task of our tailored version of Harmony will provide its contribution to the Impact Vector Space by possibly introducing further dimensions. So the number of dimensions can increase significantly. However, not all dimensions are relevant to every task of Harmony: this can be managed by assigning to the insignificant dimensions their zero value. E.g., the average number of requirements change requests generated per architecture element could have an irrelevant influence on the performance of tasks like unit testing (actually, it does not even make any sense for such a task). Based on the formulation of the Impact Vector Model, Dr. Squa knows that this fact does not represent a big deal: the analysis of the data collected overtime will elicit this fact when building the Activity Performance Function (we will later see how that happens). In this paragraph, we have given a partial example on the type of activity characterization. In the next paragraph, we provide a much more detailed description of the proposed process, including not only activities, but also tools, roles, and built-in metrics that can help address our main goal: project time control. We also show how all descriptions were inserted in IBM Rational Method Composer™, the tool we mentioned and recommended for use with Impact Vectors. Nevertheless, we do not focus on the independent variables, i.e. those characteristics
62 | S o f t w a r e D e v e l o p m e n t P r o c e s s E n h a n c e m e n t : a F r a m e w o r k f o r Measurement-Based Decision-Making
of the activities that need to be tuned in order to achieve the planned goal. This further aspect (i.e. the independent variables) is the object of the next Section.
Chapter XVI. Tailoring the IBM Rational Harmony for Embedded Software In this part of the work, we elaborate on the IBM Rational Harmony process for the development of embedded devices, as the ones being developed by Impact-One.
XVI.i. Process Description As previously mentioned, Systems Engineers provide the other development groups, including the Software Group, with some subsystem requirements specification. Starting from these requirements, the Software Group is expected to execute the following 20 activities, which we group by 7 phases. I. System Requirements Analysis A1. Analyze Stakeholder requests; A2. Define System validation plan; A3. Specify Requirements and trace them (e.g., Traceability matrix) to Stakeholder requests; A4. Review Requirements, Traceability, System validation plan, and perform risk analysis and produce Risk analysis document. II. System Functional Analysis A5. Identify and trace Use cases to Requirements (Context Diagram, CD, and Use Case Diagram, UCD). A6. Define Black box use case design (Activity Diagrams, AD, Sequence Diagrams, SD, Interfaces and Ports diagram, I&P, State Machines, SM, and Black-box Definition Diagram, BDD). A7. Define and trace System test plan. A8. Verify Black box use case design through execution and produce related Reports. A9. Review Black box use case design, System test plan, and Reports, and update Risk analysis document. III. Design Synthesis A10. Define System architecture (Internal Block Diagram, IBD). A11. Define White box use case design (AD+SD+I&P+SM+BDD+IBD). A12. Define System integration test plan.
63 | S o f t w a r e D e v e l o p m e n t P r o c e s s E n h a n c e m e n t : a F r a m e w o r k f o r Measurement-Based Decision-Making
A13.
IV.
V.
VI. VII.
Verify White box use case design through execution and produce related Reports. A14. Review System architecture, White box use case design, System integration test plan, Reports, and update Risk analysis document. Unit Implementation and Test A15. Develop or generate units and trace them to White box use case design. A16. Define and trace Unit test plan. A17. Perform unit test, identify bug resolution strategies, and correct problems. System Integration Test A18. Perform system integration test, identify bug resolution strategies, and correct problems. System Test A19. Perform system test, identify bug resolution strategies, and correct problems. System Validation A20. Perform system validation.
Figure 15 is a graphical representation of the process, reporting phases, activities, generated artifacts, allowed paths, and decision gates. The process is incremental, in the sense that the system can be decomposed into subsystems (or parts) which may be developed independently, either by different teams, at different time, or in different increments, depending on schedule and priorities. Obviously, for each decomposition step, a corresponding integration step shall be planned. The process is completely iterative. Specifically, it is within-phase iterative and between-phase iterative. It is within-phase iterative because each one of the phases is iterative. Activities within that phase may be executed as many times as needed in order to achieve the required level of detail and fix all encountered problems, without enacting any particular policy. E.g., when specifying requirements (activity A3, Phase “System Requirements Analysis”), it is possible to come back to the system validation plan and update it. The process is between-phase iterative because it is possible to go back to previous phases as many times as needed. In fact, between each couple of phases, there is a decision gate. Given a phase n, at its end, the sunny day path (green outgoing arrow from the decision gate) allows to move to the next phase n+1, whereas the rainy day path (red outgoing arrow from the decision gate) takes back to the previous decision gate, i.e. the one between phase n-1 and phase n. Such a decision gate chain creates the possibility to rollback to previous phases of the process.
64 | S o f t w a r e D e v e l o p m e n t P r o c e s s E n h a n c e m e n t : a F r a m e w o r k f o r Measurement-Based Decision-Making
Figure 15 Tailored Harmony Process Description
65 | S o f t w a r e D e v e l o p m e n t P r o c e s s E n h a n c e m e n t : a F r a m e w o r k f o r Measurement-Based Decision-Making
However, developers cannot freely go back from any activity of a given phase to an activity of a different (previous) phase. In order to go back to an activity of a previous phase, in fact, developers need to go through the decision gate at the end of the phase they are currently in. This is not a limitation, because the process is incremental and each one phase is iterative, thus there is no risk to fall back to a waterfall process model. Furthermore, it is obvious to notice that, when an issue is detected, developers may make some steps back up to the last passed decision gate. The presence of decision gates, which are the unique points to switch from one phase to another, helps enforce the process. Suppose that, for example, during activity A11, the team detects a defect, e.g. a missing use case. The team goes back to decision gate G3, where the following question shall be answered: Is the detected defect caused by “missing or incorrect black box use case design?”. In case it is, the team goes back again, up to decision gate G2. Suppose that no requirement is missing, thus activity A5 “Identify use case and trace to requirements” is performed, where the identification of the new use case is followed by its tracing back to requirements. If a free iteration between activities of different phases were allowed, then developers could have directly performed A6 and possibly skipped some fundamental activities, i.e. traceability. Enforcing the developers through decision gates aims to avoid such kind of situations and keep the process consistent. To pass through the milestones in the following enables the team to proceed to the next phase. For each iteration, a milestone needs to be planned and met, in order to pass through the decision gate. One more milestone (the first) is also planned after the stakeholder requests analysis. M1. Understood Stakeholder requests. M2. Reviewed and approved Requirements, Traceability, System validation plan, and Risk analysis document. M3. Reviewed and approved Black box use case design, System test plan, Reports, and Risk analysis document. M4. Reviewed and approved Architecture, White box use case design, System integration test plan, Reports, and Risk analysis. M5. Implemented units, and performed and passed unit test. M6. Integrated units, and performed and passed system integration test. M7. Integrated all units, and performed and passed system test. M8. Performed and passed system validation. As part of the Quality Improvement Paradigm, i.e. the approach leveraged to define the proposed process, also a set of metrics for goal-driven process measurement were defined: metrics aim to provide quantitative data to assess the time required by of each process activity. 66 | S o f t w a r e D e v e l o p m e n t P r o c e s s E n h a n c e m e n t : a F r a m e w o r k f o r Measurement-Based Decision-Making
This should, in turn, provide information to project leaders to control the process and to pursue the goal of reducing project time. The proposed metrics are the first step for the definition of a measurement strategy, which planned to be consolidated during the next iteration of the proposed methodology. XVI.i.1.
Process Description: an Example
Figure 16 shows an example of the application of our tailored Harmony process. Specifically, the example is composed of two nested executions of the process: the outer execution is at system-level, the inner at software level. Process phases are named accordingly to the Harmony process, i.e., Requirements Analysis, Functional Analysis, and Design Synthesis. At the end of the execution of the last phase at system level, unit implementation should be planned. As explained in paragraph “Develop or Generate Units and Trace to White Box Use Case Design”, such activity may encompass a further application of the process at a lower level of details. Specifically, it consists in the development of a software subsystem. Software subsystem development passes through the same phases as system development. This time, the unit implementation (i.e. software implementation) consists in generating the source code. Verification phases and artifacts, as well as non-functional requirements management, are not reported for presentation reasons. In short, the process execution is: • System Requirements Analysis: given the Stakeholder requirements, System requirements are derived. • System Functional Analysis: based on System requirements, the System use cases group System functional requirements at Black box design level, and SysML diagrams specify system functions. • System Design Synthesis: for each System use case, a set of SysML System blocks is created and detailed, each representing a part of the system. This way, System white box design is created. • Software Requirements Analysis: a subset of System requirements is allocated to software, and the Software Requirements Engineering discipline derives Software requirements from System requirements. • Software Functional Analysis and Design Synthesis: based on Software requirements, the Software use cases group Software functional requirements. Each Software use case shall also derive from a System use case and implement it in toto or part. This way, Software black box design is created. • For each Software use case, a set of UML Classes is created and specified, each deriving or being part of at least one SysML System Block. This way, Software white box design is created. 67 | S o f t w a r e D e v e l o p m e n t P r o c e s s E n h a n c e m e n t : a F r a m e w o r k f o r Measurement-Based Decision-Making
•
Given UML Classes, source code (i.e., .c, .cpp and .h files) is generated.
Figure 16 also shows traceability relationships among artifacts produced in the process phases.
Figure 16 Process Artifacts, Documentation and Tools across an example of instantiation of the development life cycle
XVI.ii.
Roles in Our Tailored Harmony Process
The main roles to assign during process execution are at least 7 and they are listed in the following. 1. Stakeholder, who represents an interest group whose needs must be satisfied by the project. This role requires specific domain knowledge and may be assigned to one or more staff members, even though such staff also has one of the following roles: Requirements Specifier or Tester. 2. Project Manager, who plans, manages and allocates resources to tasks; shapes priorities; coordinates interactions with customers and users; keeps the project team focused; selects tools, documents to use; decides documentation to generate; 68 | S o f t w a r e D e v e l o p m e n t P r o c e s s E n h a n c e m e n t : a F r a m e w o r k f o r Measurement-Based Decision-Making
3.
4.
5.
6.
7.
deliberates achievement of a goal or accomplishment of a task; schedule meetings, peer reviews and milestone reviews as appropriate. The Project Manager also establishes a set of practices that ensure the integrity and quality of project work products. A Project Manager may also be a Software Architect. Process mastering. Requirements Specifier, who specifies and maintains the detailed system requirements, including non-functional requirements and system constraints. S/he specifies and maintains use cases, i.e. Black-Box Use Case Design. S/he understands user needs. The role may be assigned together with the role of Test Designer. Test Designer, who identifies, defines and conducts the required tests. This includes identifying and describing the appropriate techniques, tools and guidelines to implement the required tests. The role also represents stakeholders who do not have direct or regular representation on the project. A Test Designer may also be a Software Architect, or a Designer. Architect, who has overall responsibility for driving the major technical decisions, expressed as the architecture. This typically includes identifying and documenting the architecturally significant aspects of the system, including requirements, design, implementation, and deployment "views" of the system. The architect is also responsible for providing rationale for these decisions, balancing the concerns of the various stakeholders, driving down technical risks, and ensuring that decisions are effectively communicated, validated, and adhered to. Also, it is responsible for planning the integration. If the project is large enough an architecture team may be created. For smaller projects, a single person may act as both project manager and software architect. In both cases, software architecture is a full-time function, with staff permanently dedicated to it. Designer, who leads the design of a part of the system, within the constraints of the requirements, architecture, and development process for the project. S/he identifies and defines the responsibilities, operations, attributes, and relationships of design elements (e.g. Blocks, Activity Diagrams, Sequence Diagrams, Statechart diagrams, Interface and Port definition diagrams). S/he ensures that the design is consistent with the architecture. It is common for a person to act as both implementer and designer, taking on the responsibilities of both roles. Implementer, who is responsible for developing and testing components, in accordance with the project's adopted standards, for integration into larger subsystems. When test components, such as drivers or stubs, must be created to support testing, the implementer is also responsible for developing and testing the test components and corresponding subsystems. It is possible for two persons to act as the implementer for a
69 | S o f t w a r e D e v e l o p m e n t P r o c e s s E n h a n c e m e n t : a F r a m e w o r k f o r Measurement-Based Decision-Making
single part of the system, either by dividing responsibilities between themselves or by performing tasks together, as in a pair-programming approach. Further roles may be required for specific activities, including: • Independent quality management. • Configuration management. • Change management. • Process enforcement and monitoring. Also, specific roles may be required for specialists and experts, e.g. tool specialist, security expert, safety engineer and so on. However, the selected roles are the trade-off between having many roles and having too many activities assigned to the same role. XVI.ii.1.
Mapping Between Roles and Activities
Only a part of existing roles is involved in each activity. When involved in an activity, a role may be either primary (i.e., the role leads the activity and is responsible for decisions) or secondary (i.e., the role is involved in the activity and its presence is mandatory). Mapping between roles and activities is reported in Figure 17, which further details on the specific tasks each role is expected to perform during each activity are reported in Figure 17.
XVI.iii. Description of Process Activities XVI.iii.1. Analyze Stakeholder Requests The objective of the requirements analysis phase is to analyze the process inputs, i.e., stakeholder requests from systems engineers. For the specific context, as stated in “Software Development Process Enhancement: Baseline Document”, input to software engineers is composed of a sort of functional specification in SysML, quite enough incomplete. Nonfunctional requirements are also provided on the side of functional specification and they are initially incomplete and informal. Because of this, the work to be performed on the stakeholder requests (i.e. functional and nonfunctional specification) is considerable. In particular, a step of requirements elicitation is fundamental to come with a set of software requirements which may be used by software engineers. In order to perform requirements elicitation, an overall understanding of the system is mandatory. In the aim of having a shared understanding of the system among software team members, a global analysis of stakeholder requests and needs is performed in the form of a meeting. 70 | S o f t w a r e D e v e l o p m e n t P r o c e s s E n h a n c e m e n t : a F r a m e w o r k f o r Measurement-Based Decision-Making
Figure 17 Mapping between roles and activities
71 | S o f t w a r e D e v e l o p m e n t P r o c e s s E n h a n c e m e n t : a F r a m e w o r k f o r Measurement-Based Decision-Making
In Harmony, a Stakeholder Requirements Document is generated after analyzing and refining the stakeholder requests. In the context of the Impact-One, it is not necessary to develop an ad hoc document, as stakeholder requests are already formalized in the so called Sub-System Specification (SSS). The following roles shall be involved in the activity as primary roles: • Project manager, who plans the meeting, drives the communication and defines the scope of the system • Stakeholder, who presents its needs and constraints. • Requirements specifier, who elicits needs. The following metrics shall be considered: • Average time spent for analyzing each existing stakeholder requests during the activity (requires the number of stakeholder requests). • Average time spent for modifying each existing stakeholder requests during the activity (requires the number of modified stakeholder requests). • Average time spent for adding each stakeholder requests during the activity (requires the number of stakeholder requests before and after the activity). XVI.iii.2. Define System Validation Plan A plan for validating stakeholder requests should be defined. Agreement upon that plan between systems engineers and project manager is mandatory. Eventually, the validation plan shall include the detailed description of all test scenarios systems engineers are willing to execute and their expected results. The population of the validation plan is iterative, but any modification to that plan shall go through a change management process. In fact, changes to the validation plan may lead to considerable rework on the project, as they may impact requirements and their understanding. The following shall be involved in the activity as primary roles: • Stakeholder, who presents its needs for validation. • Project manager, who accepts and agrees upon the stakeholder validation plan. The following shall be involved in the activity as secondary roles: • Requirements Specifier, which participates in the activity for a deeper understanding of stakeholder needs. • Test Designer, who models test scenarios for validation and create the needed documentation. The following metrics shall be considered:
72 | S o f t w a r e D e v e l o p m e n t P r o c e s s E n h a n c e m e n t : a F r a m e w o r k f o r Measurement-Based Decision-Making
• •
Average time spent for defining each validation test case (requires the number of validation test cases). Average time spent for defining all validation test cases relating to a stakeholder request (requires the average number of validation test cases per stakeholder request).
XVI.iii.3. Specify Requirements and Traceability to Stakeholder Requests After analyzing stakeholder requests, the System/Software Requirements document (SRS) shall be generated. Such document formalizes functional and non-functional requirements in the form of “shall statements”. Each statement describes a single functionality of the systems. Together with SRS, a traceability matrix maps stakeholder requests to system requirements, and a Requirements Diagram models requirements in SysML. Such a diagram helps understanding relationships among requirements (e.g. generalization or derivation), and may support a well-structured traceability policy: for example, whenever a verification tool (e.g. Test Conductor) does not provide functionality for tracing requirements to test cases, SysML requirements (i.e., model elements) may be traced to sequence diagrams modeling test scenarios (still model elements). Traceability to stakeholder requests, instead, is required to: 1. Check that each stakeholders’ need is addressed in at least one requirement. 2. Each specified requirement is motivated by at least one actual need. 3. Support the change management process. The following shall be involved in the activity as primary roles: • Requirements specifier, who formalizes functional and non-functional requirements. The following metrics shall be considered: • Average time spent for defining each requirements during the activity (requires the number of requirements). • Average time spent for tracing each requirement to stakeholder requests (requires the number of traces from requirements to stakeholder requests). • Average time spent for tracing each stakeholder request to requirements (requires the number of traces from stakeholder requests to requirements). • Average time spent to define all requirements deriving from a given stakeholder request (requires the number of requirements and the number of stakeholder requests). • Average time spent on the requirements diagram per added requirement (requirements the number of requirements before and after ending the activity).
73 | S o f t w a r e D e v e l o p m e n t P r o c e s s E n h a n c e m e n t : a F r a m e w o r k f o r Measurement-Based Decision-Making
Figure XVI-18: Requirements Diagram
XVI.iii.4. Reviews and Risk Analysis A software review is a “process or meeting during which a software product is examined by a project personnel, managers, users, customers, user representatives, or other interested parties for comment or approval” [14]. Different degrees of formalism for such reviews may be adopted, depending on company process constraints, project constraints and needs. Along the process, at least the following reviews shall be performed within the project development: • Review of requirements, traceability, and risk analysis. • Review Black Box UCs, traceability, system test plan, reports, and risk analysis. • Review White Box UCs, integration test plan, reports, and risk analysis. Additional reviews shall be planned whereas the company forces their execution at specific stages of the development. Such additional reviews should not match any of the previously listed three reviews. Reviews are to be scheduled by the project leader. Details for each review are provided in the following subparagraphs. During each meeting, a role has in charge to lead the review. 74 | S o f t w a r e D e v e l o p m e n t P r o c e s s E n h a n c e m e n t : a F r a m e w o r k f o r Measurement-Based Decision-Making
In every review, also traceability and risk analysis shall be discussed and checked, and a specific subparagraph describes their review. XVI.iii.5. Review of Requirements During a requirements review, Requirements Specification Checklist (see later in this Section), Project Constraints and Performance Checklist, and Test Checklist shall be used. The following shall be involved in the activity as primary roles: • Project manager, who plans the meeting and deliberates the meeting end when no TODOs or doubts on the documents are left. • Requirements specifier, who leads the meeting by reading and explaining specified requirements and presenting arisen doubts, issues and risks. • Stakeholder, who confirms and validates requirements. The following shall be involved in the activity as secondary roles: • Architect, who participates in the meeting and understands architecture constraints. • Designer, who participates in the meeting and understands design constraints. The following metrics shall be considered: • Average time spent for reviewing each requirements (requires the number of reviewed requirements). XVI.iii.6. Review of Black Box Use Case Design, System Test Plan, and Verification Reports To review the system plan means to check whether a sufficient number and types of test cases have been defined and planned for subsequent system test activities (not model execution, but code execution, possibly in the target environment or simulator). “Sufficient” includes at least two test cases for each function, i.e. an expected input and an unexpected input, even though, in general, coverage criteria shall be defined and satisfied by the plan. When such criteria are defined, review the test plan document means to check that coverage criteria are met. To review the verification report means to check whether: (1) model execution output matches the expected output in the corresponding system test case, and (2) model execution flow matches the expected flow as specified in requirements. During Black Box Use Case Design review, checklists Use Case Model Checklist, Software Architecture Checklist, and Test Checklist shall be used. The following shall be involved in the activity as primary roles: • Project manager, who plans the meeting and deliberates the meeting end when no TODOs or doubts on the documents are left. 75 | S o f t w a r e D e v e l o p m e n t P r o c e s s E n h a n c e m e n t : a F r a m e w o r k f o r Measurement-Based Decision-Making
• •
Architect, who leads the meeting by reading the Black Box Use Case Design, and presenting arisen doubts, issues and risks. Test Designer, who describes the system test plan, i.e. system test cases associated to Black Box Use Case Design.
The following shall be involved in the activity as secondary roles: • Requirement specifier, who participates in the review by checking that all requirements are met and constraints satisfied. • Designer, who participates in the meeting and understands design constraints. The following metrics shall be considered: • Average time spent for reviewing each black box use case (requires the number of reviewed black box use case). • Average time spent for reviewing each diagram of the black box use case design (requires the average number of diagrams in the design). • Average time spent for reviewing all diagrams of a given black box use case (requires the average number of diagrams per black box use case). • Average time spent for reviewing each block defined for the black box use case design (requires the number of blocks in the design) • Average time spent for reviewing all blocks defined for a given black box use case (requires the average number of blocks per black box use case) • Average time spent for reviewing each system test case (requires the number of test cases). • Average time spent for reviewing each verification report entry (requires the number verification report entry). XVI.iii.7. Review of Architecture, White Box Use Case Design, System Integration Test Plan, and Reports To review the system integration plan means to check whether a sufficient number and types of test cases have been defined and planned for subsequent integration test activities (not model execution, but code execution, possibly in the target environment or simulator). “Sufficient” includes at least two test cases for each function, i.e. an expected input and an unexpected input, even though, in general, coverage criteria shall be defined and satisfied by the plan. When such criteria are defined, review the test plan document means to check that coverage criteria are met.
76 | S o f t w a r e D e v e l o p m e n t P r o c e s s E n h a n c e m e n t : a F r a m e w o r k f o r Measurement-Based Decision-Making
To review the verification report means to check whether: (1) model execution output matches the expected output in the corresponding system integration test case, and (2) model execution flow matches the expected flow as specified in Black Box Use Case Design. During White Box Use Case Design review, checklists Use Case Model Checklist, Subsystem Design Checklist, and Test Checklist shall be used. The following shall be involved in the activity as primary roles: • Project manager, who plans the meeting and deliberates the meeting end when no TODOs or doubts on the documents are left. • Architect, who check whether provided architecture and constraints are met. • Designer, who leads the meeting by reading the White Box Use Case Design, and presenting arisen doubts, issues and risks. The following shall be involved in the activity as secondary roles: • Test Designer, who describes the integration test plan, i.e. integration test cases associated to White Box Use Case Design. The following metrics shall be considered: • Average time spent for reviewing the architecture per architectural block (requires the number of architectural blocks) • Average time spent for reviewing each white box use case (requires the number of reviewed white box use case). • Average time spent for reviewing each diagram of a white box use case design (requires the average number of diagrams for each white box use case design). • Average time spent for reviewing each system integration test case (requires the number of test cases). • Average time spent for reviewing each verification report entry (requires the number verification report entry). XVI.iii.8. Review Traceability Matrices Reviewing traceability means to check some properties for all mappings, i.e.: • Stakeholder requests to requirements. • Requirements (including non functional) to Use Cases (black box design). • Use cases (white box) to units and to system integration test cases. • Units to unit test cases. Properties to check are: 1. All higher level artifacts have been traced to at least one lower level artifact. 2. All lower level artifacts are traced back to at least one higher level artifact. 77 | S o f t w a r e D e v e l o p m e n t P r o c e s s E n h a n c e m e n t : a F r a m e w o r k f o r Measurement-Based Decision-Making
3. All trace links are correct, i.e. the traceability makes sense for each trace link. 4. All trace links are complete, i.e. there is no trace link missing from/to an artifact. The following metrics shall be considered: • Average time spent for reviewing each trace from the lower level to the higher level (requires the number of traces from the lower level to the higher level). • Average time spent for reviewing each trace from the higher level to the lower level (requires the number of traces from the higher level to the lower level). XVI.iii.9.
Analysis of Risks
A number of aspects and threats should be analyzed during each review. In case something goes wrong, it may turn to have a major impact on project progress, e.g.: much rework to be performed, the project to fail, to overrun budget or schedule, or not to meet stakeholder needs. Aspects and threats to be accounted include at least: achievability and reasonability of performance goals; volatility of requirements; robustness of the architecture with respect to change; mortality of resources; adequate documentation of algorithms and design rationale; process assurance. In case a structured risk management sub-process is part of the company culture, such plan should be updated and augmented according to review findings. The following shall be involved in the activity as primary roles: • Project manager, who drives the analysis and accept mitigation plans and strategies. Since all other roles, but the stakeholder, are involved in at least one of the reviews, they shall collaborate and contribute, from their specific points of view, to the risk analysis performed during the meetings they participate in. The following metrics shall be considered: • Average time spent for analyzing each risk (requires the number of analyzed risks). XVI.iii.10. Identify and Trace Use-cases to Requirements The first step is to create a use case model which starts with the identification of actors and use cases. An actor is a model element which represents an entity external to the system under development, i.e. an entity whose development is not part of the current project, but which offers and requires interfaces for interacting with the system under development. A use case is a model element which captures a required system behavior from the perspective of the end-user. It is not a function of the system, but rather a set of related scenarios. A 78 | S o f t w a r e D e v e l o p m e n t P r o c e s s E n h a n c e m e n t : a F r a m e w o r k f o r Measurement-Based Decision-Making
scenario is a non-branching sequence of interactions between actors and system under development. Thus, a use case collects all situations a user can find in when trying to achieve a high-level goal the system is required to serve. Both actors and use cases are part of a system use case diagram, which includes: all use cases, both the one primary actor (i.e. the actor activating the use case) and all secondary actors (i.e. non primary actors involved in the use cases) for each use case, and all relationships among actors (i.e. generalization), among use cases (i.e. extension and inclusion), and between actors and use cases (i.e. association).
Figure 19 System use case diagram in Rhapsody
Subsequently, a traceability matrix is incrementally built up, which maps requirements to use cases. This traceability flow down supports the change management process, and allows to check whether all requirements have been allocated to use cases.
79 | S o f t w a r e D e v e l o p m e n t P r o c e s s E n h a n c e m e n t : a F r a m e w o r k f o r Measurement-Based Decision-Making
Figure 20 Traceability matrix from Requirements to Use Cases (Black-Box) in Rhapsody
Also, allocation of requirements can be formalized through the use of the SysML “allocation” relationships. Some development tools, including Rhapsody, automatically create an allocation relationship when the traceability matrix is populated between use cases and requirements. The following shall be involved in the activity as primary roles: • Requirements specifier, who performs all tasks. The following metrics shall be considered: • Average time spent for identifying each use case (requires the number of use identified cases). • Average time spent for reviewing each trace from uses cases to requirements (requires the number of traces from uses cases to requirements). • Average time spent for reviewing each trace from the requirements to uses cases (requires the number of traces from the requirements to use cases). XVI.iii.11. Black Box Use Case Design The design of Black Box Use Case is the same as in Harmony and may be performed in several ways, i.e. any possible path in the following activity diagram, taken from the Harmony Deskbook v3.1.2.
80 | S o f t w a r e D e v e l o p m e n t P r o c e s s E n h a n c e m e n t : a F r a m e w o r k f o r Measurement-Based Decision-Making
Figure 21 Harmony Process to design Use Cases (Black Box Design)
The first step is the definition of the system context in an Internal Block Diagram. The elements of this diagram are instances of SysML blocks, representing each use case and its associated actor(s).
81 | S o f t w a r e D e v e l o p m e n t P r o c e s s E n h a n c e m e n t : a F r a m e w o r k f o r Measurement-Based Decision-Making
Figure 22 System use case model context in Rhapsody
At this stage, blocks are empty and not linked, and their definition is functional to the modelbased approach we are willing to apply. Any path in the activity includes the creation of: one activity diagram per use case; a number of sequence diagrams (one per scenario); one statechart diagram. Also, any path includes the definition of ports and interfaces in an internal block diagram associated to the use case. The previous representation of use cases as SysML block allows to automatically and immediately link each use case to its internal structure and behavior.
Figure 23 Activity Diagram in Rhapsody
82 | S o f t w a r e D e v e l o p m e n t P r o c e s s E n h a n c e m e n t : a F r a m e w o r k f o r Measurement-Based Decision-Making
Figure 24 Sequence Diagram in Rhapsody
Figure 25 Internal Block Diagram in Rhapsody
Figure 26 Statechart diagram in Rhapsody
83 | S o f t w a r e D e v e l o p m e n t P r o c e s s E n h a n c e m e n t : a F r a m e w o r k f o r Measurement-Based Decision-Making
The output of the Black Box Use Case Design is the construction of an executable model. The following shall be involved in the activity as primary roles: • Requirements specifier, who performs all tasks. The following metrics shall be considered: • Average time spent for defining each black box use case (requires the number of defined black box use case). • Average time spent for defining each diagram of the black box use case design (requires the average number of diagrams in the design). • Average time spent for defining all diagrams of a given black box use case (requires the average number of diagrams per black box use case). • Average time spent for defining each block defined for the black box use case design (requires the number of blocks in the design). • Average time spent for defining all blocks defined for a given black box use case (requires the average number of blocks per use case). • Average time spent for defining all use cases deriving from a given requirement (requires the average number of use cases deriving from each requirement). XVI.iii.12. Define and Trace System, System Integration, and Unit Test Plans Based on the gathered and formalized requirements a plan for testing the system shall be defined. Based on the specified subsystem interfaces, a plan for testing the system integration shall be defined. Based on the developed units, a plan testing each unit shall be defined. All plans include all details required to run a test case and check whether the actual output matches the expected output, and whether the actual behavior matches the expected behavior. An appropriate coverage of system cases over system requirements (and of systems integration test over interface requirements, and of unit test over unit requirements) is expected to be achieved through system and system integration test. Criteria for formalizing the term “appropriate coverage” and making it objective are to be defined in advance, also according to system non-functional requirements (e.g. reliability, safety or performance). Also traceability matrices are required: one should trace each requirement to a set of system test cases constituting the system test plan; another one should trace each interface requirements (i.e. each operation) to a set of system integration test cases; one last should trace each unit requirements (i.e. each class method) to a set of unit test cases.. The following shall be involved in the activity as primary roles: 84 | S o f t w a r e D e v e l o p m e n t P r o c e s s E n h a n c e m e n t : a F r a m e w o r k f o r Measurement-Based Decision-Making
•
• •
•
Test Designer, who defines, details and models system test cases associated to the Black Box Use Case Design and system integration test cases associated to the White Box Use Case Design. S/he is also responsible for generate the required documents. Requirements specifier (only for system test plan), who assures that coverage criteria are met by the system test plan for verifying the correct system functionality. Architect and Designer (only for system integration test plan), who assure that coverage criteria are met by the system integration test plan for verifying the correct interaction among subsystems. Both Architect and Designer roles are required, because they are both involved in the White Box Use Case Design, even though they operate at different levels of abstraction (higher for the first role, lower for the last role). Implementer (only for unit test plan), who assures that coverage criteria are met by the unit test plan for verifying the correct unit functionality.
The following metrics shall be considered: • Average time spent for defining each system test case (requires the number of system test cases). • Average time spent for defining all system test cases for a given requirement (requires the average number of system test cases per requirement). • Average time spent for defining each system integration test case (requires the number of system integration test cases). • Average time spent for defining all system integration test cases for a given communication link between blocks (requires the average number of system test cases per communication link between blocks). • Average time spent for defining each system test case (requires the number of unit test cases). • Average time spent for defining all unit test cases for a given unit (requires the average number of unit test cases per unit). XVI.iii.13. Verify Black-Box and White Box Use Case Design through Execution The use case model shall be analyzed through model execution. The primary focus of this form of verification is on checking the generated sequences of messages in response to the given stimuli, rather than on testing the underlying functionality. This last aspect, in fact, will be checked later in the development, as the focus is on verifying the correct interaction between the system under development and the environment. In order to execute the Use Case Model, execution scenarios shall be defined and ran, e.g. through Rhapsody animations. This way, for a given use case and a given scenario, the output
85 | S o f t w a r e D e v e l o p m e n t P r o c e s s E n h a n c e m e n t : a F r a m e w o r k f o r Measurement-Based Decision-Making
of the execution of the use case model can be matched to the expected black box system behavior definition (i.e. the specified behavior).
Figure 27 Scenario (Sequence Diagram) compare in Rhapsody
Detected problems, e.g. errors, incompleteness, or inconsistencies concerning requirements shall be addressed and fixed. The following shall be involved in the activity as primary roles: • Requirements specifier, who executes the model. The following metrics shall be considered: • Average time spent for defining each executable models (requires the number of defined executable models) • Average time spent for defining all executable models for a given use case (requires the average number of executable models per box use). 86 | S o f t w a r e D e v e l o p m e n t P r o c e s s E n h a n c e m e n t : a F r a m e w o r k f o r Measurement-Based Decision-Making
XVI.iii.14. Define System Architecture Defining the system architecture, in Harmony words, “means to determine the best means of achieving the capability of a particular function in a rational manner”. A way for doing that is applying the weighted objectives method (Cross 1989), which allows to potential solutions to functional problems. Such approach includes a sequence of steps, i.e.: • Identity key system functions, i.e. sets of related activities defined in the Black Box Use Case model which may be realized by a single architectural component, e.g. “Capture Biometric Data” may group the activities of “scanning biometrics data”, “authenticate biometric data”, and “display authentication status”, which may be a sub-set of the activities of the use case “Control entry to the system”. • Define a set of candidate solutions for each key system function, e.g. “Fingerprint scanner” and “Optical scanner”. • Identify assessment (solution) criteria for each key system function.
Figure 28 Example of assessment criteria
•
Assign weights to assessment criteria, according to their relative importance.
Figure 29 Example of weight assignment to assessment criteria
87 | S o f t w a r e D e v e l o p m e n t P r o c e s s E n h a n c e m e n t : a F r a m e w o r k f o r Measurement-Based Decision-Making
•
Define utility curves for each assessment criterion, i.e. curves where the x axis is the extent to which an assessment criterion may be met, and the y axis is a measure of effectiveness for that criterion. Some criteria, in fact, have a constantly increasing utility function, i.e. the more, the better (e.g. reliability), while other criteria may have a step function.
Figure 30 Example of Utility Curve Shapes
Figure 31 Example of cost utility function
•
Assign measures of effectiveness to candidate solutions for each criterion. The measure of effectiveness is relative value with respect to a nominal value of the corresponding utility curve.
Figure 32 Example of assignment of measures of effectiveness
88 | S o f t w a r e D e v e l o p m e n t P r o c e s s E n h a n c e m e n t : a F r a m e w o r k f o r Measurement-Based Decision-Making
•
Determine solution by weighted objectives calculation: for each assessment criterion, multiply the measure of effectiveness and its weight, so getting its the weighted value. Add up weighted values for all assessment criteria to produce a score for that candidate solution. The selected solution is the one with the highest score.
Figure 33 Example of solution determination
•
Merge possible solutions to form system architecture. In fact, the previous study on utility curves, assessment criteria, measures of effectiveness and weighted objectives calculation are to be performed for each key system function. Thus, each key system function will generate an architectural solution, which needs to be merged with all architectures generated by analyzing other key system functions. The system architecture is the result of merging such key system function architectures.
The following shall be involved in the activity as primary roles: • Architect, who makes decisions regarding the architecture, perform architecture analysis (e.g. application of the weighted objectives method), by taking into account both functional and non-functional requirements. The following shall be involved in the activity as secondary roles: • Designer, who collaborates to the definition of the architecture by providing feedback on the feasibility of the architecture itself. The following metrics shall be considered: • Average time spent for defining each architectural element (requires the number of defined architectural element) • Average time spent for defining all communication links for a given architectural element (requires the average number of communication links per architectural element). • Average time to generate all architectural blocks derived from a given use case (requires the number of black box use cases).
89 | S o f t w a r e D e v e l o p m e n t P r o c e s s E n h a n c e m e n t : a F r a m e w o r k f o r Measurement-Based Decision-Making
XVI.iii.15. White Box Use Case Design Based on the system architecture concept, the system under development shall be decomposed into parts. Such decomposition shall be documented in Block Definition Diagrams and Internal Block Diagrams and may be performed in a number of subsequent steps, i.e. at gradually lower levels of abstraction. Each black box activity diagram shall be transformed into a white box one by creating swim lanes, each representing a part of the system, and allocating activities to those lanes.
Figure 34 Passing from Black Box Activity Diagram (left) to White Box Activity Diagram (right) [13]
If an activity cannot be allocated to a single block, then it needs to be broken down into at least two activities. Given white box activity diagrams, white box sequence diagram shall be derived. In such diagrams, interactions among subsystems are modeled. Lifelines in white box sequence diagrams correspond to blocks representing subsystems (or, at a lower level, to parts belonging to subsystem blocks). When decomposing a block into parts, block operations shall be partitioned among parts and possibly decomposed into more operations (in case a single operation cannot be allocated to one part). In this last case, the creation of a dependency among lower level operations and higher level operation is required to keep trace of that decomposition. When an operation does not need to be broken down into more operations, it can be just copied to the part in which it has to be allocated. 90 | S o f t w a r e D e v e l o p m e n t P r o c e s s E n h a n c e m e n t : a F r a m e w o r k f o r Measurement-Based Decision-Making
Ports and interface shall also be defined, which is made easier when modeling subsystem interaction by means of white box sequence diagrams, where each message or service represents an interface requirement. Once ports and interfaces are defined, the state-base subsystem behaviors are captured into statechart diagrams. Notice that no explicit traceability is necessary during this activity. In fact, a one-to-one mapping is planned between use cases identified during Black Box Use Case Design and the use cases to be detailed during White Box Use Case Design. However, during review activities, at least completeness shall be verified, i.e. every use case identified during Black Box Use Case Design has been considered during White Box Use Case Design. During decomposition, architectural and design patterns may be leveraged. For example, Boundary-Control-Entity (Eclipse 2010) pattern may contribute to define flexible, reusable, easy-to-understand and software engineered subsystems. An entity element is responsible for some meaningful chunk of information. This does not imply that entities are (or store) data. Entities perform meaningful behavior around some cohesive amount of data. If they do not, then they are just “beans”, not “entities”. An entity interacts with other entities or with control elements. A control element manages the flow of interaction of the scenario. A control element could manage the end-to-end behavior of a scenario or it could manage the interactions between a subset of the elements. A control element interacts with any kind of elements (i.e. boundary, entity or other control). Behavior and business rules relating to the information relevant to the scenario should be assigned to the entities; the control elements are responsible only for the flow of the scenario. A boundary element lies on the periphery of a system or subsystem, but within it (as opposite to actors, which are outside). For any scenario being considered, either across the whole system or within a subsystem, some boundary elements will be the “border elements” that accept input from outside, and provide output to external elements, according to the interface specification of the system or subsystem they belong to. Sometimes boundary elements match Graphical User Interface elements, but this is not a rule. A boundary element interacts with a control element or those boundary elements strictly correlated to it, i.e. not with those boundary elements managing different scenarios (e.g. interface with other subsystems or a different user interface). The following shall be involved in the activity as primary roles: • Designer, who defines subsystems internal structure and behavior, allocate operations, and decompose system blocks.
91 | S o f t w a r e D e v e l o p m e n t P r o c e s s E n h a n c e m e n t : a F r a m e w o r k f o r Measurement-Based Decision-Making
The following shall be involved in the activity as secondary roles: • Architect, who ensures that architecture is understood and respected. The following metrics shall be considered: • Average time spent for defining each white box use case (requires the number of defined white box use case). • Average time spent for defining each diagram of the white box use case design (requires the average number of diagrams in the design). • Average time spent for defining all diagrams of a given white box use case (requires the average number of diagrams per black box use case). • Average time spent for defining each block defined for the white box use case design (requires the number of blocks in the design) • Average time spent for defining all blocks defined for a given white box use case (requires the average number of blocks per use case) XVI.iii.16. Develop or Generate Units and Trace to White Box Use Case Design In a model-based approach, it is possible to generate code from design models. Specifically, it should be possible to generate source code from UML classes. When source code cannot be completely generated, a hybrid approach is also allowed, where code is partially generated and then manual coding is required to completely implement class behaviors. In general, to develop a unit may also be seen as a task of high level. For example a unit may be a system in a systemof-systems. In this case, after applying all process activities at system-of-systems-level, development of a unit may be demanded to a system development team. White Box Use Case Design, in this case, represents the set of stakeholder requests to provide to the system development team. Thus, that team may start its development process, possibly applying the same process, but a lower level of abstraction and complexity. However, in both situations, i.e. code to be written or generated, and a system to be developed, each unit will need to trace some design elements. Specifically, each unit shall have at least one use case to refer to. Conversely, each block or part of the White Box Use Case Design shall be implemented by at least one unit. The following shall be involved in the activity as primary roles: • Implementer, who writes or generates unit code and trace units to model elements of the White Box Use Case Design. The following metrics shall be considered: • Average time spent for generating each leaf unit (i.e. code) (requires the number of generated units). 92 | S o f t w a r e D e v e l o p m e n t P r o c e s s E n h a n c e m e n t : a F r a m e w o r k f o r Measurement-Based Decision-Making
•
Average time required to generate all units deriving from a given use case (requires the average number of units per use case).
XVI.iii.17. Perform Unit Test, System Integration Test, and System Test Plans for unit test, system integration test, and system test already exist at this stage of the process, as they were previously defined. The test case execution can be automatic, if a test environment (partially) support that, or manual. In the last case, drivers and stub may be required. When a bug is detected, a correction action shall be identified and their impact on existing system estimated. If required, a problem report may be generated and provided as input to the change management process. If the bug correction does not impact any other part of the system, it can be turned into practice and the test is run one more time, possibly with leveraging regression testing. The following shall be involved in the activity as primary roles: • Test Designer, who executes test cases, matches actual output against expected output and documents results. The following shall be involved in the activity as secondary roles: • Implementer (only for unit test), who provides support to unit test execution and analysis. • Architect and Designer (only for system integration test), who provide support to system integration test execution and analysis. • Requirements specifier (only for system test), who provides support to system test execution and analysis. • Project Manager (only for system test), who deliberates when the system meets all requirements and is ready to go to validation. The following metrics shall be considered: • Average time spent for running all test cases for a given unit/communication link/requirements (requires the number of test cases). • Average time spent for fixing a bug detected during unit/system integration/system test (requires the number of detected bugs). XVI.iii.18. Perform System Validation System validation is a formal meeting in which the stakeholder receives a work product that is expected to satisfy its needs. During validation, stakeholders base on the system validation plan
93 | S o f t w a r e D e v e l o p m e n t P r o c e s s E n h a n c e m e n t : a F r a m e w o r k f o r Measurement-Based Decision-Making
to run scenarios. The correct execution of each of those scenarios is mandatory to finalize project development. The following shall be involved in the activity as primary roles: • Project Manager, who leads the activity and shows how the product fulfills stakeholder requirements. • Stakeholder, who checks whether the product meets its needs and what planned in the system validation plan. The following metrics shall be considered: • Average time spent for running all validation test cases for a given stakeholder request (requires the number of validation test cases). • Average time spent for fixing a bug detected during validation (requires the number of detected bugs). XVI.iii.19. Further Activities Most project management activities are hard to fit into specific steps of the proposed development process, as most of them are asynchronous or constantly ongoing during project development. Such activities include at least: 1. assign roles to resources; 2. plan, manage and allocate roles/resources to tasks; 3. shape priorities; 4. coordinate interactions with customers and users; 5. select tools to use; 6. establish formal documents to generate; 7. deliberate achievement of a goal 8. deliberate accomplishment of a task; 9. schedule meetings, peer reviews and milestone reviews as appropriate.
XVI.iv.
Artifacts and Tools
During process execution, a number of artifacts shall be generated, including text documents, SysML and UML documents, and test cases. Furthermore, different development environments may be used to support the creation of such artifacts. Specifically, 3 kinds of tools were identified: Requirements Management Tool, Model-Based Development Tool, and Verification Environment. Figure 35 traces: (a) artifacts to process phase in which it is generated; (b) generated artifacts to sub-folders (or equivalent structures) in which they should be stored within the development environments; (c) each artifact to the kind of tool expected to manage it. 94 | S o f t w a r e D e v e l o p m e n t P r o c e s s E n h a n c e m e n t : a F r a m e w o r k f o r Measurement-Based Decision-Making
Figure 35 Mapping between artifacts and tools
95 | S o f t w a r e D e v e l o p m e n t P r o c e s s E n h a n c e m e n t : a F r a m e w o r k f o r Measurement-Based Decision-Making
XVI.iv.1.
Checklists: a Support Tool for Reviews
During reviews (e.g. Requirements, Test Plan or Design reviews) the use of checklists may support the verification task addressing those system aspects which frequently represent sources of problems or malfunctioning. In the next paragraphs some checklist mainly coming from RUP are presented and suggested for use during process reviews. Requirements Specification Checklist Check whether the SRS exhibit fundamental characteristics, including: 1. Correct: Is every requirement stated in the SRS one that the software should meet? 2. Unambiguous: Does each requirement have one, and only one, interpretation? Has the customer's language been used? Have diagrams been used to augment the natural language descriptions? 3. Complete: Does the SRS include all significant requirements, whether related to functionality, performance design constraints, attributes, or external interfaces? Have the expected ranges of input values in all possible scenarios been identified and addressed? Have responses been included to both valid and invalid input values? Do all figures, tables and diagrams include full labels and references and definitions of all terms and units of measure? Have all TBDs been resolved or addressed? For each error or exception, a policy defines how the system is restored to a "normal" state. For each possible type of input error from the user or wrong data from external systems, a policy defines how the system is restored to a "normal" state. 4. Consistent: Does this SRS agree with the Vision document, the use-case model and the Supplementary Specifications? Does it agree with any other higher level specifications? Is it internally consistent, with no subset of individual requirements described in it in conflict? 5. Ability to Rank Requirements: Has each requirement been tagged with an identifier to indicate either the importance or stability of that particular requirement? Have other significant attributes for properly determining priority been identified? 6. Verifiable: Is every requirement stated in the SRS verifiable? Does there exist some finite cost-effective process with which a person or machine can check that the software product meets the requirement? 7. Modifiable: Are the structure and style of the SRS such that any changes to the requirements can be made easily, completely, and consistently while retaining the structure and style? Has redundancy been identified, minimized and cross-referenced? 8. Traceable: Does each requirement have a clear identifier? Is the origin of each requirement clear? Is backward traceability maintained by explicitly referencing earlier 96 | S o f t w a r e D e v e l o p m e n t P r o c e s s E n h a n c e m e n t : a F r a m e w o r k f o r Measurement-Based Decision-Making
artifacts? Is a reasonable amount of forward traceability maintained to artifacts spawned by the SRS? Project Constraints and Performance Checklist 1. Have all requirements derived from existing standard and regulations been specified? How will this be traced? 2. Are there any required standards in effect, implementation language, policies for database integrity, resource limits, operating environment(s), etc.? 3. What is the software supposed to do? This should include the following: a. Validity checks on the inputs b. General responses to abnormal situations, including: overflow, communication facilities, error handling and recovery c. Effects of parameters d. Relationship of outputs to inputs, including input/output sequences and formulas for input to output conversion 4. What is the speed, availability, response time, recovery time of various software functions, etc.? Are both static and dynamic requirements included? 5. What are the reliability, availability, portability, correctness, maintainability, security, etc. considerations? 6. All nominal and maximal performance requirements are specified. 7. Performance requirements are reasonable and reflect real constraints in the problem domain. 8. The workload analysis model provides estimates of system performance that indicate which performance requirements, if any, are risks. 9. Bottleneck objects have been identified and strategies defined to avoid performance bottlenecks. 10. Expand Collaboration message counts are appropriate given the problem domain. 11. Executable start-up (initialization) is within acceptable limits as defined by the requirements. Use Case Model Checklist 1. Have you found all the actors? 2. Is each actor involved with at least one use case? 3. All functional requirements are mapped to at least one use case. 4. All non-functional requirements that must be satisfied by specific use cases have been mapped to those use cases. Software Architecture Checklist 1. The system has a single consistent, coherent architecture. 97 | S o f t w a r e D e v e l o p m e n t P r o c e s s E n h a n c e m e n t : a F r a m e w o r k f o r Measurement-Based Decision-Making
2. The number and types of component is reasonable. 3. The system will meet its availability targets. 4. The architecture will permit the system to be recovered in the event of a failure within the required amount of time. 5. The architecture provides defines clear interfaces to enable partitioning for parallel team development. 6. System performance estimates have been validated using architectural prototypes, especially for performance-critical requirements. 7. The architecture provides for recovery in the event of disaster or system failure. Subsystem Design Checklist 1. The name of each subsystem is unique and descriptive of the collective responsibilities of the subsystem. 2. The subsystem description accurately reflects the collective responsibilities of the subsystem. 3. The subsystem, through its interfaces, presents a single, logically consistent set of services. 4. The subsystem is the responsibility of a single individual or team. 5. The subsystem realizes at least one interface. 6. The interfaces realized by the subsystem are clearly identified and the dependencies are correctly documented. 7. The subsystem's dependencies on other model elements are restricted to interfaces and packages to which the subsystem has a compilation dependency. 8. The information needed to effectively use the subsystem is documented in the subsystem facade. 9. Other than the interfaces realized by the subsystem, the subsystem's contents are completely encapsulated. 10. Each operation on an interface realized by the subsystem is utilized in some collaboration. 11. Each operation on an interface realized by the subsystem is realized by a model element (or a collaboration of model elements) within the subsystem. 12. Subsystem partitioning done in a logically consistent way across the entire model. 13. The contents of the subsystem are fully encapsulated behind its interfaces. Test Checklist 1. Each test case states the expected result and method of evaluating the result. 2. Test cases have been identified to execute all product requirement behaviors in the target-of-test. 98 | S o f t w a r e D e v e l o p m e n t P r o c e s s E n h a n c e m e n t : a F r a m e w o r k f o r Measurement-Based Decision-Making
3. For each requirement for test, at least two test cases have been identified. 4. Each project requirement (as stated in use cases or the supplemental specifications) has at least one associated requirement for test or a statement justifying why it is not a requirement for test. 5. A clear and concise test strategy is documented for each type of test to be implemented and executed. For each test strategy, the following information has been clearly stated: (1) The name of the test and its objective; (2) A description of how the test will be implemented and executed; (3) A description of the metrics, measurement methods, and criteria to be used evaluate the quality of the target-of-test and completion of the test. 6. Have sufficient tests been implemented to achieve acceptable test coverage? XVI.iv.2.
Contribution of Agile Models to the Proposed Development Process
An aspect to consider when developing systems is that, rather than depending on a contract or a statement of work, the customer could work closely with the development team, providing frequent feedback. In our specific context, customers are represented by systems engineers, who ask for a subsystem to be developed. Interaction between systems and software engineers may represent the key to the project success. Moreover, direct communication among team members should be frequent enough to share knowledge on the full software system and report encountered issues. One more remarkable point is that effectively responding to changes requires to make sure that planning is flexible and ready to adapt to those changes. Furthermore, when a change arrives, the development team should come up with a reliable impact analysis, which may be provided only in presence of a clear traceability form stakeholder requirements to code artifacts, passing by all design and intermediate artifacts. Not only change management, but, more in general, a well-structured configuration management leads to a traceable, manageable and predictable evolution of the project. The definition of a well structure configuration management process is scheduled in next iterations of the enhancement process.
XVI.v. Requirements Engineering Discipline Proposal So far we have described the process activities for our tailored Harmony Process and provided a detailed description concerning the metrics to target our goal: project time control. However, that goal is not the only aspect to account for; as an example, in this paragraph, we provide additional metrics for requirements-related activities (i.e. Requirements Engineering Discipline).
99 | S o f t w a r e D e v e l o p m e n t P r o c e s s E n h a n c e m e n t : a F r a m e w o r k f o r Measurement-Based Decision-Making
Quality Attribute Unambiguous
Complete
Definition
Metric
Notes
An SRS is U iff Y = Z[ = percentage of \ every r in R has one requirements with unique interpretation. interpretation given by reviewers during a review. ^ An SRS is C iff every ] = = ` ` _ a b` c known requirement percentage of is documented. requirements well documented in the SRS.
nui = number of requirements with unique interpretation given by reviewers during a review. Ambiguity is function of each reader’s background.
nA = number of known and captured requirements. nB = number of requirements poorly specified, abstractly stated, or not yet validated. nC = number of known and not yet specified requirements. nD = number of requirements we do not understand enough to specify them.
Correct
An SRS is Ct iff every requirement represents something which fulfils stakeholder needs.
]3 =
d \
=
d
e` f
percentage of requirements.
]3 =
d \
=
= nC = number of correct requirements. correct nI = number of incorrect requirements. d
e ` gh
=
nI needs to be estimated.
percentage of validated requirements. nNV= number of not validated requirements. A requirement is validated by the customer.
Understandable
An SRS is Un iff all Y = ij = percentage of \ classes of SRS understood readers can easily requirements. comprehend the meaning of all
nUR= number requirements
of
understood
A requirement is understood if a reader reads and correctly comments on it to the SRS
100 | S o f t w a r e D e v e l o p m e n t P r o c e s s E n h a n c e m e n t : a F r a m e w o r k f o r Measurement-Based Decision-Making
requirements with a minimum of explanation.
Consistent
An SRS is Co iff and only if no requirement stated therein conflicts with any project documentation.
authors. Readers include customers, users, project managers, software developers, and testers. ]9 =
e
=
e
e` f
= nI = number of requirements which are inconsistent with any percentage of documents, e.g. interface requirements that are requirements of other systems, consistent with all other system requirements documents. specification and software development plan. \
nC = number requirements. Executable Interpretable Prototypable
Precise
/ An SRS is EIP iff and / only if there exists a software tool capable of inputting the SRS and providing a dynamic behavioral model.
klm =
nop
of
consistent
qrs =
number of executable, interpretable or prototypable of executable, requirements. interpretable or prototypable requirements. ^
= percentage
An SRS is P iff (a) t = u = percentage of np = number ^ numeric quantities requirements. precise requirements. are used whenever possible, and (b) the appropriate levels of precision are used for all numeric quantities.
of
precise
Additionally, the following metrics shall be collected for project progress monitoring: • Missing boundaries: based on the BCE architectural pattern, every actor communicates with the system through boundary class. The number of specified missing defined
101 | S o f t w a r e D e v e l o p m e n t P r o c e s s E n h a n c e m e n t : a F r a m e w o r k f o r Measurement-Based Decision-Making
• • •
boundaries provides a rough estimate if the user interface requirements that has not yet been defined in the model. Concrete use case not defined: number of concrete use cases with no diagrams as description. Hidden model elements: number of model elements not appearing in any diagrams. Number of requirements not traced to use cases.
XVI.vi.
Analysis and Packaging of Results
The methodology is made available in the form of text descriptions and pictures, while Requirements metrics are in the form of a table. The remaining work products are made available in the form of both text description and IBM Rational Team Concert files, produced by using IBM Rational Method Composer, i.e. multimedia browsable HTML files. Specifically, such work products are: 1. Software Development Process Model. a. Flow diagram representing the sequence of activities. b. Description of activities. c. Description of roles. d. Mapping between roles and activities. e. Identification of artifacts and support tools. f. Mapping between activities, artifacts and tools. 2. Requirements Engineering Discipline. 3. Traceability Discipline. 4. Verification and Validation Milestones. Snapshots from the HTML documentation are provided in the following.
102 | S o f t w a r e D e v e l o p m e n t P r o c e s s E n h a n c e m e n t : a F r a m e w o r k f o r Measurement-Based Decision-Making
Figure 36 Work Breakdown Structure and additional information about the process
103 | S o f t w a r e D e v e l o p m e n t P r o c e s s E n h a n c e m e n t : a F r a m e w o r k f o r Measurement-Based Decision-Making
Figure 37 Workflow of activities of a given phase
104 | S o f t w a r e D e v e l o p m e n t P r o c e s s E n h a n c e m e n t : a F r a m e w o r k f o r Measurement-Based Decision-Making
Figure 38 Activity details
Figure 39 Roles belonging to the defined role set
105 | S o f t w a r e D e v e l o p m e n t P r o c e s s E n h a n c e m e n t : a F r a m e w o r k f o r Measurement-Based Decision-Making
Figure 40 Details and description of a role
Figure 41 Details of an artifact
106 | S o f t w a r e D e v e l o p m e n t P r o c e s s E n h a n c e m e n t : a F r a m e w o r k f o r Measurement-Based Decision-Making
Chapter XVII. Testing Activities: A Complete Example of Activity Characterization So, we now have an overview of the process and some documentation. However, there is something beyond that description, which cannot actually be modeled easily and completely in the current version of the IBM Rational product we mentioned: the attributes of the impact vectors, which represent the performance of the development activities. The definition of such attributes is not immediate and effortless, but it requires some work we want to make explicit at least for some of those activities. In the rest of this chapter, we report on the careful literature review we performed for testing, including how we carried on the survey and some of its findings. Afterwards, we will end up having a remarkable set of testing attributes and empirical data that allow making decisions on testing. Over the past decades, hundreds of empirical studies on testing have been performed. Most studies compare a new proposed technique against some others (e.g. against random testing or against similar techniques), while some investigate and assess existing techniques. The way experimental comparisons are carried on, not only for testing, has already been object of study recently and recommendations were provided [15, 16, 17, 18, 19, 20]. Therefore, we decided to carry on an extensive survey of the literature over the last decade in order to identify factors of testing that have a detectable impact on testing performance (in the most general interpretation of this term). The goal of our survey is to define impact vectors, i.e. a homogeneous representation of testing techniques that can enable their comparison and, most importantly, their selection and combination in a practical context. During our survey, we analyzed more than 2000 papers published between 2004 and 2013 and identified over 200 studies reporting results from the empirical investigation of dozens of testing techniques. In order to produce knowledge useful for the Impact Vector Space construction, we created a tree composed of 192 nodes that characterize a number of points of interest. Examples of nodes high in the tree hierarchy include: resources (e.g. cost and people), performance (e.g. effectiveness and machine time), technology (e.g. test case generation approach and level of automation of test case generation), and domain (e.g. real time systems and database). The leaves of this tree represent the dimensions of the impact vectors, while the non-leaf nodes support organizing dimensions in orthogonal categories (see Figure 42 and Figure 43); each leaf has its own scale (ratio, ordinal or nominal, depending on the nature of the attribute). Some of those techniques can be assigned a priori, as they serve as description of the technique (e.g. is the technique random? Is it classifiable as model-based? Is it coverage based?), but some other characteristics must be derived from existing empirical studies. 107 | S o f t w a r e D e v e l o p m e n t P r o c e s s E n h a n c e m e n t : a F r a m e w o r k f o r Measurement-Based Decision-Making
Each testing technique is represented as a single impact vector, whose dimension values are assigned based on the data coming from the empirical studies performed on those techniques. Obviously, no study explores all the dozens of factors we identified (nor it reasonably could). However, most studies block a remarkable number of those factors; e.g. the domain is pretty much fixed in every study and can be easily inferred, once defined an adequate scale (nominal) for that attribute. Some other factors will remain unfilled for a technique, because nobody has studied them yet; this will be a gap in the repository of impact vectors concerning that test technique, which future studies will be able to fill.
Figure 42 Excerpt of tree: "Technology" sub-tree
Figure 43 Excerpt of tree: "Performance" sub-tree
108 | S o f t w a r e D e v e l o p m e n t P r o c e s s E n h a n c e m e n t : a F r a m e w o r k f o r Measurement-Based Decision-Making
One of our findings, however, is that it is not useful to compare absolute values among different studies; e.g. if a technique T1 detects 50% of defects, while another technique T2, in a different study, performs 90%, it does not necessarily mean that T2 is better than T1, e.g. because they were experimented on artifacts of remarkably different quality. Consequently, our approach was to consider absolute numbers only in within the same study; to clarify, if T1 and T2 are techniques investigated within the same study and the percentages of removed defects are 50% and 90%, then T2 results better than T1 and we store this information into a dimension of the impact vector (the scale for such dimension is ordinal and composed of three values: T1 better than T2, T2 better than T1, and T1 equals to T2). The relative goodness of a technique with respect to another is the information stored in the impact vector. As a consequence, the number of dimensions is very high: one dimension exists for each possible non ordered pair of testing techniques that were experimentally investigated. Obviously, more than one study can compare T1 and T2, but we want to record a single score for each. In order to do that, we identified a number of characteristics [17, 18], an analytical formula to come up with a single-study score, and one more analytical formula that aggregates single-study scores to obtain a global score representing the value of the dimension corresponding to the pair of testing techniques under investigation. In the following tables, we report the list of characteristics of the empirical study that we account for the definition of the single-study score, along with characteristic definitions and additional information. Notice that such characteristics do not match the attributes of the impact vectors (i.e., the dimension of the impact vector space), but they are only the means through which we valorize the impact vector dimensions (i.e. one per pair of testing techniques). Table 2 Characteristics of the empirical studies to assign a single-study score
Characteristic Reference ID Technique T1 Technique T2 Slight variation of T1 Slight variation of T2 Family of T1 Family of T2 Effort/Cost of resources Machine Execution Time
Definition Identification of the experimental study material and results A technique value from the mapping table below
If (T1=T2) then (slight variation 1 or slight variation 2) = (yes or tool)
A family value from the mapping table below Result of the comparison (i.e. T1>T2, T1T2, T1T2, T150% defects found are different then high. If 20-50% then partial. Else no/low. In doubt between 2 ranges, be conservative (lower range). If no characterization of defects, then unkown Laboratory study, Formal analysis, Laboratory replication or Field study (for further details, see Juristo&al, "Reviewing 25 years of testing experiments")
Representativity of objects Low if toy, high if industrial. If mix of objects, then if >60% industrial then high, else low. If no characterization of objects, then unknown. If objects under study belongs to a unique category, then the field notes has to be filled
Representativity of subjects
Low if students are not characterized as high skilled, high if professionals or selected skilled students. If mix of subjects, then if >60% professionals then high, else low. If no characterization of subjects, then unknown.
Representativity of faults Low if faults are seeded, high if real faults. If mix of defects, then if >60% professionals then high, else low. If no characterization of faults, then unknown. If faults addressed are of a particular type, tehn the field notes has to be filled.
Type of metric for effort/cost Direct if: person-hour of similar, $ or similar. Else indirect (e.g. calendar time) Type of metric for machine Direct if: seconds on a given machine, number of instructions, number of execution time operations. Else indirect (e.g. number of test cases) Type of metric for Defect Detection Capability Direct if: found/missed defects. Else indirect (e.g. coverage, killed mutants) Notes Optional (except when representativity of objects or faults is different from high, low or unknown)
110 | S o f t w a r e D e v e l o p m e n t P r o c e s s E n h a n c e m e n t : a F r a m e w o r k f o r Measurement-Based Decision-Making
Table 3 Mapping table technique-family
Family randomly generated test cases
Technique pure random manual random feedback directed functional (black-box) testing boundary value analysis control-flow (white-box) testing code (statement) coverage state chart coverage decision (branch) coverage condition coverage data-flow testing all-c-uses all-p-uses all-uses all-edges all-dus mutation testing strong (standard) mutation 10% mutation (constrained) abs/ror mutation (constrained) st-weak/1 exweak/1 bb-weak/1 bb-weak/n regression testing random retest-all (traditional) Deja-Vu (safe) Test tube (safe) modification-based / textual differencing dataflow/coverage-based improvement testing minimization selection augmentation prioritization model-based testing model-based testing concolic testing concolic testing exploratory testing exploratory testing search-based/genetic algorithm testing search-based/genetic algorithm testing
111 | S o f t w a r e D e v e l o p m e n t P r o c e s s E n h a n c e m e n t : a F r a m e w o r k f o r Measurement-Based Decision-Making
Given two techniques T1 and T2 investigated in a study, Single Study Score (SSS) is computed with the following formula of our definition: SSS(T1,T2)=M*R*SO, where M is the maturity, R is the study relevance, and SO is the study output. M is 0.5 for laboratory studies, 0.6 when the laboratory study includes a formal (statistical) analysis, 0.75 for laboratory replication, and 1 for field studies. See the mentioned “Reviewing 25 years of testing experiments” by Juristo & al. for further details. The value of R is 1.5 when the study is of high relevance, 1 for medium relevance, and 0.5 for low relevance. The classification between low, medium and high relevance is made according to the following rules, based on the experiment characteristics reported in Table 4: relevance is high if all applicable characteristics are high/real/direct; relevance is medium if the performance measures are direct and at least 60% of applicable characteristics is high/real; relevance is low in all other cases. Table 4 Experiment characteristics
Accounted characteristics Scale
Sample size Low (=15 subjects)
Subjects' average experience low(=3 years)
Artifact type Faults Artificial or Artificial or real real
Performance measures Proxy or direct
Finally, SO is 1 when T1 performs better than T2, -1 when T2 performs better than T1 and 0 when they perform the same. On this value, we need to add some thoughts: what if T1 performs better, e.g. in terms of effectiveness, but T2 performs better in terms of efficiency? The answer is immediate: for each performance attribute, we produce a different score. Therefore, the score refers only to efficiency or only to effectiveness. Consequently, we have as many dimensions in the impact vector space as the number of performance characteristics we want to consider multiplied by the number of possible pairs of testing techniques. Based on this formulation, for each study we can obtain a SSS per testing technique performance characteristic. However, as previously stated, for each pair of testing techniques and for each performance characteristics we want to have a single global score. We obtain such Global Score (GS) through the following formula: GS(T1,T2)= ∑SSS(T1,T2) /#studies, i.e. the average value of SSSs. As an example, we report the impact vector generated by accounting only the results of the study in [21] on state chart coverage vs code coverage. In that study, the output is that the two techniques perform the same in terms of percentage of removed defects, so the value for that dimension (relative goodness in terms of effectiveness) is “T1 equals to T2”). Machine time is accounted for, so the value of the corresponding dimension is “Unknown”. However, a lower 112 | S o f t w a r e D e v e l o p m e n t P r o c e s s E n h a n c e m e n t : a F r a m e w o r k f o r Measurement-Based Decision-Making
level of detail is considered concerning the effectiveness: the authors of [21] investigate the type of defects detected by each technique. As reported in Table 2, we have a specific set of dimensions taking that into account. Also for this dimension, there is an issue: different studies may use different defect taxonomies. However, something more objective is the complementarity of techniques: if a study detects that two techniques find different defects, then this is the information we want to store in our impact vector. In particular, in [21], authors find that combining state chart coverage and code coverage improves the effectiveness of the verification process, as they detect different defects; consequently, combining them leads to a higher percentage of detected defects. This information is stored in the “complementary” dimension of the impact vector (its scale is “high”, “low/no” and “unknown”; objective criteria to select the value are also defined). One can easily visualize the results of this review in the form of a square matrix, where rows and columns are the techniques, while the cells contain the global scores for each pair (rows vs columns). The matrix is symmetric and the cells on the diagonal do not make sense. An additional visualization help is the color: since complementarity of defects is very relevant, we color the cells in yellow when detected defects are of different nature, blue when they are of the same nature, and white when no information on the defect nature is available. An excerpt of the matrix we generated is reported in Figure 44. One more aspect to consider is that if technique T1 performance better (for some performance attribute) than T2 and T2 performs better than T3, then we can also say that T1 performs better than T3. In this case, we do not have any direct empirical studies for the pair , but we can still insert something in the matrix, even though no scores can be computed; therefore, we insert a plus or minus sign when we can say, by transitivity, that the technique on the row is better or worse, respectively, than the one on the column. So far, we identified around 40 impact vectors, with a total of around 400 pair-wise comparisons across all testing techniques we analyzed and listed in Table 3. For each impact vector (technique), we gave value to each dimension which was accounted for in the study or that could be objectively inferred. Slight variations of a technique are still accounted as a single technique and such singularity is also stored in an ad hoc dimension of the impact vector. Summarizing, in order to build an empirically-founded baseline of performance of testing techniques, we had to go through a long examination of the literature. Without the use of the Impact Vector Model, the knowledge acquired during such examination would have been written in a report or, worst case, kept implicit by the people performing the review. Via Impact Vectors, not only the knowledge is made explicit, but it is also well-structured, machineexecutable, maintainable, and reproducible. 113 | S o f t w a r e D e v e l o p m e n t P r o c e s s E n h a n c e m e n t : a F r a m e w o r k f o r Measurement-Based Decision-Making
Figure 44 Excerpt of the testing technique comparisons
One could argue that this procedure is very expensive, in particular when replicated for all subprocesses of the development process. E.g., what about design techniques? Do we need to perform a similar investigation? Actually, that is true: such analyses can turn out very expensive; on the other side, we believe that the testing example we reported about is one of the most expensive, because software literature is full of researchers and practitioners proposing their techniques and reporting their experiments in deeply different ways. For other parts of the development, e.g. for software inspections or safety cases, the literature can be much smaller and, consequently, cheaper to explore. Additionally, in general, it is not mandatory to make such studies for all possible activities: the construction of impact vectors can be incremental and new dimensions can progressively be added to the space whenever they become relevant. Of course, the sooner the dimensions are identified, the earlier corresponding data can be collected and used for process improvement. Finally, the analysis of literature to build baseline Impact Vectors is also optional: having such baseline enables leveraging a measurement-based approach to process enhancement since the beginning, because internal teams can leverage external teams’ experience. However, if such baseline does not exist, people can still process as they use to do in most contexts where date are not being used for process improvement or are not even collected. Overtime, data collected within the company will give birth to an internal repository of Impact Vectors. Such repository would probably have higher degree of internal consistency and will produce recommendations and results very reliable for internal teams; on the other side, it would probably be much smaller and with many more gaps with respect to a repository born from the aggregation of data coming the literature or, even better, from the collaboration of many companies sharing their data in a centralized repository (see Section VI, Software Engineering 2.0). 114 | S o f t w a r e D e v e l o p m e n t P r o c e s s E n h a n c e m e n t : a F r a m e w o r k f o r Measurement-Based Decision-Making
Chapter XVIII. Sequencing Verification Techniques: an Experiment One of Squa’s believes is that changing the order of application of verification leads to drastically different results. However, accounting for all reasonable sequences of verification activities may turn very expensive. Therefore, before starting to collect data, Squa decides to make sure whether the order of verification techniques has some impact on the performance of the verification. Since software literature does not provide much information, he requires some form of experimentation. In this chapter, we report on an experiment that investigates the performance of verification processes composed of the same verification techniques executed in different orders. Specifically, we report on two controlled experiments that Impact-One commissioned to us; the two experiments focus on sequences of two verification techniques: perspective-based inspection and unit testing. Results suggest that the performance of a verification process, in terms of recall and defect detection rate, strongly depends on the order of application of the techniques; therefore, interactions and synergies among verification techniques produce quality- and cost-relevant effects on the overall verification process that a decision maker should take into account. XVIII.i.1. Introduction Organizations aiming to develop highly reliable software systems, e.g. Defense or Space companies and agencies, clearly rely on a highly effective verification process and put a lot of effort in its definition. Also for organizations in other domains, where the reliability is desirable, an efficient and well-working verification process is recommended in order to maintain an agile and flexible process while assuring the adequate quality. Defining such a verification process includes decisions on the verification techniques to apply, on their order of execution and on the effort to allocate. Several verification techniques have been extensively studied in literature and adopted in industry. Moreover, some combinations of more than one verification technique have been defined, investigated and applied, as described in more detail in the next Section. In this paper, we want to study sequences of verification techniques, as opposite to combinations [22], this last being a term that brings to the independence from the order of application [23]. Our hypothesis is that the order of execution of the verification techniques has a significant impact on the overall verification process performance. Consequently, decision concerning the verification process should be made while keeping into account synergies and mutual 115 | S o f t w a r e D e v e l o p m e n t P r o c e s s E n h a n c e m e n t : a F r a m e w o r k f o r Measurement-Based Decision-Making
interactions among verification techniques, so to maximize the benefits that each technique can get from techniques applied prior to it. In the following paragraphs, we will report on our experimental investigation on two research questions. The first one is RQ.1: does the order of application of verification techniques impact on the overall verification process performance? Furthermore, we know from our experience and from Impact-One qualitative analyses, that the definition of the verification process is commonly a continuous and iterative task that requires decision makers to define the next techniques to apply during the development; therefore, the verification process is not defined entirely and solely upfront. Such quasi-real-time decisions are made taking into account at least the following aspects: (i) the already achieved quality, (ii) the expected quality, and (iii) the available resources. Thus, it is useful to investigate and address the following further research question: (RQ.2) does the performance of a verification technique depend on the previously applied techniques? RQ.2 is fundamentally different from RQ.1. In fact, while RQ.1 addresses a planning problem (i.e. the definition of the most performing verification process for the current project), RQ.2 addresses a control problem: given the current state of the project, which verification technique(s) should be applied next in order to achieve the expected quality goals? In order to answer the two previous research questions in a concrete scenario, we report on two controlled experiment taking into account two verification techniques: Unit Testing [22] and Perspective-Based Inspection [24, 25]. Because of the limited available experiment subjects, we narrowed our study to one type of artifact, i.e. Java code, and to the aforementioned verification techniques. As we will be explaining in the next paragraphs, results show the importance of accounting for the order of application of verification techniques, as different orders lead to statistically different results. Therefore, one of our conclusions is that a strategic approach in defining the verification process is highly recommended, e.g. the one we proposed in [26, 27], because it would focus the problem of ordering the techniques rationally, and would allow leveraging the mutual influences between techniques. In particular, we will show how a strategic vision in defining the verification process can support decision makers addressing diverse practical problems efficiently, e.g.: given a predefined budget, which process maximizes the performance within that budget? Given a performance goal, which verification technique should be applied to minimize the effort required to achieve the goal?
116 | S o f t w a r e D e v e l o p m e n t P r o c e s s E n h a n c e m e n t : a F r a m e w o r k f o r Measurement-Based Decision-Making
XVIII.i.2. Related Work A wide literature remarks the extensive importance for a well-defined verification process [28, 29, 30, 31, 32, 33, 34] and many empirical studies, comparing verification techniques to evaluate their performance, date back of many years [33, 34, 33, 34, 35, 36, 37, 38, 39, 40, 41, 42, 43, 44, 45, 46]. Results reported by these papers are sometimes contradictory and report strongly different performances for the same techniques; such differences may derive from a myriad of causes and experimenters struggle to control factors that can potentially disturb their specific investigations. As we will be reporting, one of such factors can be the verification techniques executed upfront the investigations on the experiment objects. Surveying the literature also revealed some papers addressing the problem of combining verification techniques. In particular, some of them assert that the overall verification performance may benefit from the combination of different verification techniques [22, 45], and some others propose and experimentally investigate concrete combinations [47, 48, 49, 50, 51, 52, 53, 54, 55, 56, 57, 58, 59, 60, 61, 62, 63, 64], including the combination of inspection and testing [47, 56, 58, 62, 63, 64]. However, such studies mainly focus on the capability of different techniques to detect different defects; consequently, their combination results in a higher number of detected defects for reasons intrinsic to the techniques being used, i.e. their capability of targeting particular defect types, so that their union gives rise to a bigger set of found defects. Some more studies go further and propose more elaborated combinations, consisting of a number of verification techniques to be applied in pre-planned sequences [44, 47, 59, 60]; the presence of such pre-planned sequences implies that the order of application may have a disruptive importance, generally because the output of a technique is required as input to the next technique; consequently, violating the order would turn the process unfeasible. Moreover, slightly different approaches attempt to adjust and address testing by leveraging information gathered via inspections or other analysis techniques [47], which recall to some form of order on verification techniques; nevertheless, in these latest studies, techniques to be applied first are not used for detecting defects, but mainly for test case selection and prioritization. Additionally, in the past, an iterative approach for systematic selection of verification strategies was proposed in [49], where the authors also sketch the possibility that the order of application of verification techniques might influence the cost-effectiveness of a verification strategy, but they do not report any specific empirical study. Based on this literature survey, the idea of sequencing treatments seems to be quite felt in the field of Software Engineering, and its importance has already been recognized in scientific
117 | S o f t w a r e D e v e l o p m e n t P r o c e s s E n h a n c e m e n t : a F r a m e w o r k f o r Measurement-Based Decision-Making
research also in other fields [65]; few examples of the so called “sequencing treatments” exist not only in Medicine [66], but also in Psychology [67], Psychiatry [68], and Human Sciences [69]. However, not much emphasis has been put on the experimentation and comparison of different and feasible sequences of verification techniques in Software Engineering, which is the goal of our investigation. In fact, in our literature survey, we could identify only one study doing so [64]. In that study, authors compare two different sequences of code inspection and unit testing. In our study, we propose again the comparison between sequences of the two same techniques, but we also introduce some changes in the experiment settings. The first difference is the reading technique – usage scenarios for [64], perspective-based for the present study. The second difference is on the time allocated for each task: unbalanced in [64] (2h30m for testing, 1h30m for inspection), balanced in our experiments (1h for each technique). A third and most important difference is that, in [64], the same team executes both techniques in a row, while, in our experiment, two different teams execute two distinct techniques (one each, in sequence) and the first team hands off the produced list of defects to the latest team. Further details motivating our design choices are provided in the next Sections, along with results of our investigation. XVIII.i.3. Experiment Description and Design Experiment Overview The purpose of this study is to evaluate the effect that ordering verification techniques has on the verification process performance, from the point of view of a decision maker planning for or controlling the verification process. The experiment factor to investigate is a two-step verification process , where the syntax denotes a sequence of two verification techniques and means that the technique T1 is to be applied before the technique T2. Since we focus on Perspective-Based Inspection (PBI) and Unit Testing (UT) on code artifacts, we define the following treatments, each corresponding to a Process Performance Impact Vector (PPIV): , , , . The main focus of the experiment is on comparing against , which will address RQ.1. However, in order to address RQ.2, we made the decision to include and as a way to assess the performance of the single techniques within a treatment. In order to have comparable results between UT and PBI (i.e. to have a fair comparison), UT is intended to include defect identification, i.e., defect detection and subsequent defect localization in the code. This way, PBI and UT produce the same type of information [37], i.e. they detect the presence of a defect and its location in the code. 118 | S o f t w a r e D e v e l o p m e n t P r o c e s s E n h a n c e m e n t : a F r a m e w o r k f o r Measurement-Based Decision-Making
The maximum time allocated to each technique is one hour; the duration of the stages is balanced and, consequently, the treatment time is fixed to a maximum of 2 hours. Finally, we planned to execute the experiment twice, the second time as a replica of the first time with different subjects, in order to reinforce the study validity. Metrics The measures of performance we consider are: Recall (R), defect Detection rate (D), and percentage of False positives (F). R is defined as the ratio of found defects to the number of known defects in the artifact. It represents a way of measuring the effectiveness of the technique. D is intended as the ratio of found defects to the time spent for finding them. It adds cost considerations to the effectiveness and we use it as a way of measuring the efficiency of the technique. F is the ratio of number of false positives to the number of report records (i.e. the onecomplement of precision); a false positive is a detection which does not elicit a defect. This last metric is relevant because each false positive, as well as each defect, provokes some rework to be performed in the future; however, rework caused by a false positive should be minimized, as it does not produce beneficial effect. Whether a report record is a defect or a false positive is a decision of a software engineer not otherwise involved in the experiment. These 3 metrics are obviously three dimensions of the impact vectors. Context Selection and Defect Seeding Subjects are 18 graduate students with experience with small- and medium-sized projects. They took classes in Software Engineering, Requirement Engineering, Object-Oriented Analysis, Design and Programming, and Software Architecture. Subjects also received specific training on the testing and inspection fundamentals and procedures to be used in the experiment. Subjects involved in each experiment were 9. The rationale for selecting such subjects is the small cost and the availability; in fact, the experiments run in the academic context, during class hours of the Experimental Software Engineering course, a teaching of the second year of the Master’s degree in Computer Science and Software Engineering at the University of Rome – Tor Vergata. The experiment artifacts were portions of an academic project developed during a previous course in the first year of the same Master’s degree. The application is web-based, it is composed of around 5500 lines of Java code, and it manages university courses, student enrolments, exams, exam sessions and several user profiles. None of the experiment subjects worked on that project before. Different units of such project were used during each session of 119 | S o f t w a r e D e v e l o p m e n t P r o c e s s E n h a n c e m e n t : a F r a m e w o r k f o r Measurement-Based Decision-Making
the experiment. Objects were selected in order to achieve the maximum homogeneity in terms of complexity and size. Considered structure, size and complexity of the code, our decision was to seed seven defects per artifact. The average size of code artifacts is 607 ELOC, thus the average defect density is 1.15% [70, 71, 72, 73], which should characterize the software quality of the experiment artifacts as poor [74]. Since we wanted to reproduce the first verification task in the development process (i.e. the first verification technique applied right after writing the code), this density seems to us both realistic and adequate for not getting the subjects exposed to too high a number of defects, which could cause the subjects to get lost in not-working software. The defect seeding procedure consisted in introducing (i) initialization defects and (ii) mathematical and logical mutants [75]. Experiment Design The four treatments (i.e. , , , and ) were administered by providing subjects with two techniques in two sequential stages, whose duration is up to onehour each. Teams were allowed to complete earlier than one hour, in case all team members agreed upon considering the task completed. This way, we wanted to measure the efficiency of each technique based on the actual time spent to accomplish the task. The identification of the detected defects was requested, but not their correction; consequently, the output of each treatment provided the same amount of information, that is: (i) the list of defects detected with respect to the given requirements specifications, (ii) the duration of the executed technique, and, (iii) for each defect, the line(s) of code where the defect was located. For each subject, a use case description and a sequence diagram were provided as specification of the functionality to examine, in addition to the related Java code. When performing UT, subjects were instructed to create a set of test cases and write some lines of code (i.e. test drivers) for testing the functionality. Also, there were expected, and enforced by the observers, not to read the code before writing all test cases. When performing PBI, instead, subjects were expected to read the code, focusing on the assigned perspective, a non-compilable version of the code was provided, so to disallow them to execute the unit. Based on the artifacts to be inspected, the following two perspectives were defined and assigned: (A) Integration perspective, which takes into consideration: parameter passing, validity of input parameters, compatibility of interfaces, and compatibility and use of output parameters; (B) Unit perspective, which takes into consideration: logical correctness of
120 | S o f t w a r e D e v e l o p m e n t P r o c e s s E n h a n c e m e n t : a F r a m e w o r k f o r Measurement-Based Decision-Making
functions (i.e., in object-oriented terms, classes and bodies of their methods), correct elaboration of input parameters, and correct generation of outputs. Because of the limited number of subjects, we had to limit the number of perspectives to two. The assignment of the two perspectives is random within the team, with the constraint that each of the two perspectives is implemented the same number of times by each team member during the experiment. This way, we plan to mitigate the influence of each subject’s skills on the experiment outcome. Subjects performing PBI worked in a team composed of two people, one perspective per member, while teams performing UT were composed of one subject. Teams were not allowed to directly interact and communicate at any time. When the treatment is or , the same team works on the same artifact for both stages. When the treatment is < PBI, UT> or , the team
Figure 46 Experiment design sketch
Figure 45 Experiment design sketch
assigned to the first stage is different from the team assigned to the second stage. This last will receive the list of defects produced by the first team; the list is anonymous, so there is no way for the second team to find out (and possibly interact) with the first team. Figure 45 and Figure 46 provide a graphical explanation of the experiment design. In the upper part of Figure 46, the same team executes twice UT, whilst, in the lower part, two different
teams execute the two different techniques. The motivation for such design is that, in a real context, in particular for systems where verification is required to be very accurate (e.g. Space and Defense systems), it is frequent and reasonable to expect different teams to perform code inspections and unit tests. In our study, we wanted to reproduce such a context.
121 | S o f t w a r e D e v e l o p m e n t P r o c e s s E n h a n c e m e n t : a F r a m e w o r k f o r Measurement-Based Decision-Making
A final remark on the design is that no specific guidelines were provided on how each team was expected to use the list of defects received by the previous team; therefore, the team executing the second technique of the process was free to evaluate each record of the received list and establish whether it was a defect or not. In case it was, the team reported that record in its own report; otherwise, the record was discarded and was not part of the verification process output. Subjects used their own laptops, where they had previously installed Eclipse Helios [76], and Java EE 6 [77], with which all of them were familiar. Mitigation of the Impact of Subjects’ Skills on the Experiment Before each experiment, we ran a pilot study to assess the capability of the subjects at identifying defects with PBI and UT. Based on the results of such pilot studies, we created three groups of three subjects for each experiment; the rationale for assembling groups was to minimize the variance among group capabilities, so to minimize impact of subjects’ individual capability on the experiment results. The two subjects constituting each PBI team are picked up from the same group, while the third subject of the group performs UT on the same artifact; in the next step, the subject who performed UT performs PBI, together with one of the two subjects previously involved in PBI, on a different artifact. Then, the subjects who performed twice PBI performs UT, while the remaining two subjects perform PBI on fresh artifacts. This way, after three rounds, there will be 3 artifacts, as exemplified by Figure 46, on which the group (as a whole) has performed both PBI and UT (with different subjects) and, thus, has produced the list of detected defects. Such artifacts and the corresponding identified defects are then provided as input for the teams that perform the second techniques of the treatments. In particular, as aforementioned and represented in Figure 46, if the randomly selected artifact for the treatment is A1, than subjects 1 and 2 will perform one more hour of PBI on A1; if A2 is the artifact selected for , then it will be delivered to a subject not belonging to the same group of subject 2, together with the list of defects produced by subjects. Design Validity To be as close as possible to a real environment, during the experiment design, we paid attention not to have the same team work on the same artifacts with both techniques (PBI and UT). In general, in fact, UT may be not performed (and, in our reference customers, usually it is not) by the same team performing PBI and vice versa. Letting the same team perform both UT and PBI on the same object could have biased the experiment results: in such a case, in fact, the performance of the second technique of the treatment could benefit from the knowledge
122 | S o f t w a r e D e v e l o p m e n t P r o c e s s E n h a n c e m e n t : a F r a m e w o r k f o r Measurement-Based Decision-Making
gained during the execution of the first technique, which would cause the performance of the second technique to be biased. The participation in the experiment was optional and the subjects were not evaluated based on the experiment results. To make the effect of maturation over all treatments homogeneous, the order in which treatments were executed was balanced across time (i.e. each treatment had to be applied at least once before any treatment being applied for the second time). Therefore, randomization was used, but in respect of such constraint. Generalization of results to an industrial context is limited due to the fact that (a) graduate students rather than professionals participated in the study, and (b) experiment objects were different portions of the same software project. Since the goal of this study is not to identify the best verification process, but rather to provide evidence on the importance of a correct and well-reasoned sequencing of verification techniques in each context, we consider acceptable such validity issues. XVIII.i.4. Result Analysis The first question to answer is RQ.1: does the order of application of verification techniques impact on the verification strategy performance? In order to answer, we need to compare the performance of the two treatments and . First we run normality tests: pvalues of the Shapiro-Wilk test are reported in Table I for both experiments; the tests show that most samples are normally distributed, except in 3 cases. The chosen alpha is 0.025 and significant p-values are bolded and underlined. TABLE I.
Experiment Treatment 1
TESTS OF NORMALITY (SHAPIRO-WILK TEST)
p-values of the Shapiro-Wilk tests Recall (R) Defect Detection Rate (D) Percentage of False Positives (F) 0.756 0.623 0.065
0.458
0.721
0.009
0.018
0.734
0.088
0.726
0.968