This paper provides a quantitative method of measuring the process compliance for each of TMMi levels. ... testing in the various software process improvement.
Journal of Engineering, Computers & Applied Sciences (JEC&AS) ISSN No: 2319-5606 Volume 2, No.6, June 2013 _________________________________________________________________________________
Software Test Process Assessment Methodology Dr.S.K.Sudarsanam, Professor, VIT Business School Chennai, VIT University, Chennai ABSTRACT This paper provides a methodology for rating the process areas of TMMI for each of the levels of Maturity. TMMI (Test Maturity Model Integration) framework has been developed by TMMi foundation as a guideline and reference for test process improvement. Currently the process attribute rating scale includes only four measures. This paper provides a quantitative method of measuring the process compliance for each of TMMi levels. Keywords: TMMI, Test Process improvement (TPI), Key Process Area (KPA), Maturity model, Test Process Assessment, Test Process Rating
Introduction The Capability Maturity Model (CMM) and its’ successor the Capability Maturity Model Integration (CMMI) are often regarded as the industry standard for software process improvement. Despite the fact that testing often accounts for at least 30-40% of the total project costs, only limited attention is given to testing in the various software process improvement models such as the CMM and the CMMI. To overcome this, Testing community have created many complementary models ([1], [3], [4] and [5]). TMMi is one such model. The TMMi is a detailed model for test process improvement and is positioned as being complementary to the CMMI.
process for each of the process area under each of the maturity levels.
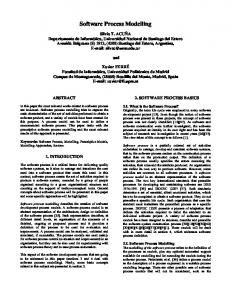
TMMi [1] has a staged architecture for process improvement. It contains stages or levels through which an organization passes as its testing process evolves from one that is ad-hoc and unmanaged, to one that is managed, defined, measured, and optimized. Achieving each stage ensures that an adequate improvement has been laid as a foundation for the next stage. The internal structure of the TMMi is rich in testing practices that can be learned and applied in a systematic way to support a quality testing process that improves in incremental steps. There are five levels in the TMMi that prescribe a maturity hierarchy and an evolutionary path to test process improvement. Each level has a set of process areas that an organization needs to focus on to achieve maturity at that level. Each of the maturity levels has its own process areas and each process area has to comply with a set of specific goals and generic goals. Each of the specific goal has its own specific practices which when implemented will achieve the specific goal. Generic goals and practices are common for each process area and it covers institutionalizing of managed process and institutionalizing of defined
www.borjournals.com
Blue Ocean Research Journals
52
Journal of Engineering, Computers & Applied Sciences (JEC&AS) ISSN No: 2319-5606 Volume 2, No.6, June 2013 _________________________________________________________________________________ TMMI Structure 4.
5. 6.
7.
TMMI Process Attribute Rating TAMAR [2] produced by TMMi foundation provides the following process attribute rating guidelines. The level to which an organization achieves a particular process goal should be measured using a scale which consists of the following levels: N (Not Achieved), P (Partially Achieved), L (Largely Achieved), and F (Fully Achieved). 1. To Score “N” (Not Achieved) in relation to a particular process attribute, there should be little or no evidence found of compliance. The percentage of process achievement for processes which would score “N” on this scale would be any score in the range from 0% to 15%. 2. To score “L” (Largely Achieved) in relation to a particular process attribute, there should be significant evidence found of compliance. The process is likely to be both systematic and widespread. However, there may still be some minor weaknesses in the distribution, application, or results of this process. The percentage of process achievement for processes which would score “L” on this scale would be any score over 50% and up to 85%. 3. To score “F” (Fully Achieved) in relation to a particular process attribute, there should be consistent convincing evidence found of compliance. The process should be both systematic and widespread. There should be no obvious weaknesses in the distribution, application, or results of this process. The percentage of process achievement for processes which would score “F” on this scale would be any score over 85% and up to 100%.
www.borjournals.com
These measurements will be applicable to the four levels at which ratings can be applied (Practices and Goals (Specific and Generic), Process Areas, and Maturity Levels) There are two additional ratings that can be utilized. “NA” (Not Applicable) to be used if process attribute is not applicable to the Organization being assessed, and is therefore excluded from the results “NR” (Not Rated) to be used if the process attribute is not ratable due to insufficient or inconsistent evidence.
The rating for each Process Area shall be equivalent to the lowest rating of the Specific and Generic Goals that support the Process Area. The rating for each Maturity Level shall be equivalent to the lowest rating of the Process Areas that support the Maturity Level.
A New TMMI Process Attribute Rating Every Process area has its Specific Goals. Each of the Specific goals has its own specific practices. Each of the specific practices has its own sub practices and work products. In this suggested rating method, each of the subpractices and work products are rated at the scale of 1 to 10 (based on the key evaluation guideline given below). The cumulative average score is calculated and the score is given to the specific practice. The Scores of the each of the specific practices are added to give the total KPA (key process are) score to the particular process area. The table in the next page provides the criteria for evaluating specific practices under each of the specific goals.
Blue Ocean Research Journals
53
Journal of Engineering, Computers & Applied Sciences (JEC&AS) ISSN No: 2319-5606 Volume 2, No.6, June 2013 _________________________________________________________________________________ Score
POOR 0
WEAK 2
FAIR 4
APPROACH No management recognition of need. No organizational ability. No organizational commitment. The practice is not evident.
DEPLOYMENT No part of the organization uses practice. No part of the organization shows interest.
RESULTS Ineffective.
Management has begun to recognize the need. Support items for the practice start to be created. A few parts of the organization are able to implement the practice.
Fragmented use. Inconsistent use. Deployed in some parts of the organization. Limited monitoring/verification of use.
Spotty results. Inconsistent results. Some evidence of effectiveeffectiveness for some parts of the organization.
Wide but not complete commitment by management. Roadmap for practice implementation defined. Several supporting items for the practice in place.
Less fragmented use. Some consistency in use. Deployed in some major parts of the organization. Monitoring/verification of use for many parts of the organization. Deployed in almost all parts of the organization. Mostly consistent use across many parts of the organization. Monitoring/verification of use for almost all parts of the organization. Deployed in almost all parts of the organization. Consistent use across almost all parts of the organization. Monitoring/verification of use for almost all parts of the organization. Pervasive and consistent deployment across all parts of the organization. Consistent use over time across all parts of the organization. Monitoring/verification for all parts of the organization.
Consistent and positive results for several parts of the organization. Inconsistent results for other parts of the organization.
Strong management commitment; some management MARGINALLY becomes proactive. QUALIFIED Practice implementation well 6 under way across parts of the organization. Supporting items in place. Total management commitment. Majority of management is QUALIFIED proactive. 8 Practice established as an integral part of the process. Supporting items encourage and facilitate the use of the practice. Management provides zealous leadership and commitment. WORLD Organizational excellence of the STANDARD practice is recognized even 10 outside of the company.
www.borjournals.com
Positive measurable results in most parts of the organization. Consistently positive results over time across many parts of the organization. Positive measurable results in almost all parts of the organization. Consistently positive results over time across almost all parts of the organization. Requirements exceeded. Consistently world class results. Counsel sought by others.
Blue Ocean Research Journals
54
Journal of Engineering, Computers & Applied Sciences (JEC&AS) ISSN No: 2319-5606 Volume 2, No.6, June 2013 _________________________________________________________________________________ The following data provides a sample evaluation of a process area carried out using the procedure outlined above. The following are the Specific goals of Test Design and Execution Process Area. SG1 – Perform analysis and design using test design techniques (has four specific practices 1.1 to 1.4 below) SG-2 Perform Test Implementation (has four SPs 2.1 to 2.4) SG3 – Perform Test Execution (has 4 SPs – 3.1 to 3.4) SG4 – Manage Test incidents to closure (has 3 SPs 4.1 to 4.3)
SP 1.1 SP 1.2 SP 1.3 SP 1.4
List of Specifice Practices Identify and prioritize test conditions Identify and prioritize test cases Identify necessary specific test data Maintain horizontal traceability with requirements
SP 2.1
Develop and prioritize test procedures SP 2.2 Create specific test data SP 2.3 Specify intake test procedure
Develop test execution schedule Perform intake test Execute test cases Report test incidents Write Test Log Decide on test incidents in configuration SP 4.1 control board Perform appropriate action to fix the test SP 4.2 incident SP 4.3 Track the status of test incidents SP 2.4 SP 3.1 SP 3.2 SP 3.3 SP 3.4
The rating for each of the specific practices is arrived at from the rating for each of the sub practices. Each of the sub-practices and work products are evaluated on a scale of 1 to 10 based on the guidelines outlined in the previous pages. Then the weighted average score is calculated for that particular specific practice. This procedure is repeated for each of the specific practices under each of the specific goals.
www.borjournals.com
The sample rating for each of the specific practices is given below (on a rating scale of 1 to 10). There are 15 specific practices in the TDE process area. 0
1
2
3
4
5 6 7 8 9 10
SP 1.1 SP 1.2 SP 1.3 SP 1.4
x
SP 2.1
x
SP 2.2 SP 2.3
x
x x x
x x
SP 2.4 SP 3.1 SP 3.2 SP 3.3 SP 3.4
x x x x x
SP 4.1
x SP 4.2 SP 4.3
Score
0
0
0
0
x 0 15 36 0 48 0
0
Here the total score for the Test Design and Execution process is 48+36+15 = 99. There are 15 specific practices in this KPA. So the KPA score for the process area is (Total score/Certification Score)*10. The total score for the Test Design and Execution process is 99 and the certification score is 15*8 = 120 (15 – no. of Specific practices in the process area and 8 is the score required for certification for each practice) The KPA score for the TDE process is (99/120)*10 = 8.25 and The level score for the process = 1 + (Process Score/Certification Score) = 1+(99/120) = 1.83 Each process area needs to have a minimum score of 1.8 for it to be assessed at TMMi at that particular maturity level The following results show an assessment of Level 2 processes for a Software Testing company. As the results show except the Test Design and Execution process all other process areas (Test Policy and Strategy, Test Planning, Test Monitoring and Control and Test Environment) failed to reach a minimum score of 1.8 for them to be assessed at TMMi Level 2
Blue Ocean Research Journals
55
Journal of Engineering, Computers & Applied Sciences (JEC&AS) ISSN No: 2319-5606 Volume 2, No.6, June 2013 _________________________________________________________________________________ For a company to be assessed at TMMi L2, it needs to attain minimum score of 1.8 for each of the process areas under the L2 maturity level. For Level 3, Level 4 and Level 5 also, there need to be a minimum rating of 1.8 for each of the process areas under each of the respective maturity levels. So for an organization to be assessed at TMMi L5, each of the process areas under each of L2, L3, L4 and L5 must have a minimum rating of 1.8.
Conclusion This paper provides a new process rating mechanism which can be used as a reference and guideline for carrying out TMMi process maturity assessments for Software Test processes in IT organizations cutting across all domains of business. Also, this can be used by Quality Management teams and Software Engineering Process groups (SEPG) to carry out internal assessment of their organizations to find out the current level of maturity for each of the test process areas. Compared with the rating mechanism outlined by TMMi foundation, the rating appraisal suggested in the previous section provides the rating guidelines and rating scores and implementation of rating scores much more explicitly. The sample evaluation process of a process area and the sample results would help both assessment teams and the Process engineering groups of the companies which are planning for process improvements and implementation of TMMi to have a better understanding of the requirement of each of the TMMi levels, their compliance requirements, assessment guidelines and how the TMMi rating is arrived at. This would help all the stakeholders involved to be better equipped with their understanding of the TMMi assessment guidelines, rating scale and scoring methods.
www.borjournals.com
References [1]. TMMi Foundation, TMMI Framework and Levels, 2009, www.tmmifoundation.org [2]. TMMi Foundation, TMMi Assessment Method Application Requirements (TAMAR) Version 2, 2009, www.tmmifoundation.org [3]. TPI Home Pages, Sogeti Nederland B.V., 2004 www.sogeti.nl/index.html?/iospagina.cfm?uNr=150 [27.9.2004] [4]. TMAP Home Pages, TMap - Sogeti Nederland B.V., 2004, http://www.tmap.net [4.10.2004] [5]. Koomen T and Pol M., Test Process Improvement: A practical step-by-step guide to structured testing, ACM Press, London, England, 1999
Blue Ocean Research Journals
56