Sep 17, 2008 - users find and correct faults (errors) in spreadsheet formulas. The tool has ...... problem to Audit, and turned it off to solve the problem, but doing.
Software Visualization for End-User Programmers: Trial Period Obstacles Neeraja Subrahmaniyan1,2, Margaret Burnett1, and Christopher Bogart1 2Microsoft State University School of EECS One Microsoft Way Corvallis, Oregon 97331 Redmond, WA 98052
1Oregon
{subrahmn, burnett, bogart}@eecs.oregonstate.edu visualization communications with end users can be effective [3], [13], [14], [24], but these are all in controlled laboratory settings, and none of them investigate the adoption decision. In fact, little is known about obstacles to adoption of software visualization for real-world work, either for professional developers or for end-user programmers. Some factors are obviously external to the software, such as a company’s marketing practices, but some tie to the software visualization tool itself. Our focus in this paper is on the latter—obstacles that could be ameliorated by changes within the software visualization tool.
ABSTRACT Software visualization for end-user programmers is a relatively unexplored opportunity area. There are advances in software visualization research pertinent to this, but the adoption stage has been entirely ignored. In this paper, we focus on a popular facilitator of adoption decisions: the free trial period. We conducted a case study of an end-user programmer (an accountant) in this situation, as she tried out a commercial spreadsheet visualization tool to make an adoption decision. The results have implications for both theory and design, revealing open questions, design opportunities, and strengths and weaknesses of theoretical foundations.
One way by which people decide whether to adopt software is to try it out on their own work. Knowledge of potential obstacles within a software visualization tool that affect the user’s decision during the trial period is therefore critical to software visualization researchers and developers who seek to have their technology adopted.
Keywords: Software visualization, spreadsheets, end-user software engineering, software adoption CR Keywords: D.2.5 [Software Engineering]: Testing and Debugging; H.1.2 [Information Systems]: User/Machine Systems— Human factors
In this paper, we present a case study of the experiences of an enduser programmer—an accountant, with years of experience creating and debugging spreadsheets—whose department wanted to evaluate a beta version of a spreadsheet visualization tool. The product they were considering was RedRover Software’s “Audit” product [25], which provides visualizations for debugging Excel spreadsheets.
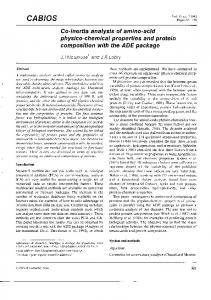
1. INTRODUCTION Software visualization research has made a number of gains in the technology of how to produce visualizations that reveal insights into software behavior, interrelationships, or faultiness (e.g., [11], [12], [22], [30]). To date, these gains have primarily been targeted at professional programmers and at computer science education, but there is also a relatively new opportunity area: to bring the same kinds of benefits of software visualization to end-user programmers, who also must grapple with software development problems. End users create software whenever they write, for example, spreadsheet formulas. Research shows that there are about 3 million professional programmers in the United States—but over 12 million more say they do programming at work, and over 50 million use spreadsheets and databases [28]. Figure 1 shows the breakouts. Thus, the number of end-user programmers in the U.S. alone probably falls somewhere between 12 million and 50 million people—several times the number of professional programmers. There are a few studies that focus on whether and how software
Permission to make digital or hard copies of all or part of this work for personal or classroom use is granted without fee provided that copies are not made or distributed for commercial advantage and that copies bear this notice and the full citation on the first page. To copy otherwise, to republish, to post on servers, or to redistribute to lists, requires prior specific permission and/or a fee.
Figure 1: US users in 2006 and those who do forms of programming [28].
SOFTVIS 2008, Herrsching am Ammersee, Germany, September 16–17, 2008. © 2008 ACM 978-1-60558-112-5/08/0009 $5.00
135
Figure 3: Visualization #2: Integrated visualization of “approved” formula regions (light green border around “Gross Pay” region).
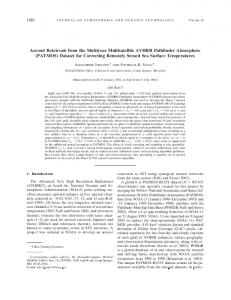
Figure 2: Visualization #1: Integrated visualization of spreadsheet structure in terms of regions of similar formulas. The first five rows calculate pay, and the bottom row adds up the totals.
view. The thickened borders (colored purple) show regions of cells that have the same formula, as adjusted for relative positions, using reasoning about regions similar to that of Fisher et al. [8]. The visualization emphasizes the structure, and is intended to help the spreadsheet user spot potential problems from a structural perspective. For example, the fact that there are three different formulas that calculate the Net Pay cells probably warrants closer scrutiny.
The accountant attended a training session on how to use the tool, and then was given her own copy, which she installed. When her everyday work involved a length of time working with a complex spreadsheet to update and debug it, we came and watched. Our purpose was to identify and understand obstacles to acceptance of a software visualization tool for end users.
The second and third visualizations depict which of these regions’ formulas have been explicitly approved by the user. For example, in Figure 3, the user has approved the formulas in the Gross Pay region. (The user expresses approval with a checkmark in a portion of the side panel, not shown here). Because the visualization in Figure 3 is integrated with the main spreadsheet view, it blends with the visualization of Figure 2. There is also a stand-alone visualization in the side panel (Figure 4) that shows the approval status of all regions.
This case study has ties to several theories about what kinds of obstacles could potentially arise: the Technology Acceptance Model, Minimalist Learning Theory, and Attention Investment, as well as formative empirical work on learning barriers and on enduser debuggers’ information gaps. These theories have much in common, but they are based on different assumptions, and do not always predict the same things. One goal of this paper is to shed light on how and whether these theory-based predictions play out in a real-world situation for an end-user software visualization tool.
The fourth and fifth visualizations are test-oriented fault likelihood visualizations. The fourth is integrated into the main spreadsheet view, blended with the other visualizations in that view, and the fifth is stand-alone. Unlike the previous visualizations, which are based on reasoning directly about formulas, these visualizations are based on reasoning about values and their implications on formulas.
The contributions of this paper are therefore (1) the identification of obstacles faced by an end-user programmer giving a serious, real-world tryout to a software visualization tool, (2) an enumeration of ways the end-user programmer managed to overcome some of these obstacles, and ways she might have been able to overcome others if she had used other resources, (3) identification of chains of events that prevented the end-user programmer from overcoming some obstacles, along with cascading effects, (4) events leading to abandonment of visualization features, and finally (5) connections of the observed phenomena with predictions from the applicable theories and formative empirical work of other researchers.
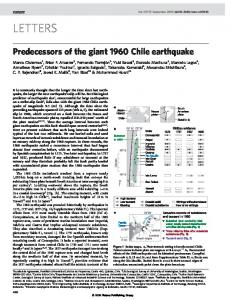
They work as follows. If the user notices correct values, he or she can “check them off”, and can “X out” incorrect values. These marks, which the user makes directly in the spreadsheet, trigger fault localization computations that result in highlights on all cells whose values (and therefore formulas) contributed to the erroneous value. For example, in Figure 5, the user noticed a negative value in the Net Pay column, and X’d it out. The Adjusted Gross also should not go negative, so the user X’d that negative value out too. Federal Income Tax is correct (10% for this amount of pay), so the user checked that value off to indicate its correctness. X’d out values add to the evidence of cells’ possible faultiness along the backward dynamic slice, and checked off values subtract from that evidence. (An early research version of this visualization scheme was presented in [26]. A visualization system for professional programmers based on similar reasoning is Tarantula [12].)
2. SOFTWARE VISUALIZATION FOR SPREADSHEET USERS To give a flavor of the kinds of visualizations the participant in our study had available and how she would need to trigger them, this section describes the tool’s visualizations. The tool we studied was a beta version of “Audit” [25], an interactive add-in to Excel. Through its collection of visualizations, it aims to help spreadsheet users find and correct faults (errors) in spreadsheet formulas. The tool has five visualizations: a visualization of regions to depict spreadsheet structure, two visualizations depicting the “approved” status of cells’ formulas, and two visualizations relating to suspected faultiness of cells’ formulas. Some of the visualizations are integrated into the spreadsheet itself and others are separate, located in a side panel. Consistent with the interactivity of the spreadsheet paradigm, all of the visualizations are “live”; that is, they update in real time, after each user action. The first visualization, shown in Figure 2, depicts regions. It is a low-cost visualization that is integrated into the main spreadsheet
Figure 4: Visualization #3: Stand-alone visualization of approved versus unapproved regions, located in the side panel.
136
interviewed office workers to understand their mental models of the workings of an AI program. This program displayed a visualization of its reasoning process as it attempted to predict and communicate their boss’s interruptibility. However no studies we have found to date have considered the combination of factors we investigate in the current paper: the adoption decision, by an enduser programmer, of a software visualization tool, by trying it out.
4. CASE STUDY METHODOLOGY
Figure 5: Visualization #4: Integrated visualization of fault localization. Shaded (yellow/orange) cells denote the backward slice of the X’d cell values. The darker the shading, the greater the estimated likelihood of a formula error.
Our investigation method was the case study, which is the right choice for investigating a contemporary set of events over which the investigator has little or no control [36].
4.1 Design Our “case” (situation) was an end user trying out an end-user software visualization tool. It was a single-case design, with the unit of analysis being an end-user programmer in this situation. The single-case design was of necessity: there exist only a few real-world software visualization tools for end-user programmers, and there were not many users available to evaluate the software visualization tool, so we could not replicate over either multiple participants or multiple tools.
Figure 6: Visualization #5: Stand-alone fault localization visualization, located in the side panel.
In controlled laboratory experiments, multiple participants increase “degrees of freedom.” The greater the degrees of freedom, the more confidence can be placed in numerical majorities, because sample size determines the number of chances for a conclusion to be refuted. In case studies, each “case” is the counterpart to an entire experiment [17], [36]. Thus counterparts to degrees of freedom (ways conclusions can be refuted) include the number of situations covered, the number of sources of evidence, the number of phenomena pattern-matched against theoretical predictions, and the number of rival theories considered.
There is also a stand-alone visualization of all cells suspected of faults in the “Fault Investigator” visualization in a side panel (Figure 6).
3. RELATED WORK Researchers have empirically evaluated software visualizations for people who are not end-user programmers. For example, several studies have empirically evaluated algorithm animations for students (e.g. [10], [11], [30]). Mulholland tested Prolog visualizations for students and discussed evaluation techniques for software visualizations generally [21]. However student programmers are a very different population than end-user programmers.
Our case study used the latter three of these. Our analysis and data collection were oriented toward triangulation—multiple sources of independent data. In addition, we pattern-matched all observed phenomena, doing so against five related but distinct theories.
There have also been several empirical studies of software visualization use by professional programmers. Lawrance et al. investigated the effects of test coverage visualizations on programmers’ testing behaviors [16]. O’Reilly et al. studied how a software engineering team used a “War Room” multi-monitor visualization of a large program [22]. Orso et al. tested their program execution trace visualization tool, by embedding it in another program they had developed and collecting and visualizing real-world usage [23], although here it was the researchers, not the users, interacting with the visualizations. DeLine et al. did a formative study of how professional programmers navigate through code, and used the results to design visualizations of wear-based filtering [6]. None of these studies dealt with tool adoption decisions, and, as with the above, also did not investigate end-user programmers.
4.2 Theoretical foundations The following foundations are applicable for making predictions as to how end-user programmers will make adoption decisions when trying out a software visualization tool: the Technology Acceptance Model and its successor (TAM, UTAUT) [20], [32], [34], [33], Minimalist Learning Theory [4], [5], the Attention Investment Model [1], and formative empirical work on information gaps for end-user debuggers [13], and learning barriers for novice programmers [15]. As Figure 7 illustrates, these theories have some degree of overlap with each other. We chose these five theories over others (such as Cognitive Dimensions [9]) because these five explicitly consider software features people do not know or are trying to learn, a critical aspect during the tryout period.
There was a regular workshop at ICSE from 2001-2004 on “Adoption-Centric Software Engineering,” with the theme of technology transfer and adoption of new software engineering tools. Lethbridge, for example, summarized results of several empirical studies of professional programmers, and proposed an adoption model that encompasses cost to use, benefit of use, and risk of use [18] (the same factors as in the Attention Investment model [1]). The workshop focused on tools for professional programmers, not enduser programmers.
The Technology Acceptance Model [20], [32], [34], which later evolved into the UTAUT Model [33], identified four conditions that together predict users’ behavior intention to use a technology: usefulness to job performance, difficulty of use, whether colleagues expect usage of the technology, and technical/organizational infrastructure encouraging use of the system. Since we are interested in adoption obstacles that occur within software and its related artifacts, we focus solely on usefulness and ease of use. (The factors are also modified by gender, age, experience, and whether usage is voluntary. Our participant’s
Other than our own prior work in evaluating a software visualization system for end-user programmers (e.g., [26]), the closest work we have been able to find is the work of Tullio et al. [31], who
137
participant’s decision-making, while Minimalist Learning theory does not. One contribution of this paper is to shed light on the extent to which each is applicable.
4.3 The participant Our participant was a female accountant. She was about 50 years of age and has used Excel for accounting purposes for over 18 years. She took a couple of classes on Cobol, Fortran and Machine Language in the 1970’s, and used Cobol for less than a year. Prior to our study, she had never seen, used, or read about Audit.
4.4 Data and procedures Our data came from seven sources. First, we used the tool ourselves, to gather data on alternatives available to the participant and how she would need to trigger them. Second, the vendor conducted a training session for potential users of the tool, which we observed, so that our data included what our participant had been taught. Figure 7: The relationships among theories used in this paper. (IG=information gap, LB=learning barrier).
Third, two observers observed the participant during the entirety of the time she spent trying out the software on her own work, which took place over 5 hours (with some interruptions). The participant notified us when she wanted to spend a block of time on her spreadsheets (with Audit turned on). In this way, we ensured that we were not rearranging her work priorities. Also, the observers brought “other work,” which the observers did whenever nothing was happening involving Excel or Audit, so that the participant would not feel pressured to spend more time on the tool than she otherwise would.
gender, age, and experience are described below, and her usage was voluntary.) Minimalist Learning Theory [4], [5] and the Attention Investment Model [1] both emphasize the trade-off decisions between ease of use and usefulness made by users in the course of using the tool. Minimalist Learning Theory predicts that, for users trying to accomplish a task, known as “active users” in that theory, learning (investments/costs, in Attention Investment) is counter to the goal of completing the task because it takes away time from the task itself. Yet, active users sometimes do choose to spend time learning, because taking the time to learn may pay off in getting the task done more quickly now or in future instances of it (benefits/payoffs, in Attention Investment). Thus, Minimalist Learning Theory emphasizes the task at hand in situations that require new learning of a tool, whereas Attention Investment more generally predicts users’ trade-off decisions in any kind of usage situation having to do with abstractions. Attention Investment also makes explicit the concept of a user’s perception of risks involved in taking an action with a tool, which is absent from the other theories.
Fourth, before the observation period, the participant filled out a background questionnaire. Fifth, after the observation period, we conducted a semi-structured interview with the participant, to gather her impressions of the tool and the obstacles she encountered. Sixth, we obtained the user-oriented documentation of the software, as a possible variable in the participant’s understanding of the tool. Finally, nine months later, we conducted a semistructured follow-up interview.
Information Gaps [13] Strategy Gap: “What should I do next?” Features/Feedback Gap: “What does this purple mean?” Self Judgment Gap: “I am stupid.” Big Information Gap: “Whoa! What’s going on?” Value/Formula Gap: “What should this formula be?” Learning Barriers [15] Design Barrier: “I don’t know what I want the computer to do” Selection Barrier: “I think I know what I want the computer to do, but I don’t know what to use” Coordination Barrier: “I think I know what things to use, but I don’t know how to make them work together” Use Barrier: “I think I know what to use, but I don’t know how to use it” Understanding Barrier: “I thought I knew what to use, but it didn’t do what I expected” Information Barrier: “I think I know why it didn’t do what I expected, but I don’t know how to check” New Code Misinterpretation – for example, thinking that Audit would accurately check the data ranges. Table 1: Obstacle code set with example quotes/situations (examples drawn from this study and from others).
The formative empirical works that also apply to this case are the information gaps faced by end-user debuggers of spreadsheets with little explicit training in how to do so in the presence of software visualization features [13], and learning barriers faced by novice programmers learning Visual Basic in a course [15]. The more specific and focused a theory, the easier it is to apply to all details within that focus, but the more it misses due to its narrow focus. As Figure 7 shows, the information gaps and learning barriers fall into TAM/UTAUT’s “ease of use”, which in turn falls within Attention Investment’s concept of costs/investments. This points out that these theories equip us with a sizable, detailed arsenal of ways to discover obstacles (absence of ease of use). It also points out that theory has not done as good a job at equipping us with ways of concretely identifying benefits or risks, pointing to these as open for additional research. These theories have similar philosophies, but have different emphases and are based on different assumptions of user motivations and interests. Thus, they do not always predict the same outcomes, and so are in some sense rivals. For example, Attention Investment predicts that the perception of risk will play a role in the
138
4.5 Analysis methodology
Still open (n=24) Value/Formula Gap 29% 57% Features/Feedback Gap 29% 71% Negative Self Judgment Gap 21% 60% Strategy Gap 17% 50% Big Information Gap 4% 100% Learning Barrier Type % of barriers Still open (n=12) Understanding Barrier 50% 83% Selection Barrier 33% 50% Information Barrier 17% 50% Design Barrier 0% N/A Coordination Barrier 0% N/A Use Barrier 0% N/A Other Obstacles % of other Still open (n=1) Misinterpretation 100% 100% Table 2: Breakdown of information gaps during observation session. Information Gap Type
For obstacles, we coded using Ko et al.’s code set on learning barriers [15], and Kissinger et al.’s code set on information gaps [13]. We chose to use both because Ko et al.’s covered the learning but not the “doing” situation, whereas Kissinger et al.’s was intended for the “active user” situation of Minimalist Learning, but was not detailed about the learning aspects per se. The final obstacle code set is given in Table 1. We then did an “open coding” pass, which produced codes to describe the contexts and details of various events that took place, which group as: (1) Strategies to overcome obstacles, e.g., online help, integrated help, documentation, colleagues, (2) Behaviors and reactions to software, e.g., curiosity, frustration, negative experience, positive experience, complimenting the software, (3) Type of work, e.g., manually verifying data, using features to verify data, (4) Features used, e.g., X-marks, checkmarks, etc., and (5) Interruptions, e.g., phone calls, email, colleague interruptions. The open coding pass also produced the new obstacles code Misconceptions. Our coding procedure was to divide the data (the observation and the interviews) into “paragraphs” (segments). Then two researchers applied the codes to a subset of the data and compared the results, and calculated agreement. Agreement calculation was measured by the ratio of intersection to union for the codes recorded for each segment (the same technique as used by [13]). After iterating on the code set and procedures until we reached an agreement of 91%, the code set was deemed robust, and one researcher coded the rest of the data.
% of gaps
Figure 8: Obstacles during observation session: Information gaps (blue/medium grey) were the most prevalent. Learning barriers: red/dark grey; Other/Misinterpretations: white.
5. RESULTS
use with the tool. The Strategy Gaps that did occur exactly coincided with Selection Barriers: i.e., her Strategy Gaps were about which of the new features to incorporate into her work. For example, when trying to get fault localization colors to appear, she said, “I remember in the presentation the antecedents would be shown…trying to remember how to do”.
5.1 Obstacles faced We first consider the obstacles that arose for the participant. The codes were not mutually exclusive, so some observations were given more than one code. Table 2 shows frequencies of each obstacle type, and how many of the obstacles were still open (unresolved) at the end of the observation. Figure 8 shows the proportions of the three categories of obstacle.
Finally, some gaps were not about the tool itself, but rather related to the tool’s ability to help solve her work problems. These were the information gaps about the correctness of values and formulas (Value/Formula Gaps) in the spreadsheet, such as when the participant asked herself, “Oh… Why would that be $5? ... Oh, right, that’s because she is…”. These gaps accounted for about a third of the information gaps.
Despite having attended a training session, the participant encountered problems relating to understanding some of the features. The Understanding Barrier accounted for nearly half of the learning barrier codes assigned. 62.5% of these co-occurred with Feature/Feedback Gaps, which were demonstrated in statements such as “I don’t understand why this shows a checkmark” during the observation period. In the interview, the learning barrier she mentioned most was also the Understanding Barrier, which corroborates our analysis of the observation session.
Implications For theory: The participant’s obstacles pattern-matched very well to the information gaps: all five of the information gaps were demonstrated. Only three of the learning barriers were seen in the observation part of the study, and since Selection Barrier duplicated Strategy Gap, only two learning barriers came into play as useful distinctions. Even so, the learning barriers add value even when they co-occur with information gaps, by implying the missing material that might help remove the obstacle in future versions of the system.
A related problem she had was that of getting information. Information Barriers occurred only when Understanding Barriers or Feature/Feedback Gaps were present. For example, we coded one quote as both Information Barrier and Understanding Barrier: “I am trying to put this formula from the other tab/sheet but somehow it throws me this error. And I don’t know if it’s because of Audit’s interaction or because of something with Excel.” She neither understood the error nor knew how to get further information about it.
For design: The distribution of information gaps and learning barriers points to the range of information categories that tool designers should consider when designing a software visualization tool’s explanatory affordances. One example of how to provide information to remove some of the obstacles is the explanations inherent in the WhyLine for Alice [14], which visually answers understanding barriers and information barriers by allowing users to ask the system “why” and “why not” questions about system
The Strategy Gap code accounted for only 18% of the gaps opened. This is not surprising, since the participant has had over 18 years to build up problem-solving strategies with spreadsheets. Further, the Audit training session explicitly taught strategies for
139
Implications
behavior. Another example is strategy hints in video snippets and hypertext [29], which target self-judgment and strategy gaps.
For theory: Minimalist Learning Theory and the Model of Attention Investment both pattern-matched well to our participant’s actions. Minimalist Learning theory predicts that an active user will be more willing to expend her attention when she believes the benefits will be related to her task, not merely to learning knowledge or skills. Attention Investment theory predicts perceived benefit as the only positive driver of an attention investment decision. Both of these predictions were borne out with this participant. The only problems she persevered with enough to solve were ones she perceived to be of direct benefit to her task.
5.2 In what circumstances were obstacles overcome? Table 2 shows that, in every category, most of the participant’s obstacles remained unresolved. But how did she overcome the obstacles she did manage to resolve? We analyzed the six situations in which she overcame obstacles, and identified two factors leading to success. The first factor was closeness to task. When the learning barrier or information gap was directly related to her task and the budget calculation problem that she was working on, she tried to resolve it. For example:
For design: Good news for designers of software visualization tools is the fact that the visual aspect of the fault localization benefits appeared to play a role in her pursuit of this benefit. Visible benefits mattered in a related study too, in which Ruthruff et al. demonstrated that even minor increases in a related visualization system’s visual benefits made a significant difference in not only participants’ understanding, but also their effectiveness [27].
“Wow, 5.5 million. I have last year budget’s figures.” (Trying to find a figure using find replace global search) “Weird formula…if you replace that with this, you should have nothing. Wow, that’s really screwy. Why does it keep doing that?”(She checked the data range for the cell, and fiddled with the cell options and then tried fixing the formula and finally fixed the formula)
5.3 Why were some obstacles not resolved? In all but one of the situations in which obstacles were never closed, the participant did not even try to close them—instead, she chose to work around them.
This constituted an Understanding Barrier, because the cell’s output was “weird” and she did not understand its behavior. It also included a Value/Formula Gap, since the formula and value raised questions as to whether they were correct. Third, it included an Information Barrier, because she did not know how to find out why it was giving her this feedback.
Ten situations accounted for the 24 obstacles that were left unresolved (since obstacles could co-occur). We found six reasons for the lack of resolution: invalid assumptions, staying on task, low perceived benefits, existence of manual workarounds, existence of (perceived) equivalent features, and improper problem specifications.
She resolved all three of these obstacles as she explored, figured out what could be wrong, and fixed the formula. Because she is an accountant and an experienced user of Excel, this problem may have seemed easy for her to resolve, which may be why she tried to fix it. But the fact remains that out of six situations in which obstacles were resolved, in four of them it was because the obstacle was closely tied to the task and values/formulas.
Invalid assumptions: In the course of the observation, the participant developed some misconceptions that were never corrected, which prevented her from resolving her obstacles. For example, at one point she started getting pop-up formula update errors from Excel. After scrutinizing the error message, then opening and closing the Help system (without reading anything), she finally decided that this was most likely caused by an interaction between Audit and Excel. She decided to restart Excel, believing that was the best way to resolve her problem.
The second factor leading to obstacle closure was the visibility of expected benefit. In Attention Investment terms, she expended attention when she perceived the benefits of overcoming the obstacles to be greater than the cost. This point also ties to Ko et al.’s reasoning as to why learners try to overcome barriers [15]. For example:
Ko et al. observed the same syndrome: “Learning barriers overcome with invalid assumptions often led to insurmountable barriers” [15]. Once formed, invalid assumptions can be surprisingly resistant to contradictory evidence [31]. Indeed, during the interviews, the participant reiterated her misinterpretations and said that any strategy other than restarting Excel would be her last resort. In addition, she added that she, as the user, does not have the responsibility to figure out why.
“Oh I see I am not paying attention here. The salary value…” (sifting through the list) “I remember in the presentation the antecedents would be shown…trying to remember how to do” (referring to the Dependent cells shaded by fault localization colors. She hovers over the question mark) “Ah here it is.” (She clicks on X, sees the fault localization colors) “That’s what I wanted.” (She places an X on another cell)
“I don’t know what it was doing. I was trying to edit and it wouldn’t let me and there were errors, I don’t understand. MS programs will behave odd every now and then and I just shut off and start again. In many cases you never really know why, maybe it was the interaction with Audit. Excel does these funny things. Excel was open for long so maybe that’s why.”
The fault localization colors seemed to have caught her attention during the training session. In that session, the demonstrator did a good job of talking about the benefits of the colors by contrasting them with Excel’s feature of tracking dependency through arrows. These benefits seemed quite motivating to her, and she pursued the feature in the face of obstacles to attain this benefit. The obstacles were a Strategy Gap and a Selection Barrier. To overcome them, she was willing to take time to explore. In the course of these explorations, when she hovered over the question mark [35], she clicked on it and tried the X-mark and got what she wanted, and the obstacles were overcome.
Interviewer: Was the problem resolved after you restarted Excel? “No, it didn’t, it won’t let me change the formula. But I left it for now. Excel was open for long and it usually fixes when you restart.” Interviewer: What if doesn’t fix after you restart? What would your ultimate solution be?
140
“Ultimate solution…I would probably open the documentation, then call the support people. Maybe it’s because of something they added to Audit… like these add-ons get touchy with Excel. After I shut it, I figured that might be the problem. But that’s your job to figure out (laughs) I am just the user, why should I figure out?” (Laughs) Similarly, she misinterpreted the checkmarks to work in an assertion-like fashion, checking the data ranges of the cells. We can imagine how this misinterpretation of hers could lead to further obstacles in the future and may cause negative experiences with the software, but this did not occur during our observation session. Staying on task: As Minimalist Learning Theory predicts for active users, there were instances in which she did not bother to understand feedback, instead ignoring it and concentrating on her task. As she stated in the interview segment above, she viewed some messages as problems for the software vendor, not as problems it would be her responsibility to pursue.
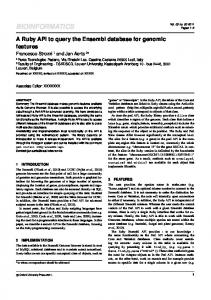
Figure 9: A source of confusion: checkmarks inside cells approve values, but “Approved” checkmark approves formulas for a region. values in cells, mistakenly assuming they were equivalent.
Low perceived benefits: Previously we pointed out that the participant figured out how to use X-marks in order to get the Fault Likelihood colors because of her perception of their benefits. But when she placed a couple of Xs, she placed them very “early” in the dataflow chain, which resulted in only a couple of cells being highlighted. She verbalized disappointment, expecting a long chain of highlights as seen in the training session. The benefits seemed not to be as great as she expected. After this disappointment, she did not see Xs as being worthy of the additional time it might take to figure out how to get the full range of fault likelihood colors, so she did not investigate further. However, she did use a lot of X-marks throughout the task, suggesting that she still saw enough benefit to use them, even if not enough benefit to invest time in learning how to use them better.
Improper problem specifications: There were also cases in which she gave up on the task for reasons unrelated to the software, such as when her boss asked her so vaguely for information that she was unable to produce useful results.
Implications For Theory: Three of the six situations above involved misperceived costs that were apparently derived from misconceptions, although we were not able to code most of them with the Misinterpretation code since the misinterpretations were not explicitly stated. Attention Investment and Minimalist Learning refer to perceived cost, benefit, and risk, and it is an important caveat in the use of these theories that the user may not merely misjudge the size of a benefit or cost, but may even base them on entirely invalid assumptions. Ko et al. also tie misconceptions tightly to learning barriers [15]. Our participant’s behavior suggests that misconceptions should play a part in models of adoption decisions that take into account the use of a free trial period.
Existence of manual workaround: This is probably a combination of “staying on task” and “low perceived benefits.” The participant sometimes expressed uncertainty about there being a better way to do things, but she did not try to investigate whether this was the case if she could perform the task manually. Hence with low perceived benefits and being an active user, having an immediate substitute caused her to not try. For example,
In four of the six situations, the participant chose not to resolve obstacles, instead working around them by disabling the tool or underutilizing its features. This behavior is predicted by Minimalist Learning and Attention Investment. She could do this easily, since the visualization’s functionalities were optional additions to a task she had been doing for years. None of the theories we considered are explicit about the extent to which optionality is a factor, which may be particularly relevant to software visualization adoption decisions.
(She was breaking up the spreadsheet by inserting columns. She cut a row and pasted at the top.) “At this point I am going to divide the whole sheet into different you know… like the deans, the departments and so on. I am just going to insert blank rows to do that, because I don’t know how else to structure it.” As the above excerpt shows, the participant was trying to structure the spreadsheet by manually copying and pasting rows and inserting blank rows. The most efficient way would have been to sort the respective column and then add in blank rows. Although she did use the Sort command often, she never thought of using it here. This also ties in with Bhavnani et al’s findings that even experienced users often fail to use the features and functionalities of a software tool effectively [2].
For design: Sometimes a simple change to the interaction devices can remove misconceptions. In this case, the participant’s misconception was rooted in two functionalities with similar interfaces: checkmarks both for values and for regions of formulas. We suspected that making the distinction explicit would eliminate the misconception, so we devised a small paper prototype replacing the cell checkmarks (main spreadsheet view) with a pop-up choice menu of two checkmarks side by side, one labeled with the cell’s value and the other with the beginning of the formula. In a small Wizard-of-Oz study, all five participants tested were able to explain the distinction.
Existence of (perceived) equivalent features: The participant did not understand the difference between the feedback she got from placing checks on cells, versus the feedback from approving formula regions via the side panel (also done with a check mark). She stated in the interview that she liked the feedback from approving formula regions (green borders) but did not like the checks on individual cells, as she found them to be “cluttered” (Figure 9). So she resorted to approving formulas in the side panel instead of
5.4 Would the documentation or integrated help system have helped? We have pointed out the participant’s behavior being consistent with the “active user” of Minimalist Learning Theory, who es-
141
chews learning for learning’s sake, but is sometimes willing to learn if doing so is expected to produce sizable benefits to the task at hand. As such, she made no use of the documentation provided with Audit.
explanations about how to use the visualizable information in problem solving about spreadsheet bugs, and results have been encouraging [29].
5.5 Effects of obstacles not closed
Might she have performed better had she attempted to use the documentation? We looked for answers in Audit’s and Excel’s documentation and integrated help for eight of the ten situations of unresolved obstacles (excluding the two that simply amounted to inadequate problem specifications).
What were the consequences of failing to overcome an obstacle? In the ten situations in which obstacles occurred that were never closed, we were able to identify three consequence patterns: (1) the participant resorting to manually doing the work, (2) no noticeable effect at all on the participant, and (3) the participant experiencing some combination of frustration, negative experiences, and software not meeting her expectations.
Only one of these eight problems might have been resolved with the documentation: her confusion regarding the difference between approving formulas and checking values.
Manual Alternatives: For 17% of the obstacles, she resorted to a manual way of accomplishing her goal, circumventing the need to use features or to dig out the problems’ causes. The example below featuring turning off Audit and subsequent brute-force search demonstrates this. This can be viewed as Attention Investment saving the situation. The participant did not see reasons to spend time investigating causes and effects, but simply found another way to get the job done.
In four of the eight situations, the answers to her obstacles were in the documentation, but the answers were unclear or non-explicit, so she probably would not have found them. For example, she was unsure of the meaning of the tooltip, “Medium chance of error”, on a cell colored orange for fault likelihood (Figure 10). Neither the training session nor the documentation explicitly states what orange colors mean or clarify that the highlights just show the probability of error, not guaranteed erroneous cells. The documentation uses inconsistent terminology surrounding the notion of “likelihood”. Some places use the word “suspicious”, others use the word “relevance”. Three more of the eight situations were outright absent from the documentation or Excel’s help system. For example, she had a misconception that restarting Excel would fix the messages on formula update error. We searched in Excel’s help system for “cannot update formula error” and got back 29 possible links, but we were unable to find the answer in them. For example, the link that seemed most relevant “find and correct errors in formulas” did not have what we wanted. It was about how to fix errors in formulas such as reference errors, but not about updating.
No Effect: For another 17% of the obstacles, she was able to continue her work despite the obstacle. For example, at one point she copied a formula to a range, and in some rows values appeared where she expected blanks: “Oh that’s interesting. Why would that happen?” (She deleted them) This was an obstacle she did not try to close. She simply deleted the mysterious values and moved on. Frustration: For 67% of the obstacles, failure to close them led to the software not meeting her expectations, which led to a pattern of frustration and negative experience. For example:
Implications
(Trying to edit a formula) “Why is it changing to D45? I want to edit this. Is there something that allows me to edit this? I’m having trouble, trouble”. (Turns off Audit completely, goes for brute force search and started editing formulas with the similar error of omitting $ signs)
For theory and design: These results suggest a useful synergy between information gaps and Minimalist Learning Theory with direct implications for design. Minimalist Learning Theory proposes organizing a help system around user tasks (as opposed to system features). Our results suggest that, in addition, a help system designer might choose documentation topics from the set of information gaps and learning barriers encountered in a user study or a Cognitive Walkthrough [19].
Here, the formula would not change no matter how many times she edited it. Understandably, this frustrated her. She attributed the problem to Audit, and turned it off to solve the problem, but doing so did not solve the problem (since Audit was not the cause after all). These obstacles remained unresolved.
Farkas adds a recommendation of layered help to Minimalist Learning Theory [7], to reduce the user’s attention cost of turning to a help system. “Layering” means providing a small explanation that is easily accessible plus links to more information for those who want to know more. We have tried out this idea in other work, adding to tooltips about visualizations, links to strategy
Misinterpretations often led to obstacles becoming insurmountable and hence to failed expectations, as in the case of believing that an Excel error was due to Audit. There was also a bona-fide problem with that beta version of Audit itself, in which it refused to function if a user inserted or deleted rows or columns. The participant needed this functionality, and running into this limitation led again to failed expectations: “Oh I can’t delete things as I am Auditing… that’s a serious problem for me isn’t it?” Failed expectations were the most serious of the events observed, culminating in her turning off Audit.
6. THE OUTCOME Our follow-up interview with the participant nine months later revealed that no explicit adoption decision had been made. The participant said she did not use Audit very much after the observa-
Figure 10: A message the participant did not understand.
142
tion period, because the free trial version expired. New versions became available to her, but she has not had time to install them. Her lack of use since that time can potentially be viewed as a “do not adopt” decision.
recording the session for later analysis. We took steps to mitigate this risk by being careful to have one interviewer make notes while the other interviewed, and completing our observation notes immediately after the session.
Given this lack of use combined with the obstacles we had observed, we were surprised when, asked if she were to explicitly decide yes or no, she enthusiastically stated that she would indeed choose to adopt Audit. Her reasons were tied to the perceived benefits of using it.
Signs that the participant had encountered an obstacle (e.g., signs of frustration) relied on observers’ interpretations, which can lead to errors. To guard against this threat, during content analysis, we were conservative about these measures, requiring explicit verbalizations or actions that suggested such mental states. In addition, investigator triangulation was used: both observers had to agree in order for such data to be included. We also used data triangulation, with the interviews, the documentation, and our prior use of the software as multiple sources of evidence of our interpretations. Finally, regarding generality, this case study used a single-case design, involving a single participant in a single situation. We do not claim generality to other participants or to other situations. However, the participant’s behaviors can still be viewed as evidence in a real-word setting that corroborates theory and foundational empirical results.
Specifically, she explained that the spreadsheet she created during the observation period was, in her words “extremely complicated,” but despite that, has turned out to be one she has relied upon heavily over the past year. She described “confidence” and “trust” in the spreadsheet (using the quoted words), to an extent she explained was unusual with such a complex spreadsheet. She attributes her degree of confidence and trust to having used the software visualization tool when she created that complex spreadsheet. Thus, from a TAM/UTAUT perspective, her intent to adopt the software visualization tool suggests that, in her case, usefulness outweighed the ease-of-use obstacles she encountered, which TAM/UTAUT links to intention to use. It is possible that her intention could be made stronger (increasing the likelihood of follow-through) via a change in the UTAUT “facilitating conditions” factor, e.g., someone in the technical support staff installing the software for her. Consistently with this, Attention investment predicts that whether she ultimately follows through to adopt the software visualization tool will depend on whether her perception of the benefits of using the tool and of the reduction of risk it brings will outweigh her perception of the time it will cost her to install it.
8. CONCLUSION In this case study, we have reported how an end-user programmer (an experienced accountant) went about deciding whether to adopt an end-user software visualization tool by trying it out on her own work. Although all five foundations were useful in understanding our participant, we found in particular that: • The most useful from a predictive standpoint was Minimalist Learning theory. Its notion of the “active user” captured our participant’s behavior in this tryout situation extremely well. Creators of end-user software visualization tools would do well to consider the focus of active users such as our participant, whose disinterest in learning per se was counteracted only when she saw direct relevance to the task at hand. • The most useful foundation for identifying obstacles was Information gaps; all five from Kissinger et al.’s list occurred in this case study. Learning barriers were less salient, but were still helpful in teasing apart factors in information gaps and also tended to be suggestive of possible solutions. Creators of end-user software visualization tools can benefit from the list of obstacles we derived from these foundations (Table 1) in predicting obstacles that could arise with their own tools at tryout time. • Our results also point to gaps in foundational guidance for understanding perceived benefits and risks at the same level of detail as information gaps and learning barriers provide for understanding perceived costs.
7. DISCUSSION AND THREATS TO VALIDITY As we have pointed out, the participant’s retrospective enthusiasm for the visualization tool was a surprise to us. The participant abandoned the tool behaviorally during the observation, yet later she expressed an enthusiastic desire to adopt it. One likely reason for this apparent contradiction may be an increase in perceived benefits due to the spreadsheet’s reliability over the passage of time. Revisiting Figure 7 also suggests another possible explanation. The “costs” bubble is well populated, and produced most of the codes for our analysis of obstacles quite successfully, but beyond our study’s scope of “obstacles”, there is less foundation. The “benefits” bubble is empty other than the TAM/UTAUT link, and we are not aware of a foundation that would provide the same level of details for benefits as are available for costs. The figure also suggests perceived risk as a possible blind spot. This points out gaps in the theoretical foundations for observational studies investigating perceptions of benefits and risks: theory does not provide concrete guidance on how one might codify these aspects.
Two results of particular pertinence to software visualization are the (advantageous) strong recollection by our participant of visual benefits, leading to subsequent persistent pursuit of those benefits, and the (disadvantageous) ease of abandoning visualizations when they were not seen to be useful—a route readily followed by our participant, perhaps because visualizations tend to be optional “add-ons” rather than core functionalities.
Focusing now on our study’s scope, namely to identify obstacles, we coded only what we could observe: what the participant did and said. As we have said, our tracking of obstacles was based on information gaps and learning barriers, which we found to be very useful due to their low-level specificity. Even so, this is not the only coding scheme possible, and other schemes might have yielded different results. Also, misconceptions, as we have pointed out earlier, may have been underestimated due to our reliance on the combination of information gaps and learning barriers.
Finally, our results enumerate specific troublesome obstacles that can arise during the trial period, helping creators of software visualization tools to anticipate and head off solve-or-abandon moments like this one: “Wow... that’s really screwy. Why does it keep doing that?”
ACKNOWLEDGMENTS
There is some risk that we missed significant events by not video-
We thank Pallavi Rajasekaran and Susan Wiedenbeck for their
143
contributions to this work. This study was supported in part by the EUSES Consortium via NSF ITR-0325273, and by an IBM International Faculty Award.
Systems, Apr. 1990. [20]Morris, M., Dillon, A., The influence of user perceptions on software utilization: Application and evaluation of a theoretical model of technology acceptance, IEEE Software, 14(4), 1997, 58-76. [21]Mulholland, P., Using a fine-grained comparative evaluation technique to understand and design software visualization tools, In Empirical Studies of Programmers, S. Wiedenbeck and J. Scholtz, Eds., ACM, 1997, 91-108. [22] O’Reilly, C., Bustard, D., Morrow, P., The war room command console: Shared visualizations for inclusive team coordination, ACM Symp. Software Visualization,2005, 57-65. [23] Orso, A., Jones, J., Harrold, M. J., Visualization of programexecution data for deployed software, ACM Symp. Software Visualization, 2003, 67-76. [24]Prabhakararao, S., Cook, C., Ruthruff, J., Creswick, E., Main, M., Durham, M., Burnett, M., Strategies and behaviors of enduser programmers with interactive fault localization. IEEE Symp. Human-Centric Computing Lang. and Environments, 2003, 15–22. [25]RedRover Software Audit, http://www.redroversoftware.com/products/audit [26]Ruthruff, J., Creswick, E., Burnett, M., Cook, C., Prabhakararao, S., Fisher II, M., Main, M., End-user software visualizations for vault localization, ACM Symp. Software Visualization, 2003, 123-132. [27]Ruthruff, J., Phalgune, A., Beckwith, L., Burnett, M., Cook, C., Rewarding good behavior: End-user debugging and rewards, IEEE Symp. Visual Lang. Human-Centric Computing, 2004, 69-71. [28]Scaffidi, C., Shaw, M., Myers, B., Estimating the numbers of end users and end user programmers, IEEE Symp. Visual Lang. Human-Centric Computing, 2005, 207-214. [29]Subrahmaniyan, N., Kissinger, C., Rector, K., Inman, D., Kaplan, J., Beckwith, L., Burnett, M., Explaining debugging strategies to end-user programmers, IEEE Symp. Visual Lang. Human-Centric Computing, 2007, 127-136. [30]Tudoreanu, M. E., Designing effective program visualization tools for reducing user’s cognitive effort, ACM Symp. Software Visualization, 2003, 105-114. [31]Tullio, J., Dey, A. K., Chalecki, J., Fogarty, J., How it works: a field study of non-technical users interacting with an intelligent system, ACM Conf. Human Factors Computing Systems,, 2007. [32]Venkatesh, V., Morris, M., Why don’t men ever stop to ask for directions? Gender, social influence, and their role in technology acceptance and usage behavior, MIS Quarterly, 24(1), 2000, 115-139. [33] Venkatesh, V., Morris, M. G., Davis, G. B. and Davis, F. D. User acceptance of information technology: Toward a unified view. MIS Quarterly 27, 3, 2003, 425-478. [34]Venkatesh, V., Determinants of perceived ease of use: Integrating control, intrinsic motivation, and emotion into the Technology Acceptance Model, Information Systems Research (11:4), 2000, 342-365. [35]Wilson, A., Burnett, M., Beckwith, L., Granatir, O., Casburn, L., Cook, C., Durham, M., Rothermel, G., Harnessing curiosity to increase correctness in end-user programming, ACM Conf. Human Factors Computing Systems, 2003, 305–312. [36]Yin, R., Case Study Research: Design and Methods, Sage Publications, 2003.
REFERENCES [1] Blackwell, A., First steps in programming: A rationale for attention investment models, IEEE Symp. Human-Centric Computer Langs. Envs., 2002, 2-10. [2] Bhavnani, S. K., John, B. E., From sufficient to efficient usage: An analysis of strategic knowledge, ACM Conf. Human Factors Computing Systems, 1997, 91-98. [3] Burnett, M., Cook, C., Rothermel, G., End-user software engineering, Comm. ACM, 2004, 53-58. [4] Carroll, J., Rosson, M., Paradox of the active user, In Interfacing Thought: Cognitive Aspects of Human-Computer Interaction, J. Carroll (Ed.), MIT Press, 1987. [5] Carroll, J. M. (Ed.), Minimalism Beyond the Nurnberg Funnel, MIT Press, 1998. [6]DeLine, R., Khella, A., Czerwinski, M., Robertson, G., Towards understanding programs through wear-based filtering, ACM Symp. Software Visualization, 183-192. [7]Farkas, D., Layering as a safety net for minimalist documentation, in Minimalism Beyond the Nurnberg Funnel, Carroll, J. M. (Ed.), MIT Press, 1998, 247-274. [8]Fisher, M., Rothermel, G., Creelan, T., Burnett, M., Scaling a dataflow testing methodology to the multiparadigm world of commercial spreadsheets, Int. Symp. Software Reliability Engineering, 2006, 13-22. [9]Green, T., Cognitive dimensions of notations, In People and Computers V., A. Sutcliffe and L. Macaulay (Eds.), Cambridge University Press, 1989, 443-460. [10]Grissom, S., McNally, M. F., Naps, T., Algorithm visualization in CS education: comparing levels of student engagement. ACM Symp. Software Visualization, 2003, 87-94. [11]Hundhausen, C. D., Brown, J. L., What You See Is What You Code: A “live” algorithm development and visualization environment for novice learners, J. Visual Lang. and Computing, 18, 1, Feb. 2007, 22-41. [12]Jones, J. A., Harrold, M. J., Stasko, J., Visualization of test information to assist fault localization, 24th Int. Conf. Software Engineering, 2002, 467-477. [13]Kissinger, C., Burnett, M., Stumpf, S., Subrahmaniyan, N., Beckwith, L., Yang, S., Rosson, M., Supporting end-user debugging: What do users want to know? Advanced Visual Interfaces, 2006, 135-142. [14]Ko, A., Myers, B., Designing the Whyline: A debugging interface for asking questions about program behavior, ACM Conf. Human Factors Computing Systems, 2004, 151-158. [15]Ko, A., Myers, B., Aung, H., Six learning barriers in end-user programming systems, IEEE Symp. Visual Lang. HumanCentric Computing, 2004, 199-206. [16]Lawrance, J., Clarke, S., Burnett, M., Rothermel, G., How well do professional developers test with code coverage visualizations? An empirical study, IEEE Symp. Visual Lang. Human-Centric Computing, 2005, 53-60. [17] Lee, A., A scientific methodology for MIS case studies, MIS Quarterly, 13, 1, 1989, 33-50. [18]Lethbridge, T., Value assessment by potential tool adopters: Towards a model that considers costs, benefits, and risks of adoption, 4th Int’l Wkshp. Adoption-Centric Software Engineering, 2004, 46-50. [19] C. Lewis, C., Polson, P., Wharton, C. and Rieman, J. Testing a walkthrough methodology for theory-based design of walkup-and-use interfaces. ACM Conf. Human Factors Computing
144