Journal of Universal Computer Science, vol. 16, no. 5 (2010), 800-820 submitted: 29/6/09, accepted: 12/2/10, appeared: 1/3/10 © J.UCS
SOM Clustering to Promote Interoperability of Directory Metadata: A Grid-Enabled Genetic Algorithm Approach Lei Li (Department of Management and Marketing D. Turner College of Business and Computer Science Columbus State University, Columbus, USA
[email protected])
Vijay K. Vaishnavi (Department of Computer Information Systems Georgia State University, Atlanta, USA
[email protected])
Art Vandenberg (Information Systems & Technology Georgia State University, Atlanta, USA
[email protected])
Abstract: Directories provide a general mechanism for describing resources and enabling information sharing within and across organizations. Directories must resolve differing structures and vocabularies in order to communicate effectively, and interoperability of the directories is becoming increasingly important. This study proposes an approach that integrates a genetic algorithm with a neural network based clustering algorithm - Self-Organizing Maps (SOM) - to systematically cluster directory metadata, highlight similar structures, recognize developing patterns of practice, and potentially promote homogeneity among the directories. The proposed approach utilizes the computing power of Grid infrastructure to improve system performance. The study also explores the feasibility of automating the SOM clustering process in a converging domain by incrementally building a stable SOM map with respect to an initial reference set. Empirical investigations were conducted on sets of Lightweight Directory Access Protocol (LDAP) directory metadata. The experimental results show that the proposed approach can effectively and efficiently cluster LDAP directory metadata at the level of domain experts and a stable SOM map can be created for a set of converging LDAP directory metadata. Keywords: Self-Organizing Maps, LDAP directory, Clustering Analysis, Genetic Algorithm, Grid, Reference Set. Categories: H.3.1, H.3.3, H.4.0, H.5.0
1
Introduction
Directories play an important role in describing resources and enabling information sharing within and among organizations [Hansen, Nohria et al., 1999]. Having the potential to consolidate important facets of organizational knowledge [Hansen, Nohria et al., 1999] [Tiwana and Ramesh, 2001], the appropriate use of directory services is recognized as a key to the competitive advantage of organizations
Li L., Vaishnavi V.K., Vandenberg A.: SOM Clustering to Promote Interoperability ...
801
[Hayward, Graff et al., 1999]. Directory services focus on information sharing within an organization and increasingly the dynamic coordination of inter-organizational resources. The appropriate use of information resources such as directory information is arguably a critical success factor for future business environments. LDAP (Lightweight Directory Access Protocol) directory services define metadata (schema) and access protocol for information resources of an organization. LDAP directory schemas are extensible and there exist no predefined schema categories. A good understanding of those LDAP schemas is essential to the interoperation of directories, yet such metadata often differ in their structures and vocabularies. Heterogeneity of directory metadata would be mitigated, trivially of course, if every directory followed a “standardized” directory schema. Such a universal standard schema is not available and, even so, the standards process is an evolving and deliberate process. The EDUCAUSE/Internet2 eduPerson Task Force spent a year to adopt 6 attributes for the initial “eduPerson” object – and the eduPerson object continues to expand. Moreover, a “static” standard is unlikely to keep pace with the ever-expanding descriptive requirements from different parties, such as directory administrators who may modify or expand a standard schema to meet their own local needs. In fact, the dynamic nature of directories is an important feature and value to dynamic organizations. Another solution to solve the heterogeneity problem is the use of “boundary objects” that provide mediation [Nikols, 2004]. This approach addresses the problem reactively, after the problem has been created, so heterogeneity remains a challenge and one is essentially committed to applying updates to keep pace with changes. One strategy proposed to extend directory services across organizations was through the use of a “directory of directories” [Gettes and Klingenstein, 2009]. This approach sought to replicate selected, standard attributes from underlying source directories into a master directory of index elements, enabling queries against this master directory. This approach proposed to address scalability problems in querying multiple directories by using a set of index elements. Directory Services Markup Language (DSML) [Tauber, Hay et al., 2009] enables the contents of directories to be published as XML documents. However, DSML provides only a specification for the translation of directory information into XML, and does not itself address the heterogeneity of various directories. In general, these approaches to directory interoperability have various limitations: they address the problem after the fact, may take too long, or lack flexibility in addressing the underlying directory heterogeneity problem. Liang et al. [Liang, Vaishnavi et al., 2006] propose an alternative proactive approach for facilitating the interoperability of directory metadata by clustering using Self-Organizing Maps (SOM) [Kohonen, 2001] and visualization of directory metadata. Although in principle this approach is promising, it suffers from being ad hoc, requiring human intervention and having performance issues that limit its ability to handle data sets of realistic size. The approach proposed in this paper innovatively integrates a neural-networkbased Self-Organizing Map (SOM) [Kohonen, 2001], a genetic algorithm (GA) [Holland, 1992], and grid computing infrastructure [Foster and Kesselman, 1999] to organize directory metadata, facilitate identification of points of interoperability, and promote increased potential homogeneity among directories
802
Li L., Vaishnavi V.K., Vandenberg A.: SOM Clustering to Promote Interoperability ...
The rest of the paper is organized as follows. Section 2 discusses clustering LDAP directory metadata using SOM. Section 3 introduces the research approach. Section 4 describes the research prototype. Section 5 presents an empirical study and results. Section 6 concludes the paper and discusses future work.
2
Clustering LDAP Directory Metadata Using SOM
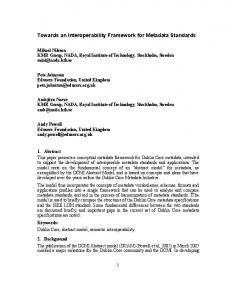
Clustering analysis is a widely used approach for structuring previously unknown and unclassified datasets [Nürnberger, 2001]. Clustering analysis is effective where little prior information is available about the data and the decision-maker can make few assumptions about the data. Since LDAP directory schemas (metadata) are extensible and there exist no predefined schema categories, it is appropriate to use techniques to understand schema relationships. As a neural network based algorithm, SOM is neural network based algorithm that produces a similarity map of input data. As illustrated in Figure 1 (adapted from [Liang, Vaishnavi et al., 2006]), the input objects and the nodes in the mapping grid are represented as vectors that contain the input features. The mapping vectors are initialized with random numbers. Each input vector is compared with each vector on the mapping grid. The mapping vector that has the shortest Euclidean distance from the input vector is claimed as the “winning” vector. The input vector thus maps to a mapping vector. The value of the mapping vector is then adjusted to reduce the distance and its neighboring vectors may be adjusted proportionally. After all input vectors are processed, the multi-dimensional input vectors are mapped to a twodimensional output map. SOM compresses information while preserving the most important topological and geometric relationships of the primary data elements on the display which make it possible to visually identify the clusters from the map [Liang, Vaishnavi et al., 2006]. Researchers have already compared SOM with several other clustering algorithms. Mangiameli compared SOM and seven hierarchical clustering methods experimentally and found SOM superior to all of the hierarchical clustering methods [Mangiameli, Chen et al., 1996]. Zhao and Ram compared K-means, hierarchical clustering and SOM for clustering relational database attributes and concluded that the three methods have similar clustering performance while SOM is better than Kmeans or hierarchical clustering in visualizing clustering results [Zhao and Ram, 2004]. This research focuses on clustering LDAP directory metadata and presenting results to users in a cognitively meaningful way. The SOM algorithm seems to be an appropriate clustering algorithm for the proposed approach of facilitating directory interoperability.
Li L., Vaishnavi V.K., Vandenberg A.: SOM Clustering to Promote Interoperability ...
803
[ x11 x12 ... x1n ]−−[ xm1 xm 2 ... xmn ] Input vector of m objects with n features Kohonen output vector = two dimensions (3x3)
Distance
[ y111 y112...y11n ]
[ y211 y212...y21n ]
[ y321 y322 ...y32 n ]
[ y121 y122...y12 n ] Winner [ y221 y222...y22 n ]
[ y321 y322...y32 n ]
[ y131 y132...y13n ]
[ y231 y232...y23n ]
[ y331 y332 ... y33n ]
Figure 1: Kohonen SOM network topology (Adapted from [Liang, Vaishnavi et al., 2006]). SOM produces a topologically relevant mapping between input and output spaces using the Kohonen learning rule that is sensitive to parameter values. A poor choice of parameter values results in a mapping that may not be topologically meaningful to its users [McInerney and Dhawan, 1994]. Given that a main strength of SOM is its support of topology visualization [Kostiainen and Lampinen, 2000], SOM parameter values selection is an important factor in generating resulting maps. Researchers have to use different SOM parameter values in different application domains [Polani and Uthmann, 1993; Kiang, Kulkarni et al., 1995; Mangiameli, Chen et al., 1996] and such selection process is typically application driven and ad hoc [Kohonen, Kaski et al., 2000]. Liang et al. [Liang, Vaishnavi et al., 2006] evaluated effectiveness of SOM clustering on LDAP directory metadata. They used linear search to identify a set of SOM parameter values that can produce good clustering performance by manually selecting and evaluating 320 SOM parameter values sets. The experimental results alone indicated that SOM clustering of directory metadata could produce outcomes comparable to those of domain experts [Liang, Vaishnavi et al., 2006]. While the results from Liang et al. are promising, there are some limitations: 1) SOM parameter values selection process using linear search is ad hoc and requires significant human intervention; and 2) processing time for searching SOM parameter values is long – it can take hours to run even on a powerful PC since candidate SOM parameter value sets usually have a huge search space (there may be millions of combinatorial sets). Those limitations lead to the research questions for this paper: For the LDAP directory metadata domain, can SOM parameter values that produce clustering comparable to that of human experts be discovered in a systematic manner? Will the systematically derived SOM parameter values have equivalent or better performance than the SOM parameter values generated by linear search?
804
Li L., Vaishnavi V.K., Vandenberg A.: SOM Clustering to Promote Interoperability ...
Can the running time of the proposed system be reduced to a reasonable level? Under what conditions can the SOM clustering process be automated such that it reduces the requirement for human expert mediation?
3
Research Approach
This paper proposes a systematic approach for effective and efficient SOM clustering of LDAP directory metadata that integrates the application of a genetic algorithm (GA) to discover SOM parameters, the use of reference sets to guide GA convergence, the application of grid infrastructure for performance, and the creation of stable reference sets for automated discovery of GA and SOM solutions. Being effective means that the proposed system can generate directory metadata clusters that are comparable to the ones created by domain experts. Being efficient means that the proposed system should be able to process directory metadata in a reasonable amount of time. Because of selection of SOM parameter values is critical to the SOM clustering performance, this research integrates a genetic algorithm with SOM to systematically search for near-optimal SOM parameter values sets instead of relying on the ad-hoc linear search approach. This study applies computing power of a grid infrastructure to improve the performance of the system since both GA and SOM are computationally intensive. As a neural-network based clustering algorithm, SOM requires training before it can process the dataset. This paper studies the feasibility of automating SOM clustering process in a converging domain (where datasets in the domain have a large portion of overlaps) by incrementally creating a stable SOM map with respect to an initial reference set. As illustrated in Figure 2, the proposed approach has three layers: genetic algorithm, grid, and data layers.
Figure 2: Grid-Enabled Genetic Algorithm Approach for Systematic SOM Clustering Genetic Algorithm Layer. SOM parameter values have a significant impact on SOM clustering performance and the search space for SOM parameter values is often prohibitively large. A genetic algorithm, that can explore a large search space to reach
Li L., Vaishnavi V.K., Vandenberg A.: SOM Clustering to Promote Interoperability ...
805
a global optimum solution while avoiding combinatorial explosion, is used to systematically find a good set of SOM parameter values. The genetic algorithm first randomly spawns a population of SOM parameter values and each value set is sent to a SOM clustering engine. Each clustering result is evaluated against a reference set (in this case created by domain experts manually clustering the dataset). The SOM parameter values generation, clustering, and evaluation process is repeated until the termination condition of the genetic algorithm is met. The final output is a SOM map. Genetic algorithms and SOM are discussed in detail below. Grid Layer. Genetic algorithms and SOM both are computationally intensive. Processing time can become a bottleneck for the proposed approach if a single run can take hours on a single PC. The computing power of a grid computing infrastructure is used to offset this limitation. As a type of parallel algorithm, grid computing [Foster and Kesselman, 1999] provides enormous computation and resource sharing capability as well as a user level abstraction in accessing the computation resources (e.g., many networked computers). Grid technology is suitable for the genetic algorithm approach since the GA task can be divided into subtasks where no communication is required among these subtasks (each SOM run is an independent sub-task). Data Layer. The data layer contains raw data that needs to be clustered. In this study, the raw data initially was manually clustered by domain experts to produce a reference set that is used to guide the clustering process. Such a reference set could be one expert’s clustering result or a consensus set of several experts’ clustering results. The genetic algorithm layer generates the SOM map. Once the SOM map is generated, new data may be projected onto the map (without first being included in training the map). This paper addresses the feasibility of automating the proposed approach (toward potentially reducing the intervention of domain experts). Further, this paper argues that in a converging domain (where different data sets have a significant portion of overlap), a stable SOM map can be created by incrementally adjusting an initial reference set such that the resulting map can be used to project (map) data that did not itself directly participate in the training of the map. 3.1
Genetic Algorithms and SOM
Introduced by John Holland in the 1970s, a genetic algorithm enables computer programs to “evolve” in ways that resemble the natural selection process, characterized by crossbreeding, mutation and survival of the fittest. A GA makes it possible to explore a far greater range of potential solutions to a problem than do conventional programs [Holland, 1992]. Compared to traditional search algorithms, a genetic algorithm is able to automatically acquire and accumulate the implicit knowledge about the search space during its search process, and self-adaptively control the search process through a random optimization technique. It often yields a globally optimal solution and avoids combinatorial explosion by disregarding certain parts of the search space [Wu, Iyengar et al., 2004]. GA has been applied to artificial neural networks (NN) [Polani and Uthmann, 1993] [Polani, 1999]. The appeal of combining GA and neural network based SOM arises from the expectation that GA might provide a systematic (automated) approach for discovering “optimal” SOM parameter values in the large space of network structures. A second motivation is the biological roots that both paradigms share
806
Li L., Vaishnavi V.K., Vandenberg A.: SOM Clustering to Promote Interoperability ...
[Polani, 1999]. Polani and Uthmann’s research has successfully applied genetic algorithms to improve the topology of a Kohonen feature map [Polani and Uthmann, 1993]. The research reported in this paper couples GA and SOM to systematically search for good SOM parameter values. Two important decisions that need to be addressed before successfully applying GA are: 1) Fitness function so that GA can determine whether a given clustering result is good or not; and 2) Genetic coding such that SOM parameters are mapped into the GA’s “genomes.” 3.2
Fitness Measurement for SOM Clustering Result
This research uses four widely accepted metrics to evaluate computer clustering performance: cluster error (CE), normalized cluster error (NCE), cluster recall (CR) and cluster precision (CP). Their definitions are adapted from [Roussinov and Chen, 1999]: total number of incorrect and missed associations CE = total number of possible pairs of object classes NCE =
total number of incorrect and missed associations total number of associations existing in both partitions
CR=
total number of correct associatio ns in computer partition total number of associatio ns in manual partition
CP=
total number of correct associatio ns in computer partition total number of associatio ns in computer partition
Note on terms: 1) Manual partition is a clustering partition created by domain experts. 2) Computer partition is a clustering partition created by a computer. 3) Association is a pair of LDAP objects belonging to the same cluster. 4) Correct associations are associations that appear in both the computer partition and the manual partition. 5) Incorrect associations are associations existing in the computer partition but not in the manual partition. 6) Missed associations - associations existing in the manual partition but not in the computer partition. The overall clustering performance is measured by F-measure value [VanRijsbergen, 1979] [Larsen and Aone, 1999] [Stein and Eissen, 2002]. F-measure, a formula for the combined effect of CP and CR, is a standard evaluation metric in the field of information retrieval: 2 * CR * CP F − measure = CP + CR 3.3
Genetic Encoding of SOM Parameter Values
The process that maps an algorithm’s parameter values to individual “genomes” of a genetic algorithm is called genetic encoding. The robustness of a genetic encoding is assured by meeting a minimum of three encoding criteria: completeness, soundness, and non-redundancy [Goldberg, 1989]. Following the approach used in [Liang, Vaishnavi et al., 2006], four SOM parameter values are varied: xdim, ydim, neighborhood size, and number of final training iterations. The genetic genome is composed of those four parameter values, satisfying (reasonable) completeness and
Li L., Vaishnavi V.K., Vandenberg A.: SOM Clustering to Promote Interoperability ...
807
soundness for genetic encoding since the values of these parameters have important impact on SOM clustering performance. Moreover, xdim, ydim, neighborhood size, and final training iteration are independent parameters according to SOM theory, so assuring non-redundancy. In summary, the genome encoding is robust. The value range for each parameter must be determined. On the one hand, varying the parameter values in a wide range ensures a more complete search space. On the other hand, the range cannot be unreasonably large because GA is very computationally intensive. There is some theoretical guidance for selecting SOM parameter value ranges. According to [Kohonen, Kaski et al., 2000], the SOM map ought to be rather more rectangular than square and the initial neighborhood size should be nearly the size of the SOM map itself. The effectiveness and efficiency of the SOM map partially depends on how many clusters it forms. With too many clusters on the map, users will expend too much time locating desired clusters. With too few clusters on the map, users might get low cluster precision. Guided by these considerations, xdim and ydim values range from 2 to 12 and neighborhood size values range from 2 to 10. Many researchers [Kiang, Kulkarni et al., 1995] [Mangiameli, Chen et al., 1996] suggest typical training iterations of about 20,000, thus the number of final training iterations ranges from 5,000 to 50,000. 3.4
Implementation of GA
There are two types of GA: generational (simple) GA and steady-state GA. Generational replaces the whole generation when performing the selection operation for the next generation. For steady-state GA, the generations will have overlap. This research uses the steady-state GA due to its possible performance advantage over generational GA [Rogers and Prugel-Bennet, 1999]. The following describes the genetic operators, the GA parameter selection, and execution of the GA. Selection operation. The selection operation decides which individuals from the current generation will have their genomes carried on to next generation. The fitness (F-measure value) is computed for every individual’s genome in the population. The higher the fitness (i.e. SOM clustering result as compared to the human expert), the better chance an individual is selected for the next generation. Replacement probability defines what percentage of the population will be carried on to the next generation. Low replacement probability can increase the GA’s capability to search a new solution space. It is set to 10% in this implementation. Each generation has the same population size (set to 120 as noted below). Crossover operation. The crossover operation mimics the gene recombination of biological evolution. Crossover schemes such as one-point crossover, two-point crossover, and multi-point crossover have been used in genetic algorithms. In this implementation, the most commonly used crossover method - single point crossover, was applied. Participants in crossover are probabilistically selected from the population and the crossover points are selected randomly. Crossover is a predominant operation in a genetic algorithm. A high crossover probability is preferable so that the GA extends its search space, exploring more solutions. The crossover probability is set to 0.8 in this implementation. Mutation operation. The mutation operator makes random changes on some individuals of the each generation. It causes a generation to jump outside a local
808
Li L., Vaishnavi V.K., Vandenberg A.: SOM Clustering to Promote Interoperability ...
optimum and thus to maintain the variety of the overall population genome. To perform the mutation operation, a mutation point is randomly selected. The value at that point is replaced by a random value in the range of the corresponding parameter. Mutation can extend the GA’s search space. However, frequent use of the mutation operation may make the Genetic Algorithm conduct a random search. So, a small mutation probability is preferred. It is 0.08 in this implementation. GA Parameters Selection. GA parameters include probabilities of genetic operations, population size, generation number, and other details of the run. Probabilities of genetic operations (selection, crossover, mutation) were discussed above. Another important control parameter is the population size. Usually a population size is chosen that will produce a reasonably large number of individuals across all generations before terminating. Population size is set to 120 in this implementation. A convergence indicator (similarity of best fitness value F-measure between adjacent generations) is used as the termination condition. The convergence indicator is set to reasonably large value (0.99) to make sure that the GA becomes steady and has finally discovered a reasonably good result. Our guideline for selecting GA parameter values is to let GA explore very large problem space and find the best solution possible. The GA parameter values used in this research are based on results of several test runs. Execution of GA. The GA starts with a randomly generated initial population of genomes (individuals). The GA decodes each genome (converts them into corresponding SOM parameter values), uses the values to run the SOM algorithm, and then calculates the fitness function value (F-measure value) by comparing the SOM clustering result of each individual genome to each domain expert’s clustering result and then taking the mean. When all the populations’ genomes are evaluated, the GA tests whether the termination condition is met (e.g., is the F-measure value of the current generation compared to previous generation smaller than the preset threshold value?). If so, the best genome from the population is selected and the program ends. Otherwise, the GA performs selection, crossover, or mutation operations to create a new population for the next generation. This process of generating a new population, running SOM, calculating fitness, and evaluating the termination condition is repeated until the termination condition is met. GA convergence is an important issue. We don't want GA to run indefinitely. We use a large population size and a small mutation probability to facilitate GA convergence. If GA reaches a preset generation limit and still can't converge, the program will stop and the current best genome is used as output. For the LDAP metadata data used in this study, GA always converges.
4
Research Prototype
A preliminary research prototype has been developed to evaluate the proposed approach. It uses components of a previously developed prototype system, Semantic FacilitatorTM SM [Vandenberg, Liang et al., 2002], as the clustering engine. The Semantic FacilitatorTM SM for this paper is implemented in a Windows environment using Java Servlets and Kohonen SOM code packages [Kohonen, Hynninen et al., 1995] [Liang, Vaishnavi et al., 2006]. The Semantic FacilitatorTM SM can select LDAP
Li L., Vaishnavi V.K., Vandenberg A.: SOM Clustering to Promote Interoperability ...
809
directory schemas from a backend relational database, cluster the object classes, and present the results graphically to the user. The genetic algorithm component of the prototype is based on the GAlib code package – a C++ library of Genetic Algorithm Components [GAlib, 2005]. The research prototype also adds a grid computing infrastructure for the genetic algorithm (subtasks execute in parallel across grid nodes). The Grid used in this research prototype is a small-scaled in-house Grid implementation that contains 13 nodes (each Grid node is a Dell PC with 933 MHz CPU and 512 MB RAM). Globus Toolkit TM [GlobusAlliance, 2005], built on the Open Grid Services Architecture (OGSA) open source software, is used for a higher level of resource management services (e.g., sharing computational and other resources without sacrificing local autonomy). PBS Pro is used to make the Grid system call for submitting tasks to Grid nodes, scheduling the tasks for running, executing tasks, and collecting the results. The task distribution and result integration function are Java programs that use Linux bash shell script to run corresponding PBS Pro commands. The program flow of the research prototype is showed in Figure 3. At the control node, GA generates its first generation of genomes. Each genome is decoded into a set of SOM parameter values and a Grid task is created. The Grid job is then submitted to a Grid node through PBS Pro. The Grid node executes the task by running SOM using the parameter values in the task file and the running result (Fmeasure) is sent back to the control node. GA waits until all tasks are finished. GA then evaluates if the convergence condition is met. If yes, the SOM parameter values are identified and the system ends. If no, GA generates a new generation. The process of creating a Grid job, submitting the job, collecting results and checking for the convergence condition are repeated for each generation until the GA converges.
810
Li L., Vaishnavi V.K., Vandenberg A.: SOM Clustering to Promote Interoperability ...
Generate first population Decode genomes and create grid tasks Dispatch grid tasks to grid nodes
Execute SOM clustering program
Execute SOM clustering program
Execute SOM clustering program
...
Collect results from grid nodes Yes
Termination condition met?
Find best SOM parameter values
No
t
Generate a new population Figure 3: Research Prototype Program Flow
5 5.1
Experiments and Results Research Goals
Parameter values selection is critical to the performance of the SOM algorithm. Due to the heuristic origins of SOM, its parameter values are typically chosen in an ad hoc manner. Liang et al. [Liang, Vaishnavi et al., 2006] used a linear search method to find the best of 320 pre-defined parameter value sets. This paper suggests that a GAbased approach can systematically identify good parameter values for SOM clustering, where “good” is defined as parameter values achieving clustering results comparable to that of human experts. This suggests the following two research goals (RGs): RG1: For LDAP directory metadata, the GA-based approach can find a set of SOM parameter values whose clustering performance is comparable to the clustering done by human experts. RG2: The GA-generated SOM parameter values set can have equal or better clustering performance than the performance of a SOM parameter values set discovered by a linear search.
Li L., Vaishnavi V.K., Vandenberg A.: SOM Clustering to Promote Interoperability ...
811
It is important that the GA generated SOM map not only work on one directory data but also other directories. Since SOM is a neural network based technique, it is reasonable to expect that the SOM map discovered for clustering one directory’s data will perform as well for another directory with somewhat similar structure. This leads to research goal 3: RG3: The SOM Map generated from one LDAP directory can continue to perform well on another LDAP directory that has a similar structure. Genetic algorithms and SOM are both computationally intensive. It’s desirable that the clustering can be done in a reasonably short period of time in order to make the approach practical. This research applies grid techniques to provide computing power and this leads to research goal 4: RG4: The proposed system running on grid computing infrastructure can require less processing time than the system running on a single PC. To make the proposed approach practical and useful, human intervention needs to be reduced. Yet, in order to validate SOM clustering results, domain experts may be needed initially to cluster LDAP directory metadata and establish a “correct answer” where no pre-defined standard answer exists. The experts’ clustering results (also called reference set) may then be used to guide the GA to select appropriate SOM parameter values. Clearly, it isn’t practical to ask human experts to manually cluster each directory’s metadata. This paper describes initial steps towards this full automation. It is posited that there exists a stable SOM map for a converging domain; e.g., a group of LDAP directory metadata with similar structure are considered a converging application domain. In this situation, by incrementally adjusting a reference set as more directory metadata is added, a stable SOM map can be created and such map can be used to cluster an unknown dataset that has similar structure. Hence, the fifth research goal is: RG5: For a converging LDAP directory application domain, it is possible to generate a stable SOM map that will cluster unknown LDAP metadata from the same domain. 5.2
Experiment Design
Three experiments were designed and conducted to evaluate the achievement of the research goals. Experiment 1 evaluates if the proposed approach can systematically identify appropriate SOM parameter values (Research goals 1 and 2) and if the generated SOM map can be applied to another directory that has similar structure (Research goal 3). Experiment 2 examines if grid computing can reduce the processing time of the proposed approach (Research goal 4). Experiment 3 evaluates if a stable SOM map can be generated for a set of converging LDAP directory metadata (Research goal 5). Experts on LDAP directories participated to the extent of manually clustering LDAP directory objects classes that are used as an initial reference set to evaluate the computer clustering result. Following are details of each of the experiment designs. 5.2.1
Selection of Experimental Data
Several major LDAP directory products are: Sun iPlanet, Novell eDirectory, Microsoft Active Directory, IBM SecureWay, and OpenLDAP. Although these
812
Li L., Vaishnavi V.K., Vandenberg A.: SOM Clustering to Promote Interoperability ...
directories have variations in schema objects, they all conform to LDAP directory standards for schema definition. For example, each directory object class has attributes for OID (object identifier – unique identifier), NAME, MUST, MAY, and SUP (superior – an attribute indicating inheritance from another object). As long as we use these directory schema standard attributes in the SOM application, the experimental results will generally be applicable to all LDAP directories. We chose object class metadata from instances of Sun iPlanet directories as the experimental data in this work. The experiment data includes instances of two publicly available iPlanet LDAP directory schemas (metadata): Directory 1 and Directory 2. Directory 1 has 191 iPlanet object classes and Directory 2 has 212 iPlanet object classes. The object classes in these two directories have overlap with 182 objects being the same (see Table 1). The object classes in Directory 1 were randomly divided into two groups. The first group, with two thirds of the object classes (128 object classes), is called Data Source A. This dataset is the same as the one used in a prior study [Liang, 2006], thus the results of prior study [Liang, 2006] and this research can be compared. The other group with one third of the object classes (63 object classes), called Data Source B, is used as testing data (holdout data) in Experiment 3. Directory 2, which is called Data Source C, is used in Experiment 1 as testing data (new directory) and in Experiment 3 as raw data to build a SOM map. Table 1: Characteristics of two directories’ metadata Source Directory 1 Directory 2 5.2.2
Number of object classes 191 212
Overlapped object classes 182 182
Choosing Experts
To evaluate the effectiveness SOM clustering performance, we compared computer generated SOM clustering to the clustering of human experts. We defined human experts as directory administrators or researchers who work with directory object class schemas frequently, with 6 months to 3 years of experience using LDAP directory object classes. In the experiments, the experts worked independently with no time constraint on when the task should be accomplished, though they typically finished the tasks within a week. Six experts participated in the experiments. 5.2.3
Experiment Procedures
Experiment 1 was conducted to evaluate the clustering performance of the proposed approach. Data sources A and C were used as training and testing dataset respectively. Data source A was first clustered using the proposed approach and its clustering result was evaluated and compared with results from a related research [Liang, 2006]. The SOM map generated from Data Source A was then used to map a different data set (Data source C) to further test validity of the approach. Experiment 2 was designed to validate the effectiveness of grid infrastructure. Using data source A as dataset, the proposed approach ran on a stand-alone PC first
Li L., Vaishnavi V.K., Vandenberg A.: SOM Clustering to Promote Interoperability ...
813
and then ran on a grid computing infrastructure with the same initial configuration. The processing time for the two runs was recorded and compared. Experiment 3 was to test if a stable SOM map can be evolved using all three data sources. A SOM map was first generated using data source A as the training data. The experiment used, as the initial reference set, a consensus set of expert clustering of Data Source A objects. Such a consensus set contains the clusters of the data source that all experts agree on. The SOM resulting map was then tested for mapping Data Source B. The experiment then revised the initial reference set, adding to it the consensus set of expert clustering of Data Source C objects. The SOM map was regenerated using this revised reference set. The updated SOM map for the union of data sets, A and C, was tested on Data Source B again. The experiment procedures are summarized in Table 2. Table 2: Experiments Procedure ExperiData Source Involved ment No. 1 Data source A (training dataset) Data source B (testing dataset) 2 Data source A 3
Data source A & C (training dataset) Data source B (testing dataset)
5.3
Research goals Evaluated Research goals 1, 2 and 3 Research goal 4
Reference Set Used Each expert’s results Each expert’s results Research goal 5 Experts’ Consensus
Grid Used? No Yes No
Experiment Results and Analysis
5.3.1
Analysis of Experts’ Clustering Results
Domain experts clustered directory objects for the experiments (6 for Directory 1 and 6 for Directory 2; 3 experts clustered both Directories). To establish a composite reference set, the results of the human experts were analyzed. Each expert’s clustering result was compared with the clustering outcome of each of the five other experts on Data Source A. The metrics of comparison were cluster error (CE), normalized cluster error (NCE), cluster recall (CR) and cluster precision (CP). For CE and NCE, there are 15 comparisons (note that Expert 1 versus Expert 2 is the same as Expert 2 versus Expert 1). For CR and CP, there are 30 comparisons (Expert 1 versus Expert 2 is different from Expert 2 versus Expert 1). For each measurement, the mean and standard deviation were calculated. The results are listed in Table 3. Table 3: Mean and Standard Deviations of Experts Results on Data Source A Metrics Data Set Data Source A
CE Mean Std.
NCE Mean Std.
Mean
0.138
0.618
0.520
0.114
0.207
CR Std. 0.280
Mean 0.520
CP Std. 0.280
814
Li L., Vaishnavi V.K., Vandenberg A.: SOM Clustering to Promote Interoperability ...
There was considerable variation in the clusters obtained by the experts for this dataset and so it is difficult to choose one “representative expert” on clusters. Therefore each expert is treated as an individual reference case when evaluating the computer generated clusters. Then a statistical mean and variance of the results from the human experts were calculated and used to represent their collective results. 5.3.2
Related Experiment Results
A related research [Liang, Vaishnavi et al., 2006] used a linear search to discover the best SOM parameter values from 320 permutations of parameter values sets. Each of the 320 permutation results was compared with the result of each of six human experts and the best result of the 320 permutations is shown in Table 4. These data served as a comparison base for the GA-based approach. Table 4: Performance Metrics for Linear Search (Data Source A) – Best Result of 320 Permutations [Liang, Vaishnavi et al., 2006] Metri CE
Expert 1 0.040
Expert 2 0.034
Expert 3 0.040
Expert 4 0.034
Expert 5 0.290
Expert 6 0.124
Mean 0.094
NCE
0.471
0.571
0.501
0.465
0.837
0.708
0.592
CR
0.496
0.650
0.497
0.594
0.092
0.189
0.420
CP
0.566
0.320
0.502
0.486
0.708
0.637
0.537
5.3.3
Results and Analysis
Experiment results and analysis are presented in the order of the research goals. RG1: for LDAP directory metadata, using GA-based approach can find a set of SOM parameter values whose clustering performance is comparable to the clustering done by human experts. The experiment was first conducted on the training dataset of Data Source A. The parameter values for the GA are shown in Table 5. The GA terminated when it converged at generation 25. The best set of parameter values generated by the Genetic Algorithm and its corresponding F-value are listed in Table 6. The clustering result produced by this GA-discovered parameter values set is compared with the results of human experts and the result is listed in Table 7. Table 5: GA Parameter Values population size
crossover probability
mutation probability
xdim
ydim
neighborhood size
120
0.8
0.08
2-12
2-12
2-10
training iterations 5,00050,000
Table 6: GA Generated SOM Parameter Values and the F-value xdim 10
ydim 8
neighborhood size 2
training iterations 26934
F-measure 0.440
Li L., Vaishnavi V.K., Vandenberg A.: SOM Clustering to Promote Interoperability ...
815
Table 7: Performance Metrics for the Genetic Algorithm Approach Metrics CE NCE CR CP
Expert 1 0.034 0.424 0.501 0.676
Expert 2 0.028 0.526 0.644 0.375
Expert 3 0.034 0.456 0.500 0.596
Expert 4 0.026 0.390 0.620 0.600
Expert 5 0.290 0.852 0.082 0.746
Expert 6 0.119 0.709 0.709 0.724
Mean 0.088 0.560 0.422 0.619
The performance of the GA-generated SOM parameter values set was tested to determine if it was comparable to the performance of human experts. Metrics for both groups were calculated. It is assumed these two groups are distinct and a pooled variance t-Test was conducted for all four measurements. Each measurement included the six computer-to-experts values in the GA group; and each measurement included all the expert-to-expert values in the experts group (for CE and NCE, 15 values; for CR and CP, 30 values). The result of the t-Test is shown in Table 8. Table 8: T-test Results for the Comparison of GA Approach with Human Experts Metrics P value
Data Source A CE NCE CR 0.360 0.537 0.388 Note: α = 0.05; two-tails test.
CP 0.166
None of P-values in Table 8 is significant at 0.05 alpha level. This shows that SOM cluster performance is comparable to human experts using five percent level of significance. Comparing Table 4 with Table 7, the performance metrics values of the GA-based approach are similar to the values of human experts. With respect to Table 3 and Table 7, it is interesting to see that the CE and NCE mean values of the GAbased approach (0.088, 0.560, Table 7) are lower than the ones of human experts (0.138, 0.618, Table 3) and the CP mean value of the GA-based approach is higher (0.619, Table 7) than the mean of the human experts (0.520, Table 3). The clustering result of the GA-based approach could be considered a bit better since a lower error rate and a higher precision are usually preferred in clustering. Therefore, the conclusion is that the clustering performance of the GA-generated SOM parameter values is comparable to the performance of human experts. We then used the SOM map (generated from processing data source A) and projected the objects of Data Source B (the holdout data) onto the map and showed a cluster recall of 0.546, a cluster precision of 0.747 and an F-measure of 0.585. This shows SOM map performs very well on testing data (data source B). Research goal 1 is therefore achieved. RG2: the GA-generated SOM parameter values set can have equal or better clustering performance than the performance of a SOM parameter values set discovered by a linear search. Table 9 compares the clustering results metrics of the GA-based approach and the linear search (the means of the computer result versus each expert are compared). As noted previously, F-measure is a measurement of overall clustering performance. The F-measure value of the GA-based approach (0.440) is larger than the F-measure
816
Li L., Vaishnavi V.K., Vandenberg A.: SOM Clustering to Promote Interoperability ...
value for the linear search (0.408), indicating the GA-based approach has overall better performance. NE and NCE (error) values for the GA-based approach (0.088, 0.560) are smaller than the ones for the linear search (0.094, 0.592). While the two approaches’ CR values are similar (0.422 versus 0.420), the GA’s CP value (0.619) is higher than that for the linear search (0.536). Overall, our experiment indicates the SOM parameter values generated a genetic algorithm can have a better performance than parameter values generated by the linear search. So, Research goal 2 is achieved. Table 9: Clustering Results Metrics Linear Search and GA approach
CE NCE CR CP F-measure Value
Linear Search 0.094 0.592 0.420 0.536 0.408
GA Approach 0.088 0.560 0.422 0.620 0.440
RG3: The SOM map generated from one LDAP directory can continue to perform well on another LDAP directory that has a similar structure. The SOM map generated from Data Source A was used to map Data Source C. The results are presented in Table 101. The mean F-measure in Table 10 is lower (0.368), but considering the significant difference in the number of object classes in the two data sources (126 for data source A and 212 for data source C), the experiment still suggests some projection power of the generated SOM map in mapping data source C where data source C did not participate at all in training the map. So, Research goal 3 is inconclusive or only weakly achieved. (It is noted that we subsequently separately applied the GA-based approach on data source C to find a good set of parameter values and achieved a resulting F-measure of 0.552.) Table 10: Performance Metrics for Data Source C
CE NCE CR CP F-measure
Expert 1 0.039 0.470 0.430 0.693 0.530
Expert 2 0.034 0.682 0.438 0.249 0.318
Expert 3 0.039 0.521 0.411 0.574 0.479
Expert 4 0.120 0.780 0.138 0.537 0.220
Expert 5 0.038 0.709 0.361 0.244 0.291
Mean 0.054 0.633 0.356 0.459 0.368
RG4: The proposed system running on grid computing infrastructure can require less processing time than the system running on a single PC.
1
There were six experts who manually clustered data sources. One of the experts' clustering was discarded as anomalous. As confirmed by a follow up interview, this expert didn’t spend considerable time in performing the assigned task.
Li L., Vaishnavi V.K., Vandenberg A.: SOM Clustering to Promote Interoperability ...
817
The proposed GA approach first ran on a relatively powerful Windows machine (3.0 GHz CPU and 2.0 GB RAM) and the processing time took 110 minutes. The system then ran on a grid computing infrastructure (13 machines, each machine has 933 MHz CPU and 512MB RAM) and the processing time was 33 minutes. The processing time includes the time for submitting tasks to Grid node, scheduling of tasks, executing tasks and collecting the results. The grid used in this paper is just a small-scaled in-house implementation, so it is expected that the processing time of the system can be further reduced if it is submitted to a more powerful grid environment. Therefore, Research goal 4 is achieved. RG5: For a converging LDAP directory application domain, it’s possible to generate a stable SOM map that will cluster unknown LDAP metadata from the same domain. Experiment 3 first clustered data source A using a consensus of experts’ clustering as a reference set – such that the GA would seek results (based on the reference set) that were comparable to expert’s consensus results. The GA converged on a result where the F-measure was 0.353 (Table 11). We use the resulting map and project data source B onto the map (without redoing the clustering process). The Fmeasure of clustering for Data Source B was 0.429, a reasonably good clustering. We then updated the reference set (the experts’ consensus) used to cluster Data Source A by adding an additional consensus set from experts’ clustering results of Data Source C. Note that data sources, A and C, have large portion of overlap (see Table 1). Using the updated reference set, the F-measure for Data Source A gets increased to 0.462 (Table 11) and when using the map to map Data Source B, F-measure for Data Source B jumps to 0.585. Data source A, B and C can be considered as a converging domain. Using the consensus set from Data Source A and C, we can have a very good projection for Data Source B that can be considered as unknown data in the domain. Research goal 5 is thus achieved. Table 11: SOM Clustering Result Using Five Experts Consensus Set Data Source
Consensus Set
xdim
ydim
neighborhood size
training iterations
Source A Source A
Source A Source A & C
5 5
11 9
2 4
34050 37140
FFmeasure measure * 0.353 0.429 0.462 0.585
Note: * F-measure for Data Source B when mapped to Source A generated map
6
Conclusions and Discussion
Effective clustering of LDAP directory metadata can be very important to promote interoperability among directories. Self-organizing Map has been successfully used to structure LDAP directory metadata. However, the performance of SOM largely relies on the parameter values being used and the selection process is often ad hoc. This paper proposes a Grid-enabled genetic algorithm approach to systematically and efficiently identify a set of SOM parameter values that can enable good clustering performance. This paper also explores the feasibility of automating the SOM clustering process in a converging domain by creating a stable SOM map.
818
Li L., Vaishnavi V.K., Vandenberg A.: SOM Clustering to Promote Interoperability ...
The experimental results show that the proposed approach could discover a set of parameter values for a SOM algorithm such that the computer clustering results are comparable to those of domain experts and a stable SOM map can be created for a group of converging LDAP directory metadata (where datasets in the domain have a large portion of overlaps). The implementation of a Grid infrastructure showed significant improvement in running time for the proposed approach. While combining SOM and GA is not particularly new, this study makes a significant contribution by innovatively integrating SOM with GA to cluster LDAP directory metadata. The use of Grid infrastructure greatly improves the practicability of the research approach. Another contribution is our exploration of using our approach on a group of converging datasets which is the first step to full automating the SOM clustering process. Our future research is expected to take the following directions: 1) Further investigation on generation of reference sets and stable SOM maps. While this work represents initial work on this perspective, there remain interesting questions: How do reference sets respond to the change of data sources? When are SOM maps stabilized? What can be said for non-converging domains? 2) Further refinement of the research prototype including user interface enhancement, improvement of overall performance of clustering (with respect to Recall, Precision, F-measure), use of grid infrastructure to reduce the processing time of system to a more practical range (i.e., several minutes or less). 3) The GA parameter values such as mutation rate, convergence rate, etc., have impact on the performance of GA. In this paper the selection of those parameter values is done manually. We are looking at adding another layer of GA program to systematically identify a good set of GA parameter values. 4) We used one point crossover in this study; it would, of course, be interesting to investigate the impact of two point or multiple point crossover on the GA performance. Acknowledgment
This work has been partially supported by NSF ITR Grant IIS-0312636; a subaward to NSF Grant No. ANI-0123937; Sun Microsystems Academic Equipment Grant EDUD 7824-010460-US; Georgia State University’s Robinson College of Business; Georgia State University’s Information Systems & Technology; and Columbus State University’s Turner College of Business and Computer Science. We would like to thank the anonymous reviewers for their constructive comments on an earlier version of the paper.
References [Foster, I. and C. Kesselman, 1999] Foster, I. and C. Kesselman. The Grid: Blueprint for a New Computing Infrastructure. San Francisco, CA, Morgan and Kaufmann. [GAlib, 2005] GAlib. GAlib, A C++ Library of Genetic Algorithm Components 2.4.6. from http://lancet.mit.edu/ga/. [Gettes, M. R. and K. Klingenstein, 2009] Gettes, M. R. and K. Klingenstein. The Directory of Directories for Higher Education DoD. Retrieved May 21, 2009, 2009, from http://middleware.internet2.edu/dodhe/.
Li L., Vaishnavi V.K., Vandenberg A.: SOM Clustering to Promote Interoperability ...
819
[GlobusAlliance, 2005] GlobusAlliance. The Globus Alliance. Retrieved Dec 14th, 2005, from http://www.globus.org. [Goldberg, D. E., 1989] Goldberg, D. E. Genetic Algorithms in Search, Optimization and Machine Learning, Addison-Wesley. [Hansen, M. T., et al., 1999] Hansen, M. T., et al.: What's your strategy for managing knowledge. Harvard Business Review 77(2): 106-116. [Hayward, S., et al., 1999] Hayward, S., et al.: Business strategy will drive directory services, The GartnerGroup. [Holland, J. H., 1992] Holland, J. H.: Genetic Algorithms. Scientific American: 66-72. [Kiang, M. Y., et al., 1995] Kiang, M. Y., et al.: Self-organizing map networks as an interactive clustering tool-An application to group technology. Decision Support System 15: 351-374. [Kohonen, T., 2001] Kohonen, T. Self-Organizing Maps. New York, Springer. [Kohonen, T., et al., 1995] Kohonen, T., et al.: SOM_PAK: The self-organizing map package, version 3.1. Retrieved April 7, 1995. [Kohonen, T., et al., 2000] Kohonen, T., et al.: Self Organization of a Massive Document Collections, Special Issue on Neural Networks for Data Mining and Knowledge Discovery. IEEE Transactions on Neural Networks 11(3): 574-585. [Kostiainen, T. and J. Lampinen, 2000] Kostiainen, T. and J. Lampinen: Maximum likelihood optimization of Self-Organizing Map parameters. Proceedings of SCI'2000, 4th World Multiconference on Systemics, Cybernetics and Informatics, Orlando, USA. [Larsen, B. and A. Aone, 1999] Larsen, B. and A. Aone: Fast and Effective Text Mining Using Linear-time Document Clustering. Proc. of the Fifth ACM SIGKDD Int'l Conference on Knowledge Discovery and Data Mining. [Liang, J., et al., 2006] Liang, J., et al.: Clustering of LDAP Directory Schemas to Facilitate Information Resources Interoperability Across Organizations. IEEE Transactions on System, Man, and Cybernetics, Part A 36(4): 631-642. [Mangiameli, P., et al., 1996] Mangiameli, P., et al.: A comparison of SOM Neural Network and Hierarchical Clustering Methods. European Journal of Operational Research 93(2): 402-417. [McInerney, M. and A. Dhawan, 1994] McInerney, M. and A. Dhawan: Training the self-organizing feature map using hybrids of genetic and Kohonen methods. Proc. IEEE Int. Conf. Neural Networks. [Nikols, N., 2004] Nikols, N.: Directory Project Cookbook, V2 October 20, 2004. M. a. B. P. Directory and Security Strategies, The Burton Group. [Nürnberger, A., 2001] Nürnberger, A.: Clustering of document collections using a growing self-organizing map. Proceedings of BISC International Workshop on Fuzzy Logic and the Internet.
820
Li L., Vaishnavi V.K., Vandenberg A.: SOM Clustering to Promote Interoperability ...
[Polani, D., 1999] Polani, D.: On the Optimization of Self-Organizing Maps by Genetic Algorithm. Proceedings of the Workshop on Self-Organizing Maps (WSOM '99), Elsevier. [Polani, D. and T. Uthmann, 1993] Polani, D. and T. Uthmann: Training Kohonen Feature Maps in different Topologies: an Analysis using Genetic Algorithms. Proceedings of the Fifth International Conference on Genetic Algorithms, San Mateo, CA. [Rogers, A. and A. Prugel-Bennet, 1999] Rogers, A. and A. Prugel-Bennet: Modeling the Dynamics of a Steady State Genetic Algorithm. In Foundations of Genetic Algorithms 5, San Francisco, CA, Morgan Kaufmann. [Roussinov, D. G. and H. Chen, 1999] Roussinov, D. G. and H. Chen: Document clustering for electric meetings: an experimental comparison of two techniques. Decision Support Systems 27: 67-79. [Stein, B. and S. M. Z. Eissen, 2002] Stein, B. and S. M. Z. Eissen: Document Categorization with Major CLUST. 12th Annual Workshop On Information Technologies And Systems (WITS'02), Barcelona, Spain. [Tauber, J., et al., 2009] Tauber, J., et al.: Directory Services Markup Language (DSML). Retrieved May 21st, 2009, 2009, from http://www.dsmltools.org/dsml.org/dsml.html. [Tiwana, A. and B. Ramesh, 2001] Tiwana, A. and B. Ramesh: e-Services: Problems, Opportunities, and Digital Platforms. HICSS 2001, 34th Annual Hawaii International Conference on System Sciences, Maui, Hawaii. [Vandenberg, A., et al., 2002] Vandenberg, A., et al.: Research Prototype: Semantic FacilitatorTM(SM) for LDAP Directory Services. Proceedings of the 12th Annual Workshop on Information Technologies and Systems. [VanRijsbergen, C., 1979] VanRijsbergen, C.: Information Retrieval. London, Butterworth. [Wu, Q., et al., 2004] Wu, Q., et al.: On computing the route of a mobile agent for data fusion in a distributed sensor network. IEEE Transactions on Knowledge and Data Engineering 16: 740-753. [Zhao, H. and S. Ram, 2004] Zhao, H. and S. Ram: Clustering Schema Elements for Semantic Integration of Heterogeneous Data Sources. Journal of Database Management 15(4): 88-106.