Some of the First Implementations of Monitored Withstand Diagnostics on Utility Systems Nigel Hampton (1), Rick Hartlein (1), Chris L Fletcher (2), Jean Carlos Hernandez (3), Jeff Hesse (4), Michael G Pearman (5), Joshua Perkel (1), C Tim Wall (6), Walter Zenger (7) 1 - NEETRAC, Atlanta, GA, USA,
[email protected],
[email protected],
[email protected] 2 - Duke Energy , Charlotte, USA
[email protected] 3 - Universidad de Los Andes, Mérida, Mérida, Venezuela, hm¡
[email protected] 4 - Duke Energy, Cincinnatti, USA ¡
[email protected] 5 - Georgia Power Company, Atlanta, USA
[email protected] 6 - Alabama Power Company, Birmingham, USA
[email protected] 7 - Pacific Gas & Electric, San Francisco, USA
[email protected]
ABSTRACT Hipot or voltage proof tests have long been used to assure the health of cable systems in the factory and when commissioning. One of the concerns with this approach is that there is no way to judge the quality of the Pass, ie did the system barely survive or was there a respectable margin. This paper shows how this problem has been practically addressed in US utilities with an approach which is termed "Monitored Withstand". The protocols and the test philosophies are discussed. A number of case studies are discussed together which some reflections on future activities in this arena.
KEYWORDS Diagnostic Techniques, Very Low Frequency (VLF), Tan Delta, Decision Tools
INTRODUCTION Monitoring a property during a withstand (or Proof) test has been proposed as a more complete diagnostic over simple non monitored withstand or single diagnostics (Leakage, PD, Tan Delta etc) [1 - 5]. This paper describes some of the first practical implementations of this approach in the US and provides the collated results to date. Proof or withstand tests have been used for a very long time in the cable industry and find their origins in the well known routine tests carried out in accessory and cable factories. Although this test continues to serve the industry well, when a Simple Withstand is implemented in the field users continue to be concerned by three issues: 1. There is no way to estimate the quality of the cable system, and hence the risk of failure, prior to the application of the proof voltage. 2. There is no way to adjust the extent of the test (either by decreasing or increasing) according to the quality of the cable system 3. There is no way to judge the quality of the pass should the cable system support the proof voltage ie was the pass a good one or a marginal one. It had been suggested that if a diagnostic parameter, such as dielectric loss, leakage or partial discharge, were monitored during a proof test then all of the three issues noted above might be addressed. Consequently since 2008 the authors have been conducting Monitored Withstand tests on utility systems using very low frequency (VLF) waveforms to assess the practicality of
A2-10
the initial hypothesis. Experience has shown that the Monitored Withstand whether using Partial Discharge or Dielectric Loss does bring considerable and useful information to the utility engineer. This paper describes • Background to Monitored Withstand approaches • Differences associated with the metrics used for Monitored Withstands in comparison to the more normal pure diagnostics • Approaches for determining critical values for the monitored features • Decision tools for interpretations • Utility and Laboratory Case Studies including follow ups on system performance
MONITORED WITHSTAND TESTS Simple Withstand tests are proof tests that apply voltage above the normal operating voltage to stress the cable system in a prescribed manner for a set time [1 - 5]. These tests are similar to those applied to new accessories or cables in the factory where they provide the purchaser with assurance that the component can withstand a defined voltage. An alternative and more sophisticated implementation of the Simple Withstand approach requires that, in addition to its surviving the voltage stress, a property of the system be measured and monitored. This implementation of a withstand test, called Monitored Withstand, is discussed in this section. One of the drawbacks of Simple Withstand tests is that there is no straightforward way to estimate the "Pass" margin - once a test (say 30 min at 2 U 0 ) is completed, it is impossible to differentiate among those passing segments. That is, it is impossible to distinguish the segments that would survive 120 min from those that would have only survived 40 min. Thus, it is useful to employ the concept of a Monitored Withstand Test whereby a dielectric property or discharge characteristic is monitored to provide additional data. There are four ways these data are useful in making decisions during the test: Provide an estimate of the "Pass" margin. Enable a utility to stop a test after a short time if the monitored property appeared close to imminent failure on test, thereby allowing the required remediation work to take place at a convenient (lowest cost) time. Enable a utility to stop a test early if the monitored property provided definitive evidence of good performance, thereby increasing the number of tests
978-1-4673-5173-7-1/13/$31.00 © 2 0 1 3 IEEE
that could be completed and improving the overall efficiency of field testing. Enable a utility to extend a test if the monitored property provided indications that the "Pass" margin was not sufficiently large, thereby focusing test resources on sections that present the most concern. In a Simple Withstand test, the applied voltage is raised to a prescribed level, usually 1.5 to 2.5 times the nominal circuit operating voltage for a prescribed time. The purpose is to cause weak points in the circuit to fail during the elevated voltage application when the circuit is not supplying customers and when the available energy (which may be related to the safety risk) is considerably lower. Testing occurs at a time when the impact of a failure (if it occurs) is low and repairs can be made quickly and cost effectively.
showed that the cable system was degraded, but the utility elected to proceed to the withstand. In this opart of the test it is clear that the loss increased right up to the time of failure. The retest after repair shows much improved (lowered) dielectric features in the ramp and stable values in the hold period. In this case the utility was able to implement a shortened test time. It is important to note that these data were one of the earliest collected and it has since become clear that the shortened time was too short and that the current minimum is 15 minutes; down from the 30 minutes clearly recommended by IEEE400.2 [2, 5]. Furthermore it is instructive to note that although the dielectric performance is improved after the first failure and repair, the remaining cable system is not returned to the state of a new cable, where the loss and the voltage stability would be much better.
When performing a Monitored Withstand test, a dielectric or discharge property is monitored during the withstand period (Figure 1). The data and interpretation are available in real time during the test so that the decisions outlined above might be made. The dielectric or discharge values monitored are similar to those described in earlier sections. However, their implementation and interpretation differs due to the requirement of a fixed voltage and a relatively long period of voltage application. Within these constraints, Leakage Current, Partial Discharge (magnitude and repetition rate) and Tan 5 (stability and magnitude) might readily be used as monitors.
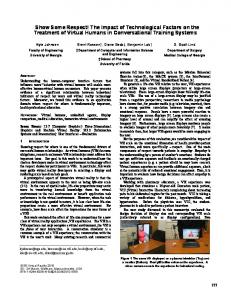
Figure 2 Monitored Withstand (Dielectric Loss) on an aged XLPE cable system before (left) and after (right) failure.
REPORTING AND INTERPRETATION Monitored Withstand results fall into two classes: Pass - no action required Not Pass - action required that may include "Further Study" Consequently, there are two ways a cable system might "Not Pass" a Monitored Withstand: o o
Figure 1: Schematic of a Monitored Withstand Test (black) with Optional Diagnostic Measurement (red) In Figure 2, the schematic also includes a commonly implemented Monitored Withstand test sequence - a stepped increase in voltage and a hold period. The critical part of the test is the measurement and interpretation during the withstand (constant voltage) phase. The step / ramp in voltage allows an evaluation before the start of the withstand test. This approach is valuable in that it enables the field engineers to assess the condition of the cable system before embarking on the Monitored Withstand test. A Monitored Withstand (Dielectric Loss) test on an aged XLPE cable system is shown by way of an example in Figure 2 before (left) and after (right) failure. Inspection of the Voltage Hold area shows the evolution of the loss. In the first test the diectric loss features in the step already
A2-10
o
o
Dielectric puncture • No dielectric puncture AND non-compliant information from the monitored property: Rapid increase anytime during the test • Steady upward trend at a moderate level • Instability (widely varying data) • High magnitude
On the other hand, there is only one way in which a cable system may "Pass" a Monitored Withstand test: no dielectric puncture and compliant information from the monitored property: o o
Stable (narrowly varying data) Low magnitude
978-1-4673-5173-7-1/13/$31.00 © 2 0 1 3 IEEE
At this stage, it is instructive to examine the differences between the interpretations of standard Dielectric Loss measurements compared to the assessment of the same property in a Monitored Withstand test. Work within the CDFI has suggested the following hierarchy for Dielectric Loss measurement interpretation, when not used in the Monitored Withstand mode is (ranked from most important to least important): o Stability within a voltage step. In the CDFI, stability is assessed by the standard deviation on Tan 5 measured during each step. Other methods for stability assessment methods may also be used, o Tip Up (difference in the mean value of Tan 5 at two selected voltages), o Tan 5 (mean value at Uo). When used in the Monitoring mode, the constant voltage employed does not permit the assessment of the Tip Up. However, this information can be available if a voltage ramp is used on the way to the withstand voltage level (Figure 1). Otherwise, Tip Up cannot form part of the standard hierarchy for Monitored Withstand. There are similar issues with the mean Tan ö. A mean Tan 5 can be computed for the entire withstand period of the test. However, since this is a Monitored Withstand test, testing occurs at voltages above Uo, the voltage commonly used for standard Tan 5 assessments. The concept of mean Tan 5 is useful even at this higher voltage, but the critical values for assessment cannot be the same as those used for Tan 5 at Uo. In fact, these values are likely to be higher than those used for the standard Tan 5 assessment (Table 2). In the approach detailed here the stability has been assessed by considering the difference between initial and 10 minute cases. 10 minutes has been chosen in that it is sufficiently long to determine the underlying trend, yet sufficient time remains for the user to make an active decision on whether they wish to curtail the test at 15 minutes. Table 1 Comparison of Diagnostic Features (Tan Delta) for Step (incl pure Tan Delta tests) and Hold Portions of Monitored Withstand tests Voltage Step Portion
(Withstand Constant Voltage) Portion
(Standard Deviation)
over 6 to 12 measurements at Uo
extended time at IEEE400.2 voltage level
Voltage Dependence of Tan Delta (Tip Up)
between 1.5Uo & 0.5UO
-
Tan Delta
over 6 to 12 measurements at Uo
extended time at IEEE400.2 voltage level
(Mean) Change in Tan Delta with time
-
between 0 & 10 minutes
Generally, stability is the most useful of the three dielectric loss features. Unfortunately, the use of standard deviation is not likely to be sufficient for this purpose. The need to
A2-10
Feedback indicates that the approach detailed in Table 1 is quite a standard hierarchy for those using Monitored Withstand programs employing Dielectric Loss. It is important to note that the attributes are similar for the Ramp and Hold Phases but that the levels will be quite different due to the differences in the voltages and times of application. Consequently, we believe it is likely that the above hierarchy for assessment of Tan 5 can be generalized for any monitored property (such as Leakage Current and PD for all voltage sources except Damped AC): o Trend within the monitored period. These are likely to be categorical attributes: flat, upward trend, downward trend, etc. Stability (by how much did it change) within the monitored period, o Monitored property (mean value at withstand voltage).
ESTABLISHING CRITICAL MULTIPLE FEATURES
LEVELS
WITH
This section describes the preliminary effort to develop knowledge rules to help interpret Monitored Withstand / Dielectric Loss results. This is accomplished in the same manner as that employed for Tan Delta measurements, namely the collation and the interpretation of a wide range of data obtained from service measurements on utility systems. Figure 3 shows the distributions (fitted - 3 parameter Weibull and empirical) for the Standard Deviation (overall for 30 minutes) for field tests on PILC cables. In this figure the data are ranked from smallest (best performers) to largers (poorest performers) and the rank positions are plotted against the Standard Deviation. In the same way as for teh Tan Delta ramp data, convenient percentiles such as 80 % and 95 % are suggested as critical values. In practice, the values at these percentiles can be rounded to 1.4 E-3 and 2.8 E-3.
Voltage Hold
& Tan Delta Assessment Stability
improve the approach is driven by the long times used for the monitored test and because the user is more likely to be interested in the trend (increasing or decreasing) of the instability rather than the absolute value of the stability.
Std DBV Tan Delta for Monitored Withstand (E-3)
Figure 3: Empirical Distribution of Standard Deviation (Overall for 30 minutes) for Field Tests on PILC Cables at IEEE Std. 400.2™ Voltage Levels Table 2 shows a comparison of the criteria for stability in a
978-1-4673-5173-7-1/13/$31.00 © 2 0 1 3 IEEE
Standard Tan ö measurement and the resulting criteria obtained from Figure 3 for the Monitored Withstand mode. The limits are lower for the standard Tan 5 measurements than the Monitored Withstand mode due to the higher voltages and longer times employed for withstand tests. Table 2: Criteria for Condition Assessment Criteria of Paper Insulations (PILC) for Dielectric Loss and Monitored Withstand Modes
Condition Assessment
No Action Required Further Study Advised Action Required
Tan 5 Stability Measured @ Uo [E-3]
Tan ö Stability Measured @ IEEE Std. 400.2 Withstand levels [E-3]
(Dielectric Loss Mode)
(Monitored Withstand Mode)
2.8
standard withstand test time might be modified by the cable system condition, for example: o No Action Required - - standard 30 minute test time may be Reduced to 15 minutes o Further Study - - retain standard 30 minute test o Action Required - - standard 30 minute test time should be increased to 60 minutes The approach outlined above may be replicated for the time evolution trend and the tan delta level to give insulation specific Decision Tools. These tools are tabulated in Table 3.
SERVICE PERFORMANCE Aged XLPE Cable
Table 3 Test Time Guidance and Condition Assessment for Monitored Withstand tests on MV cable systems
"O c
C O 5> c6~I ~
CD
o
c
CD
"o
CD CD
O c -g CD
CD
o n
"O _
CD
CO
- Q LJJ
CD ^ % "
O CD
E
CD
CO
"CD
CD
—
Q
O
Figure 4: Tan 5 Monitored Withstand Data on service aged XLPE cables The results of a VLF AC - Sinusoidal Monitored Withstand test in which the Tan 5 was monitored continuously for the 30 minutes appear in Figure 4.
(/) CD
CD CT)
These results lead to the following assessment: PE-based Insulations (i.e. PE, XLPE, WTRXLPE) No Action Required
0.25 and 17
o
5 and 45
Paper Insulations (i.e. PILC) Reduced to 15 Mins
No Action Required
4.
Tested segment did not have a dielectric puncture Change between 0 and 10 minutes: 0 E-3 Stability (standard deviation on the mean at the withstand voltage): 0.79E-3 Tan 5 (mean at withstand voltage): 0.9E-3
The Monitored Withstand assessment of this performance would likely be "No Action Required" and test time may be reduced to 15 minutes. In this case the utility chose not to reduce the test time even though it was possible for them to do so.
PILC Cable System 1.3 and 4
75 and 135
In the context of a Monitored withstand test the Condition Assessments (No Action Required etc) may also be used to determine real time guidance for the prosecution of the withstand test. The current approach is to use the Condition Assessments to suggest how the IEEE400.2
A2-10
A three phase Paper Insulated Lead Cable (PILC) was tested in late 2009. The protocol employed included a Step Up and a Hold phase - first part of Figure 1. The results from the Step Up phase are shown in Table 4 following the interpretation schemes in detailed in references 5 & 6. As a consequence the utility involved elected to follow these purely Tan 5 measurements with a Monitored WitshandD In this case theye elected to conduct teh Monitored Withstand on all three phases rather than just Phase A which was shown to be the poorest performer by the the step tests. Results of a VLF AC - Sinusoidal Monitored Withstand test with Tan ö on PILC insulated cables appear in Figure
978-1-4673-5173-7-1/13/$31.00 © 2 0 1 3 IEEE
5. In these tests three phases were tested separately, if this test had been a Simple Withstand test they would have been classified as Pass as none failed under voltage. However inspection clearly shows that these phases perform quite differently in terms of change with time and level. The right most figure displays the diagnostic features, change with time, stability and tan delta level (represented by the size of the data points. The open symbols are graphical representations of the PILC criteria in Table 3. Comparison of the data points with the criteria enables interpretation of the test results, which is shown in Table 4. A
B
:ziz: : 3 : : I : 3 : I : C E I I I E D I
"TTUn
60 Min
s 15 Min § 40-
Reduction Criteria
Symbol size corresponds to Tan Delta magnitude
C
Voltage Step Up Std Dev Tan ô @ Uo Mean Tan ô @ 1.5Uo Mean Tan ô @ 0.5Uo
Measurement Sequence
Action Required
Further Study
Further Study
No Action Required
No Action Required
Mean Tan ô @ Uo
Voltage Hold Dielectric Failure Change between 0 and 10 minutes Stability (standard deviation at withstand voltage)
None Action Required Extend to 60 minutes
Tan 5
Further Study
(mean at withstand voltage)
Retain 30 minutes
No Action Required Reduce to 15 minutes
Examination of the results for Phase A after the Monitored Withstand indicated that an appropriate final classification (based on Change with Time, Stability and Tan 5) would be Action Required.
A2-10
T ± m l
Dfierence 10 mn i s toOmn i s (E-3)
Figure 5: Tan 5 Monitored Withstand Data (left) and Interpretation of Results (right) from Three Phases of Service Aged PILC Insulated Cables On this utility system it has been possible to follow the test and service performance. These data show that 6% of the tests failed via a dielectric puncture in a simple withstand mode, whereas an additional 12% of tests could be addressed (18% in total) when the dielectric data were added to the assessment. Of these 18% No Passes, 7% occurred during the ramp up and the remaining 11% in the hold. The accumulated length and test time is on the order of 450 conductor mile*years. Over this time the "After Test" failure rate in service is of the order of 0.4 per 100 conductor miles per year. This compares very favourably with system wide failure rate of 7 per 100 conductor miles per year and shows the benefits that can accrue. Equally valuable but less tangible is the benefit that comes from a failure that occurs at in service which carries a much larger energy in the fault than that from test equipment.
EPR Cable A challenging example involving a 60 minute test on EPR cable appears in Figure 6. In this case, the extended period of monitoring reveals the instability in the standard deviation and the median Dielectric Loss. It is useful to note that the use of non parametric estimates (median and inter-quartile range) conveys the same information as the distribution based estimates (mean, standard deviation) but without the potential interference from outlier data. The variability in these features would not have been revealed by a standard diagnostic test - the results from this test are represented by the initial open symbols in both plots.
978-1-4673-5173-7-1/13/$31.00 © 2 0 1 3 IEEE
Median Tan Delta (E-3)
m : TV¡ •I
-V-
i
Inter Quartile Ranqe (E-3)
0.350.30-
___T
0.25-
___{. 1•+
0.20-
!
0
•
-i—+—i H* 0.10- --•i—M 0.15-
4 ; t/v
m
fe 15
30
45
0.05-
0.00- --••H • 60
0
Time - mins
15
• -
5.
i
I
• • -•-
Ma» i•
S
Ţ
1 /
1
1
1
I
i
S --y—i 4-^.-4.
1
1
700
11—*K-l 11 +•1 +4-
i I i Ji * 1
J
30
I
1
I
600
-L_
I
-l— \:-J— 4- 41 r-V-t-ï"
500 1
l_.
400
2-
300 200
! i !
100
45 10
In this case the results at 15 minutes would have shown an increasing Tan Delta with high variability. Thus there would have been insufficient evidence to curtail the test at 15 minutes. In fact the decision was taken at this point to extend the test to 60 minutes (the maximum identified in IEEE400.2). Ultimately the Tan 5 Monitored Withstand data would be classified as:
4.
.L
• •
Figure 6: Tan 5 Monitored Withstand Data on Service Aged Cable with Filled Insulation Tested at IEEE Std. 400.2 Voltage Level
1. 2. 3.
• Tan Delta • PD Pulse Count
No Dielectric Failure Trend: Unstable Stability (Inter Quartile Range at the withstand voltage): 0.125 E-3 (range of 0-0.3 E-3) Tan 5 (median at withstand voltage): 113.8 E-3 (range of 112.5-116.5 E-3). Test Result : Action Required
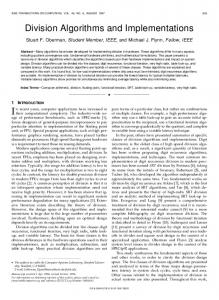
Dual Monitored Diagnostics Figure 7 shows a monitored withstand test on a duct based XLPE cable system which had been installed in the mid 1980's. In these tests PD and Tan Delta measurements were carried out simultaneously. Inspection of the results shows the usefulness of monitoring two properties as the Tan Delta might suggest that the test could be truncated at 15 minutes, yet the PD pulse rate was increasing. Consequently it was determined to extend the time to 60 minutes; however as the PD rate had not reduced sufficiently the cables were scheduled for replacement on the basis of the results at 30 minutes.
15
Time [rrin]
20
Figure 7: Simultaneous measurement of Tan 5 and PD data collected during a monitored withstand test on 1970's vintage XLPE cables
FUTURE CHALLENGES This paper has shown that considerable progress has been made in quite a short time towards the practical implementation of Monitored Withstand tests for medium voltage (MV) cable systems. Nevertheless there are some challenges that may be clearly identified: There are very many features that can be derived in a monitored withstand test, thus there is a need to find a way to combine them in a multivariate approach. Given the success with Principal Component Analysis associated with Tan Delta tests [7] then this would likely be a profitable approach to the analysis. Current embodiments of field measurement systems are geared to pure Tan Delta assessments and provide real time representation of voltage effects with simple diagnostic factors (mean & standard deviation). Given the progress in the analysis presented here it is clear that the user would benefit from: • The calculation of more diagnostic features, for both Tan Delta and Capacitance • A graphical representation of the Tan Delta & Capacitance evolution with time. The progress evidenced in Table 3 shows that a series of decision tools can be constructed to aid implementation in the field. The authors are currently developing a number of such tools, which currently take the form of printed analysis sheets and data forms. The challenge is to find a way to take the available test data and make it available in a way to cover the wide range of situations that might develop in the field. As an example, this paper has dealt with the most common (80% of the time) case when the standard 30 minute test could be curtailed at 15 minutes; however the case of extension / curtailment at 30 minutes has yet to be addressed. When this is done it will require another level of features that although they are computationally straightforward they are additional layers of complexity.
ACKNOWLEDGEMENTS The authors gratefully acknowledge the useful discussions with many of the engineers involved within the Cable Diagnostic Focused Initiative and the financial support of a large number of utilities in North America and
A2-10
978-1-4673-5173-7-1/13/$31.00 © 2 0 1 3 IEEE
the US Department of Energy under award number DEFC02-04CH11237. They are especially endebted to the utilities who took the time to contribute data from the field.
CONCLUSIONS This paper has shown that Monitored Withstand is a practical diagnostic approach that can be implemented by utilities. The implementation is supported by automated measurement equipment and a series of decision tools. This combination empowers users at the local level and provides a significant amount of support. Furthermore the immediacy and transparency of the data acquisition and interpretation processes builds ownership.
REFERENCES 1.
IEEE Standard 400.2-2004™, IEEE Guide for Field Testing of Shielded Power Cable Systems Using Very Low Frequency (VLF), 2005.
2.
IEEE Standard 400-2001™, IEEE Guide for Field Testing and Evaluation of the Insulation of Shielded Power Cable Systems,. 2002.
3.
RN Hampton et al, "Experience of Withstand Testing of Cable Systems in the USA", CIGRE 2010 B1203.
4.
J. Densley, "Aging Mechanisms and Diagnostics for Power Cables - An Overview," IEEE Electrical Ins Mag, vol 17, no 1, pp 14-22, Jan/Feb 2001.
5.
Diagnostic Testing of Underground Cable Systems (Cable Diagnostic Focused Initiative), DOE Award No. DE-FC02-04CH11237, December 2010
6.
J Perkel et al, "Challenges associated with the interpretation of dielectric loss data from power cable system measurements", JICABLE11, Versailles France, June 2011
A2-10
978-1-4673-5173-7-1/13/$31.00 © 2 0 1 3 IEEE