SORTING OF IN‐SHELL PISTACHIO NUTS FROM KERNELS USING COLOR IMAGING R. P. Haff, T. C. Pearson, N. Toyofuku ABSTRACT. Sorting pistachio kernels from in‐shell nuts currently requires a combination of automated and manual sorting, an expensive and labor‐intensive two‐stage process. This research demonstrates the feasibility of using color imaging as a basis for distinguishing both regular and small in‐shell pistachio nuts from kernels in the pistachio nut process stream. Two algorithms were developed to classify images of in‐shell nuts, small in‐shell nuts, and kernels. The first algorithm used a discriminant analysis (DA) routine to evaluate features extracted from the images based on histograms of red, green, and blue (RGB) pixel intensities, and resulted in a 99.9% overall accuracy for separating regular in‐shell pistachio nuts from kernels. Small in‐shell pistachio nuts were harder to discriminate from kernels, with an overall accuracy of 85%. The second algorithm used a k‐nearest neighbors (knn) routine to evaluate features based on color histograms plus intensity slope information. The knn routine matched the accuracy of the DA algorithm for distinguishing regular in‐shells from kernels with 99.9% correct. For the small in‐shell case, however, the knn approach was superior with 96% accuracy. When used in a high‐speed color imaging system, the algorithms would provide the means for economical high‐speed sorting of in‐shell pistachio nuts and kernels. Keywords. Pistachio, Kernel, In‐shell, Small in‐shell, Discriminant analysis, K‐nearest neighbor, Sorting, Processing stream.
P
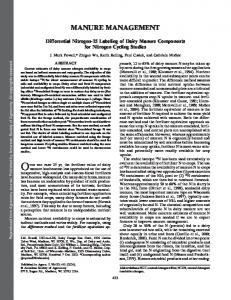
istachio nuts are a significant industry in California agriculture, with yields in 2008 of 278 million pounds and a market value exceeding a half billion dollars (USDA‐NASS, 2009). Between 2006 and 2008, approximately 20% of the pistachio yield was sold as “shelled product,” otherwise known as “meats” or “kernels.” The remainder is sold as “in‐shell” product. For the most part, kernels are sold for use in processed foods such as cookies or ice cream. Although they are officially known as shelled product, a large percentage of kernels are a result of the nuts losing their shells at some point in the processing operation and no shelling is required. While this may be convenient by reducing or eliminating the need for shelling, it introduces the need to sort the overall processing stream into separate in‐ shell and kernel streams. Each of these two streams is further sorted into various value streams, while also removing de‐ fects and contaminants. One particular stream, known as “small in‐shells,” is very challenging to separate from the kernel stream due to the similarity in both size and often col‐ or. Small in‐shell nuts tend to have discoloration in the shell region, generally from staining, that resemble colors found in the kernels. Figure 1 shows typical color images of regular in‐ shell, small in‐shell, and kernel pistachio nuts.
Submitted for review in November 2009 as manuscript number FPE 8314; approved for publication by the Food & Process Engineering Institute Division of ASABE in April 2010. The authors are Ron P. Haff, ASABE Member Engineer, Agricultural Engineer, USDA‐ARS, Western Regional Research Center, Albany, California; Tom C. Pearson, Agricultural Engineer, USDA‐ARS‐GMPRC, Manhattan, Kansas; and Natsuko Toyofuku, Physical Scientist, USDA‐ARS, Western Regional Research Center, Albany, California. Corresponding author: Ron P. Haff, USDA‐ARS, Western Regional Research Center; 800 Buchanan St., Albany, CA; phone: 510‐559‐5868; fax: 510‐559‐5684; e‐mail:
[email protected].
United States standards for the inclusion of foreign material in kernels, including shells and shell fragments, allow for 0.03% for U.S. Fancy, 0.05% for U.S. #1, and 0.1% for U.S. #2 (USDA‐AMS, 1990). This corresponds to approximately the equivalent of one‐half shell per 1100 g, 660 g, and 330 g of kernels, respectively. However, food processors using pistachio kernels generally have a zero tolerance policy for the presence of shells or shell fragments, which can be a food safety issue. Automated sorters are currently unable to achieve this level, and therefore expen‐ sive manual sorting is also required (J. Gibbons, Setton Pistachio, Personal communication, 23 June 2005). The cost
Figure 1. Typical color images of regular in‐shell (left), small in‐shell (cen‐ ter), and kernel (right) pistachio nuts.
Applied Engineering in Agriculture Vol. 26(4): 633‐638
2010 American Society of Agricultural and Biological Engineers ISSN 0883-8542
633
of automated sorters plus the high cost of labor makes sorting a substantial expense for the industry. Optical sorters are routinely used to process a variety of commodities including tree nuts such as pistachios. The most common sorters use photodiode‐based detectors to measure light reflected from the product at specific wavelengths in the visible (vis) and near infrared (NIR) spectral bands (Bee and Honeywood, 2007). Computers or microprocessors process the detector outputs for classification of the sample. Improv‐ ing the accuracy of these sorters would help reduce the burden of manual sorting for pistachio processors. A considerable amount of past research in vis/NIR dual band sorting devices has focused on improved methods of spectral band selection. Stepwise discriminant analysis has been used for spectral band selection from images of white wheat (Pasikatan and Dowell, 2002). A review of spectral band selection from hyperspectral images of fruits and vegetables was reported by Bajwa et al. (2004). Algorithms for selecting optimal spectral bands have been reported using Principle Component Analysis (Mehl et al., 2002; Lawrence et al., 2003; Bajwa et al., 2004), randomly chosen subsets of features (Lestander et al., 2003; Bajwa et al., 2004; Steward et al., 2005), and improving separation of classes (Han and Kamber, 2001; Caltepe et al., 2004; Pearson et al., 2004). It has also been demonstrated that vis/NIR sorting devices can be optimized for particular sorting tasks by more narrowly tailoring beam‐splitting mirrors and filters (Haff and Pear‐ son, 2006). Optimizing spectral bands may improve sorting accuracy, but does not reduce the complexity or cost of the sorting devices. The required conversion of optics actually adds to the original cost and impacts the versatility of the device. For separating in‐shell pistachios from kernels, a simple low‐cost sorting device has been reported based on reflection of light at a single wavelength (Haff and Jackson, 2008). Another simple and inexpensive technique, using impact vibration analysis, has also been reported (Haff and Pearson, 2007a). However, although these devices reduce cost, the sorting accuracies reported were slightly below that using standard equipment with optimized optics. What is required is a low‐cost sorting device that increases sorting accuracy. More recently, researchers have developed a new eco‐ nomical sorting system (Pearson, 2009a) based on high‐ speed color imaging (fig. 2). The cameras are a combination of a complementary metal oxide semiconductor (CMOS) color image sensor and a field programmable gate array (FPGA), allowing image processing and classification to be executed in real‐time without the need for an external computer. The placement of three such cameras around a product stream ensures that the entire surface of each sample is inspected. This system has the advantage of spatial resolution over traditional color or vis/NIR sorting devices, suggesting the possibility of increased performance at lower cost for the sorting of in‐shell and kernel streams of pistachio nuts. OBJECTIVE The objective of this research was to demonstrate the feasibility and effectiveness of using color imaging as a basis for sorting regular in‐shell and small in‐shells pistachio nuts from kernels in the pistachio nut process stream, thus providing the basis for a low‐cost, high‐speed sorting device.
634
Figure 2. High‐speed color image sensor/FPGA based imaging and sort‐ ing system.
METHODS AND MATERIALS Color images (fig. 1) were generated by placing samples in a grid pattern on the bed of a 47‐ × 67‐mm (12‐ × 17‐in.) document scanner (Microtek Scanmaker 9800XL, Cerritos, Calif.), allowing 204 samples to be imaged in a single pass. A computer algorithm was created to divide the resulting bitmap images into single sample images. In this fashion, 1000 images each of in‐shell, small in‐shell, and kernel samples were created. Two classification methods were developed and applied to the images. The first involved using bin values of RGB space histograms as input features to a DA routine. The second used individual R, G, and B component histograms and pixel intensity slopes as input features to a knn classification scheme. Pixel intensity slopes, also known as derivatives, quantify the change in pixel intensity between a pixel location and its neighbors. For multi‐dimensional histograms, we adopt the terminology that the divisions within each basis (plural bases) (value plotted along a histogram axis, e.g., intensity of a pixel color component) are called channels while the intersections of channels in which the histogram values are stored are called bins. DISCRIMINANT ANALYSIS CLASSIFICATION The intensity value for each pixel in a color image is comprised of three components ranging from 0 to 255 representing the red, green, and blue contributions to the pixel color. These three values form the bases of a three‐dimensional RGB space. Each of the three bases was divided into n histogram channels of equal size, thus dividing the RGB space into n3 bins. Each bin was a unique set of ranges within the RGB space and thus became a feature that could be used to differentiate the data. As n changed, the number of features changed. For example, if n = 3 or n = 10, there would be 27 or 1000 different possible features, respectively, to test for significance. For each image, the value of each feature was calculated from the total number of pixels with RGB values that fell within the space of each of these bins. Because the background represents a large portion of each image, pixels for which all three RGB values were below 50 were omitted. The value of 50 was adopted after applying a threshold program to a subset of images and visually observing the level at which the greatest portion of
APPLIED ENGINEERING IN AGRICULTURE
the background was removed without affecting pixels within the kernel or nut portions of the images. The values within each bin were treated as image features and input into a DA algorithm. The samples were equally split between a training set and a validation set. Each combination of three features was tested for the highest accuracy in classifying validation set samples based on discriminant functions derived from the training set. Adding a fourth feature (or more) was found to be ineffective for improving results. This exercise was performed for various divisions of the bases, with n varying from 3 to 13, beyond which the number of features to be processed became computationally prohibitive. Details of the DA algorithm have been previously reported (Haff and Pearson, 2007b). Based on the results of preliminary testing indicating better accuracy, separate discriminant functions were computed for in‐shell nuts versus kernels and small in‐shell nuts versus kernels, rather that combining the two in‐shell streams and computing a single discriminant function. Results of apply‐ ing the computed discriminant functions to the validation sets were reported in terms of false positives (fp) (kernels classified as in‐shell), false negatives (fn) (in‐shell classified as kernels), percent overall accuracy, as well as the optimal set of features used for classification. K‐NEAREST NEIGHBORS CLASSIFICATION Two‐dimensional histograms (R, G, and B) with bases of 16 pixel intensity channels and 12 high‐pass filtered pixel intensity channels (192 bins) were generated. The high‐pass filter used a 3×3 discrete Laplace operator (eq. 1) to generate a second order derivative (slope): ⎡ 0 − 1 0⎤ ⎪ ⎥ h(m, n) = ⎪ − 1 4 − 1⎥ ⎪⎣ 0 − 1 0⎥⎦
(1)
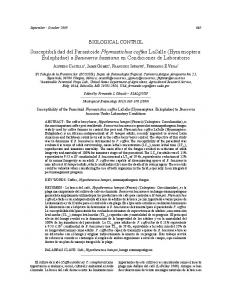
While each of the three color component slope histograms were tested for the ability to discriminate the desired classes of pistachio nuts in a knn routine as described below, it was determined that the blue channel was the most useful and thus the red and green channels were discarded. The high‐pass filtered blue image pixel intensity values predominantly ranged between 0 and 24 with a small number having higher values. Any pixel locations with a slope greater than 24 were assigned a value of 24. Within this histogram, it was determined that areas of high intensity and low slope (variation in intensity in a given direction) were associated with the shell, areas of high slope and moderate intensity were associated with shell edges, and areas of low intensity and moderate slope were associated with the kernels. Examples of these features can be seen in figure 3. The wrinkles on the kernels cause the high‐pass filter to yield moderate values while the green and brown colors associated with the kernels result in low blue pixel intensities. In addition to the 192 slope and intensity features (generated from the two‐dimensional histograms), additional features were generated based on the histograms of the three color component (RGB) pixel intensities. An intensity threshold of 75 was applied to segment the kernels from the dark background. The histograms of the three color compo‐ nents each contained n = 16 channels of 16 intensity levels
Vol. 26(4): 633‐638
Figure 3. Color images of small in‐shell pistachios (top‐left) and kernel (top‐right), and high‐pass filtered images (bottom). The shell of the small in‐shell contains regions of high blue pixel intensity and low slope, the ker‐ nel contains pixels of low blue intensity and moderate slope, the shell edge contains regions of high slope and moderate intensity.
per channel. This differs from the feature selection technique described above for the DA routine as in this case the total number of potential bins is 3*n = 48 rather than n3. These 48 bins were combined with the 192 slope and intensity bins for a total of 240 bins or features to be used as the input features for the knn routine. The optimal set of four features for distinguishing in‐shell nuts from kernels was selected using a k‐nearest neighbor scheme where the number of nearest neighbors, k, was three. Again, the data were split evenly between a training set and a validation set. The algorithm used on the training set for selecting the optimal four features from the original 240 was similar to that used for the DA case described above and details of the algorithm, developed for identifying optimal spectral bands for sorting pistachio nuts, have also been previously reported (Haff and Pearson, 2007b). A flowchart describing the steps in classifying samples is shown in figure 4. The knn scheme computed Euclidian distances in the four dimensional feature space, from each sample to be classified, to 15 randomly selected kernels and 15 in‐shell nuts. The sample was then classified into a group (kernel or in‐shell) if at least two of its three nearest neighbors belonged to that group. As with the case of the DA algorithm, small in‐shell versus kernel and in‐shell versus kernel cases were handled separately, rather than combining the two in‐shell streams into a single stream. However, in this case the set of features computed for the small in‐shells was applied to the in‐shell samples, rather than computing a separate set of features as no advantage was found in doing so and the complexity of the algorithm and computational requirements were reduced. Results of applying the knn scheme to the validation sets were reported in terms of both the optimal set of features used for classification, and accuracy, which was the inverse of the total error (the sum of fp and fn).
635
Figure 4. Flowchart of the algorithm for selecting the four best features from the training set for the k nearest neighbor scheme. Samples are clas‐ sified by determining Euclidean distances to the 30 randomly selected samples.
RESULTS AND DISCUSSION DISCRIMINANT ANALYSIS CLASSIFICATION Results using the DA routine for distinguishing in‐shell and small in‐shell nuts from kernels when applied to the 500 samples of each class in the validation sets (1000 samples total) are shown in table 1 for values of n from 3 through 12. For the regular in‐shell class, all errors were of the fn type
(in‐shell classified as kernel), with no fp results regardless of the value of n. The best result was obtained with n = 4, with only a single sample misclassified out of 1000 total, corresponding to an accuracy rate of 99.9%. For the small in‐shell class, accuracy rates were significantly lower. In this case best results are interpreted depending on the sorting priorities. The lowest fp rates were achieved with n = 8 or n = 9, with 6 out of 500 small in‐shells classified as kernels. Lowest fn rates occurred with n = 5, with 127 out of 500 kernels classified as small in‐shell. Best overall accuracy was reached with n = 4, with 85% of samples being correctly classified. Table 2 shows the selected combinations of three features and their corresponding pixel intensity values in the three color components for minimizing total error, fp error, and fn error. For each feature, Bmin represents the lowest pixel value for the blue component of the color range while Bmax represents the highest pixel value. The same is true for the green (Gmin, Gmax) and red (Rmin, Rmax) components. This defines a small cube in the RGB color space. The actual feature is the number of pixels in the image that fall within this small cube. For the case of the regular in‐shells, there were no fp errors, and thus the three error categories coincide. Figure 5 illustrates the color ranges that correspond to the features selected by the DA algorithm for n = 4 (best overall accuracy) for separating in‐shell nuts (top) and small in‐shell nuts (bottom) from kernels. Sample images are included for comparison. For n = 4, the features selected were very similar for the two classes of in‐shell nuts. Feature #28 was selected in both cases, and the other two features each differed from their respective counterparts by shifting the blue component a single bin towards the dark, with red and green components remaining unchanged. K‐NEAREST NEIGHBORS CLASSIFICATION For the knn routine, the overall accuracy on the 985 validation set samples was 99.9% for regular in‐shell versus kernels, with one fn result and no fp results. This exactly matches the performance of the DA routine for separating these two classes. For small in‐shell versus kernels, the results were 474 out of 493 correct in classifying kernel samples (fp = 19/493 or 3.9%) and 479 out of 500 correct in classifying in‐shells (fn = 21/500 or 4.2%). This corresponds to a total accuracy of 96%. The four features that gave the best results corresponded to the following histogram bins:
Table 1. DA results for separating kernels from regular and small in‐shell nuts. In‐shell
[a]
Small In‐shell
n
Number fp[a] / 500
Number fn[a] / 500
Total / 1000
Total % Error
% Accuracy
Number fp[a] / 500
Number fn[a] / 500
Total / 1000
Total Error
% Accuracy
3 4 5 6 7 8 9 10 11 12
0 0 0 0 0 0 0 0 0 0
7 1 4 6 4 7 19 26 23 29
7 1 4 6 4 7 19 26 23 29
0.7 0.1 0.4 0.6 0.4 0.7 1.9 2.6 2.3 2.9
99.3 99.9 99.6 99.4 99.6 99.3 98.1 97.4 97.7 97.1
26 17 54 15 19 6 6 19 23 14
188 133 127 142 134 155 233 212 206 201
214 150 181 157 153 161 239 231 229 215
21.4 15.0 18.1 15.7 15.3 16.1 23.9 23.1 22.9 21.5
78.6 85.0 71.9 84.3 84.7 83.9 76.1 76.9 77.1 78.5
fp and fn columns represent the number of errors of that type out of the 500 samples in the validation sets.
636
APPLIED ENGINEERING IN AGRICULTURE
Table 2. Top three feature parameters for lowest overall error, fp and fn for both regular and small in‐shell. n
Feature #
Bmin
Bmax
Gmin
Gmax
Rmin
Rmax
Regular in‐shell
Lowest overall error
4
27 28 48
64 64 128
127 127 191
128 128 192
191 191 255
128 192 192
191 255 255
Small in‐shell
Lowest overall error
4
11 28 32
0 64 64
63 127 127
128 128 192
191 191 255
128 192 192
191 255 255
Lowest fp
8
37 47 239
0 0 96
31 31 127
128 160 160
159 191 191
128 192 192
159 223 223
Lowest fn
5
19 44 69
0 51 102
50 101 152
153 153 153
203 203 203
153 153 153
203 203 203
S S S S
low blue intensity; high green intensity; high blue pixel intensity and low slope; low blue pixel intensity and moderate slope. The kernels had higher counts of pixels with low blue intensity and moderate slope while small in‐shell had higher counts of pixels with high blue intensity and low slope. The two algorithms developed here differed in the fact that the DA routine only used color information, whereas the knn routine made use of color information as well as spatial information in the form of slopes, which generally corre‐ spond to edge detection. For separating regular in‐shells from kernels the results were identical, and thus the DA algorithm is preferred as it is less complex and requires less computa‐ tion. However, increased accuracy for separating small in‐shell nuts from kernels clearly favors use of the knn approach. This research has demonstrated that either or both of the DA and knn algorithms provide a sufficient basis for high‐speed sorting of pistachio nuts based on color imaging. The algorithms could be implemented in real time using an FPGA/sensor combination. The FPGA/sensor would be limited to computing only the three or four features required for classification. This would not be a problem for imple‐
menting the algorithms and sorting at high speeds, but it would require the FPGA to send images to a computer during an initial training. This training is necessary because pixel intensities are specific to the cameras and lighting conditions and of course variations in colors of pistachio nuts from plant to plant and season to season. After training, the FPGA/image sensor could perform the sorting without a computer attached. Future research will be conducted to implement these algorithms in a real time sorting system using an FPGA/image sensor combination. One FPGA image sensor combination can process up to three parallel channels of pistachio nuts for an overall throughput of approximately 210 nuts/s or 1500 kg/h (Pearson, 2009b). The previously reported device based on reflection of light at a single wavelength (Haff and Jackson, 2008) reported 97.5% accuracy for separating regular in‐shell nuts from kernels. No results were reported for small‐inshell. The device based on impact vibration analysis (Haff and Pearson, 2007a), reported the same 97.5% accuracy for small in‐shell nuts, but in that case no results were reported for regular in‐shell. In either case, the 99.9% accuracy for the method described here for classifying regular in‐shell versus kernels is superior to the previously reported methods. However, results were slightly inferior for small‐inshell versus kernels
Figure 5. The ranges of colors corresponding to the three features selected by the DA algorithm for best separation of kernels from in‐shells (top) and small in‐shells (bottom) for the n = 4 case.
Vol. 26(4): 633‐638
637
when compared to the vibration impact sorter. In processing plants, pistachio streams are sorted multiple times to achieve the desired level of purity in any particular stream. With accuracy rates equal or nearly equal, the most important factor in sorting is the throughput, or number of samples per second that can be processed. For the impact vibration system, classification accuracy diminished significantly at feed rates beyond 20 samples per second. No throughput was reported for the single wavelength device, but similar commercial systems have throughputs around 40 samples per second per channel. The color imaging systems reported here are capable of throughputs of around 70 samples per second per channel, so the slightly lower accuracy for the small‐ inshell samples is compensated for by higher speed.
CONCLUSION Two algorithms were presented for high‐speed sorting of pistachio nuts based on features extracted from color images. One was a discriminant analysis (DA) routine that selected features based on the intensities of the pixel color compo‐ nents (RGB). The other used a k‐nearest neighbors (knn) routine that selected features based on both color and slope information, thus making use of the spatial information provided by color images. Both algorithms were able to distinguish regular in‐shells from kernels with 99.9% accuracy. The accuracy declined when sorting kernels from small in‐shells, with 85% accuracy for the DA algorithm and 96% for the knn algorithm. Because knn used both pixel values and slope, it was more robust to the similarities between the kernels and in‐shell. Features derived from these algorithms can be extracted at high speed in real time using an economical FPGA/image sensor combination to generate color images. These algo‐ rithms therefore provide the means for economical high‐ speed separation of in‐shell pistachio nuts from kernels based on color imaging.
REFERENCES Bajwa, S. G., P. Bajcsy, P. Groves, and L. F. Tian. 2004. Hyperspectral image data mining for band selection in agricultural applications. Trans. ASAE 47(3): 895‐907. Bee, S. C., and M. J. Honeywood. 2007. Optical sorting systems. In Detecting Foreign Bodies in Food, 86‐118. M. Edwards, ed. Cambridge, England: Woodhead Publishing Limited. Caltepe, Z., T. C. Pearson, and A. E. Cetin. 2004. Identification of insect damaged wheat kernels using transmittance images. Electronic Letters 41(5): 23‐24.
638
Haff, R. P., and T. Pearson. 2006. Spectral band selection for optical sorting of pistachio nut defects. Trans. ASABE 49(4): 1105‐1113. Haff, R. P., and T. C. Pearson. 2007a. Separating in‐shell pistachio nuts from kernels using impact vibration analysis. Sens. & Instrumen. Food Qual. 1(4): 188‐192. Haff, R. P., and T. C. Pearson. 2007b. An automatic algorithm for detection of infestations in x‐ray images of agricultural products. Sens. & Instrumen. Food Qual. 1(3): 143‐150. Haff, R. P., and E. S. Jackson. 2008. Low cost real‐time sorting of in shell pistachio nuts from kernels. Applied. Eng. in Agric. 24(4): 487‐490. Han, J., and M. Kamber. 2001. Data Mining: Concepts and Techniques. San Francisco, Calif.: Morgan Kaufmann Publishers. Lawrence, K. C., W. R. Windham, B. Park, and R. J. Buhr. 2003. A hyperspectral imaging system for identification of fecal and ingesta contamination on poultry carcasses. J. Near Infrared Spec. 11(4): 269‐281. Lestander, T. A., R. Leardi, and P. Geladi. 2003. Selection of near infrared wavelengths using genetic algorithms for the determination of seed moisture content. J. Near Infrared Spec. 11(4): 433‐446. Mehl, P. M., K. Chao, M. Kim, and Y. R. Chen. 2002. Detection of defects on selected apple cultivars using hyperspectral and multispectral image analysis. Applied Eng. in Agric. 18(2): 219‐226. Pasikatan, M. C., and F. E. Dowell. 2002. Evaluation of high‐speed color sorter for segregation of red and white wheat. Applied Eng. in Agric. 19(1): 71‐76. Pearson, T. C., D. T. Wicklow, and M. C. Pasikatan. 2004. Reduction of aflatoxin and fumonisin contamination in yellow corn by high‐speed dual‐wavelength sorting. Cereal Chem. 81(4): 490‐498. Pearson, T. C. 2009a. Hardware‐based image processing for high‐speed inspection of grains. Comput. Electron. Agric. 69(1): 12‐18. Pearson, T. C. 2009b. High‐speed sorting of grains by color and surface texture. Applied Eng. in Agric. 26(3): 499‐505. Steward, B. L., A. L. Kaleita, R. P. Ewing, and D. A. Ashlock. 2005. Genetic algorithms for hyperspectral range operator selection. ASAE Paper No. 053063. St. Joseph, Mich.: ASAE. United States Department of Agriculture (USDA) Agricultural Marketing Service (AMS) Fruit and Vegetable Division Fresh Products Branch. 1990. United States standards for grades of shelled pistachio nuts. Available at: www.dfaofca.com/ Downloadables/Tree%20Nut/pistshel.pdf. Accessed 10 September 2009. USDA‐NASS (United States Department of Agriculture‐National Agricultural Statistics Service). 2009. Noncitrus fruits and nuts 2008 summary. Available at: usda.mannlib.cornell.edu/usda/ current/ NoncFruiNu/NoncFruiNu‐07‐08‐2009.pdf. Accessed 25 September 2009.
APPLIED ENGINEERING IN AGRICULTURE