pipe welded cylinder head. ..... Ductile cast iron cylinder head driving point measurement set-up. ... ing the base shapes when using cast iron from a half-pipe.
Source identification and noise reduction of a reciprocating compressor; a case history N. Bert Roozen Philips Applied Technologies, High Tech Campus 7, 5656AE Eindhoven, The Netherlands Eindhoven University of Technology, P.O. Box 513, 5600MD Eindhoven, The Netherlands
Joz`ef van den Oetelaar GEA Grasso, Parallelweg 27, 5223AL ’s Hertogenbosch, The Netherlands
Alex Geerlings Theon Vliegenthart Philips Applied Technologies, High Tech Campus 7, 5656AE Eindhoven, The Netherlands A noise source can be very complex in nature. In noise control engineering an essential first step is to identify the strongest contributing noise sources. This paper discusses a practical case history, in which a series of measurement techniques was applied to a reciprocating compressor to identify the strongest sound source. In addition numerical prediction methods were used to give direction towards a lower noise design of the compressor. Structural modifications to the compressor are discussed, leading to a significant reduction of the noise levels. The sound power level of the reciprocating compressor was reduced by 5 dB. Moreover, from a perceptual point of view, customers experience the sound as more robust and more pleasant as well, probably because of shifting frequencies.
1. INTRODUCTION During the development of the Grasso V700 compressor a 4 cylinder prototype was created consisting of bended steel plates welded together, as shown in Fig. 1. The plating for the crankcase had a thickness of 15 mm, whilst the cylinder heads were constructed from 8 mm thick steel plate for the bended parts and 15 mm plating for the end grains. The material used was steel S355J2+N.1 The new assembly is straightforward, allowing a more efficient production as compared to other compressor concepts. Besides, separated cylinder heads have major advantages in terms of thermodynamic behavior. However, it turned out that the steel plated compressor produced an unwanted increase in noise of approximately 6 dB compared to its predecessor, the Grasso 412 compressor, which used a steel pipe welded cylinder head. This paper describes a practical case history of the acoustic analysis and redesign of the compressor to restore former noise levels. Design directions were based on in-situ measurements and numerical simulations. The paper is organized as follows. It starts in Section 2 with an experimental noise analysis, including sound pressure level measurements and sound intensity measurements of the complete compressor to determine the most dominant frequency bands. This is followed by a partial noise source analysis by means of a surface intensity measurement technique to identify the most dominant part of the machine contributing to the dominant frequency band. After that a modal analysis measurement and a modal analysis simulation are presented of the dominant part of the compressor. Finally, in Section 3 a structural modification of the most dominant part of the compressor is discussed. Its implementation was acoustically validated by means of a sound intensity measurement of the complete com90
(pp. 90 98)
pressor, confirming a significant noise reduction. In Section 4 the conclusions are given.
2. NOISE ANALYSIS 2.1. Compressor harmonics For a compressor operating at 1200 rpm, the fundamental frequency of the noise spectrum corresponds to 1200/60=20 Hz. A sound pressure level measurement was performed. Figure 2 shows that the compressor noise was dominated by the fundamental rotational frequency and its harmonics. Only the fundamental and (many) harmonic frequencies of the rotation speed contribute to the spectrum, covering the whole audible frequency range. Therefore, shifting operational speed in order to avoid structural resonances is obviously not an option. Generally speaking, excitation forces are rarely purely sinusoidal in form, so that harmonics appear naturally as can be explained by Fourier series expansion. In this specific case of a compressor it is caused by the fact that the compression in the cylinder is far from smooth, causing an abrupt increase of the pressure inside the cylinder. Moreover, valve noise also attributes to the noise spectrum, which contains many harmonics because of its impulse repetitive character. Excitation due to discrete harmonics is typical in many structural acoustic cases. Though the acoustic noise consists only of discrete frequencies, the dynamics of the structural components of the compressor play an important role. Resonant behavior of structural components of the compressor may increase the structural response. However, the presence of structural resonances is now more obscured compared to cases in which a mechanical system is excited by a more broadband spectrum. International Journal of Acoustics and Vibration, Vol. 14, No. 2, 2009
N. Bert Roozen, et al.: SOURCE IDENTIFICATION AND NOISE REDUCTION OF A RECIPROCATING COMPRESSOR; A CASE HISTORY
Figure 3. A-weighted octave Soundpower Spectrum of Grasso 412 (baseline) and prototype Grasso V700 (proto). Figure 1. Prototype Grasso V700.
P
Unweighted Sound Pressure L [dB] re 20 µPa
80
70
60
50
40
30
20 0
500
1000 1500 Frequency [Hz] ∆f=1.56Hz
2000
Figure 2. Typical sound pressure level at a distance of 1 m, compressor operating at 1200 rpm.
2.2. Total Sound power Sound intensity measurements of the complete compressor were performed to identify the most dominant frequency band. We measured the overall noise spectrum and ranked the various A-weighted frequency octave band contributions. The sound intensity measurements were performed according to ISO 9614-2 (intensity scanning)2 on the Grasso 412 and prototype Grasso V700, using a Br¨uel & Kjaer sound intensity probe kit type 3581, intensity microphone pair type 4181 and a Br¨uel & Kjaer Pulse data acquisition system. The repeatability check and the sound field pressure-intensity indicator check, indicating the quality of the sound intensity measurement, were performed, see Section 3.3. The radiated sound power is presented in Fig. 3, comparing the Grasso V700 prototype with its predecessor, the Grasso 412 compressor, showing the unwanted increase of A-weighted noise levels of approximately 6 dB. For both the Grasso V700 prototype and the Grasso 412 compressor the strongest contributions were found in the 1kHz octave band.
2.3. Partial Noise Source Analysis The next step is a combined operational deflection shape analysis3, 4 and a surface intensity analysis.5 Surface intensity International Journal of Acoustics and Vibration, Vol. 14, No. 2, 2009
analysis is a promising technique for sound power measurements of individual noise sources in the presence of a noisy sound field,6 which was certainly true in the present case due to the complex sound radiation from parts of the compressor. Furthermore, Thrane et al. argue that the combination of both types of measurement techniques can be very useful to perform efficient noise control.7 In this paper we follow that approach by using the surface intensity analysis technique to identify the strongest noise contributors, and the operational deflection shape analysis to judge where and how to decrease the vibration levels and associated noise radiation. Figure 4 shows the test-set up in which the operational deflection shape of the cylinder head was measured. For the operational deflection mode analysis we used one reference accelerometer and one roving accelerometer from Br¨uel & Kjaer, type 4383 combined with a Br¨uel & Kjaer Nexus conditioning amplifier type 2691 (two charge channels, two acoustic channels). In total 30 measurement positions were defined on the cylinder head, with a point to point distance of 12 cm in axial direction and 8 cm in circumferential direction, see Fig. 4. The roving accelerometer had a magnetic foot and could easily be placed elsewhere. Since the cylinder heads were quite warm a glove had to be used to move the roving magnetic accelerometer around. The allowable temperature range of the 4383 accelerometer is from -74 o C up to 250 o C, which was sufficient for measurements on the cylinder heads which typically reach a maximum temperature of 180 o C. Mass loading effects of the accelerometer were negligible for the 8 to 15 mm steel plating, as will be discussed in Section 2.4. 2.3.1. Phase shift errors The phase between the roving accelerometer and the reference accelerometer was stored such that the phase information over the studied partial surface was retained. In this case it was relatively simple to add also a roving microphone and store the phase information of the acoustic field as well. The microphone, a Br¨uel & Kjaer type 4192 combined with a preamplifier type 2669 and a Nexus conditioning amplifier type 2691 (two charge channels, two acoustic channels), was positioned near the accelerometer by means of a microphone stand, at a distance of 2.5 cm to the plate structure. This is significantly less than one quarter of the acoustic wavelength for the frequencies of interest. Combining the surface velocities based upon the accelerometer data with the measured surface pres91
N. Bert Roozen, et al.: SOURCE IDENTIFICATION AND NOISE REDUCTION OF A RECIPROCATING COMPRESSOR; A CASE HISTORY (a)
Figure 4. Surface intensity measurement set-up on the compressor cylinder head.
sures an estimate can be obtained of the local sound intensity near the surface. This technique is referred to as the surface acoustical intensity method.5 An estimate of the partial radiated soundpower of the individual plate segments was obtained by integrating the acoustic intensity over the surface. A source of errors in the surface acoustical intensity method is the phase errors, which can be caused by the instrumentation and by the spacing between the noise radiating structure and the microphone, thus introducing an acoustic time lag. Following McGary and Crocker the acoustic intensity vector I~ can be determined from the one-sided cross-spectral density of pressure and acceleration, Gpa , as follows, taking these phase errors into account:5 Z ∞ 1 Im(Gpa (f ))cos(φ) + Re(Gpa (f ))sin(φ) ~ I = df 2π 0 f (1) where φ is the phase shift error and f denotes frequency. Re and Im denote the real and imaginary parts of a complex quantity, respectively. If there is no phase shift error, φ = 0, the acoustic intensity is proportional to the imaginary part of Gpa : I ∝ Im(Gpa )/f . If a significant phase shift error is present, the true intensity is proportional to I ∝ {Im(Gpa )cos(θ) + Re(Gpa )sin(θ)} /f . Thus, following McGary and Crocker, it is convenient to define the error in intensity in decibels by the following error equation5 ERROR = 10log {cos(φ) +Re(Gpa )/Im(Gpa )sin(φ)} (dB) (2) As concluded in the work of McGary and Crocker the error in the intensity depends not only on the phase shift φ itself, but also on the ratio of the real to the imaginary part of the cross spectrum Gpa . Using the measured cross spectra Gpa , spatially averaged over the 30 different measurement positions, Eq. (2) can be used to investigate the effect of phase errors on the sound intensity estimate, for this specific situation. The error in the intensity caused by an uncorrected phase shift is shown in Fig. 6, which indicates for this specific situation that the impact of the phase errors is not very large for phase shifts between -30o and +90o . This is due to the fact that the reactive part of the sound intensity is relatively small as compared to the active 92
(b)
Figure 5. Experimental results under operational conditions, a) operational deflection shape at 1020 Hz, b) operational pressure distribution at 1020 Hz.
part for this specific case, meaning that the real part of Gpa is much smaller than the imaginary part of Gpa . The fact that the reactive part appears to be small logical as in Section 2.3.2 it will be concluded that the structural wavelength is larger than the acoustic wavelength. This is typical for an efficient sound radiator. According to the technical documentation of the measurement equipment, the phase characteristics of the Br¨uel & Kjaer Nexus 2691 conditioning amplifier (±0.1o ), 4383 accelerometer (±2o ) and 2669 microphone preamplifier (±0.1o ) are relatively small within the frequency range of interest. The microphone can cause a more significant phase error. The typical phase characteristic of the Br¨uel & Kjaer microphone type 4192 is shown in Fig. 7, as specified by the manufacturer.8 From this figure it can be seen that for frequencies between 100 and 2000 Hz the phase error is less than 6o . Thus, it can be concluded that the phase errors due to the instrumentation are relatively small within the frequency range of interest as compared to the phase shift caused by the acoustic time lag that is introduced by the distance of 2.5 cm between the microphone and radiating structure, which would be about 30o at International Journal of Acoustics and Vibration, Vol. 14, No. 2, 2009
N. Bert Roozen, et al.: SOURCE IDENTIFICATION AND NOISE REDUCTION OF A RECIPROCATING COMPRESSOR; A CASE HISTORY 110
5
Lw [A] = 102.3 dB re 1pW Proto Lw [A] = 102.6 dB re 1pW
A−weighted Soundpower [dB]
100
Error in intensity (dB)
0
−5
−10
Cylinderhead (estimate) 90
80
70
60
−15
50 16
−20
−25 −90
31.5
63 125 250 500 1k 2k Octaveband Centre Frequency [Hz]
4k
8k
Figure 8. A-weighted partial sound power estimate of the cylinderhead compared to the overall A-weighted octave sound power spectrum of the Grasso V700 compressor (proto). −60
−30 0 30 Phase shift φ (degrees)
60
90
Figure 6. Error in intensity caused by uncorrected phase shift.
Figure 7. Typical phase response of a Br¨uel & Kjaer microphone type 4192.8
1000 Hz. Fortunately, for this specific situation we have a high active and a low reactive sound field, in which case, according to Fig. 6, the impact of the phase errors between 0o and +60o results in an error of less than 1 dB. For that reason it is sufficient to take only the acoustic time lag into account, using a phase shift of φ = 2π∆l/λ = 2π∆lf /c (3) where ∆l is the distance between the microphone and the radiating surface onto which the accelerometer is mounted, giving a phase shift of approximately +30o at 1000 Hz for ∆l = 2.5 cm. However, in general situations with both a high active and reactive sound field, one should take into account the phase shift due to both the instrumentation and the acoustic time lag as the impact of small changes in the phase shifts on the accuracy of the surface intensity results can be much larger in those cases. 2.3.2. Results The operational deflection shape of the cylinder head structure and the pressure distribution across the cylinder head at the frequencies near 1000 Hz are shown in Fig. 5. The structural deflection shape shows only a few half wavelengths in the cylinder head circumference, and only a single half wavelength in the longitudinal direction of the cylinder head. From Fig. 5 the structural wavelength near 1kHz is estimated to be approximately 55 cm. Compared to the acoustic wavelength in air at this frequency, λ = c/f =34 cm, the structural wavelength is larger. Joining these measurements in proper phase relation, taking into account possible phase shifts, an estimate can be obInternational Journal of Acoustics and Vibration, Vol. 14, No. 2, 2009
tained of the active sound intensity close to the radiating cylinder head using Eq. (1). Eq. (3) is used for the phase error between the microphone and accelerometer. This yields sound intensity estimates in radial direction at the 30 measurement positions. Integrating the sound intensity over the cylinder head surface gives a partial sound power estimate. The partial sound power estimate for the two cylinder heads is shown in Fig. 8. Frequencies above 2000 Hz were not available from the operational deflection shape measurement data. Fortunately, above 2000 Hz the total sound power of the compressor is not significant. From Fig. 8 it can be seen that at the 1kHz acoustically dominant frequency band, the cylinder head contributes significantly. Theoretically, the partial sound power contributions cannot exceed the total sound power of a machine. Apparently, this is violated at 1kHz by 2 dB (with a 0.3 dB total level difference), which is probably due to measurement errors. In conclusion, it can be stated that the cylinder heads dominate.
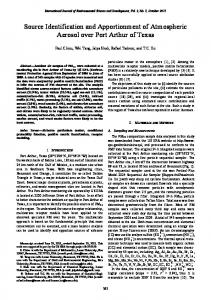
2.4. Driving Point Measurements To obtain information on possible resonant behavior of the sound radiating cylinder head, a driving point measurement was performed. By means of a hammer the structure is excited, and the structural response is measured by means of an accelerometer, as illustrated in Fig. 9. This time the machine is not in operation and therefore the cylinder heads have an ambient temperature. The ratio of the structural velocity v and the force F exerted by the hammer is calculated and presented as the structural mobility Y = v/F
(4)
A high mobility denotes a ”flexible” structure, whereas a low mobility denotes a ”stiff” structure. A high mobility Y may indicate contributing radiators. The driving point measurements were performed using a hammer, which was instrumented with an Aptech force transducer, type AU-01. A Br¨uel & Kjaer accelerometer type 4383 was placed nearby the point of excitation to measure the structural response due to the hammer excitation. Both signals were fed into a Br¨uel & Kjaer Nexus conditioning amplifier type 2691. The effects of mass loading of the accelerometer will now be considered. The classical mass cancelation procedure for 93
N. Bert Roozen, et al.: SOURCE IDENTIFICATION AND NOISE REDUCTION OF A RECIPROCATING COMPRESSOR; A CASE HISTORY
Figure 11. Cylinder head modal analysis measurement set-up, showing the 30 measurement positions.
Figure 9. Cylinder head driving point measurement set-up. −3
10
heads, the crankcase and the separator (see Fig. 1). Knowing that the compressor is acoustically most dominant in the 250 up to 1000 Hz 1/3rd octave frequency bands, as shown in Fig. 3, it is likely that the relatively high mobility of the cylinder heads in the frequency range from 200 – 1200 Hz mark them as acoustically dominant contributers. This observation is also in agreement with the finding of the partial sound power estimate measurements as discussed in the previous section. However, it is stressed that mobility in itself is not sufficient to identify dominant sources. It adds to the insight and gives an indication, knowing the pressure field inside the machine is more or less uniformly distributed.
−4
ms−1N−1
10
−5
10
discharge connection cylinder head crank case cylinder head sidewall separator
−6
10
200
400
600
800 1000 1200 1400 Frequency [Hz] ∆f=1.56Hz
1600
1800
2000
Figure 10. Driving point mobility measurements taken at center of a number of plate-like structural parts of the compressor.
the driving point accelerance is given by9, 10 1 1 = −m H Hmeas
2.5. Modal Analyses (Measurements) (5)
where H is the true accelerance of the structure, Hmeas is the measured accelerance and m is the mass of the accelerometer. In terms of point mobility Eq. (5) can be written as 1 1 = − iωm Y Ymeas
(6)
√ where ω is the angular frequency, ω = 2πf and i = −1. Defining the error due to the mass loading of the accelerometer as (1 − Ymeas /Y ) · 100%, we can write 1 − Ymeas · 100% = ωm|Ymeas | · 100% (7) Y Knowing that the mass of the accelerometer, a Br¨uel & Kjaer type 4383, is less than 20 grams, and looking at the measured point mobilities as shown in Fig. 10 it can be calculated that up to a frequency of 1400 Hz the error due to mass loading is less than 2%. Figure 10 shows the measured structural mobility of a number of plate-like parts of the compressor, including the cylinder 94
Having identified the cylinder heads as the dominant noise source we could support a design modification of the cylinder heads by a detailed modal analysis11 of the cylinder head. The earlier defined grid of 30 points, with a point to point distance of 12 cm in axial direction and 8 cm in circumferential direction, was sufficient to capture the first relevant modes (see Fig. 11). One accelerometer was fixed and the other accelerometer was roving across the 30 measurement positions. Thus, 30 transfer functions from the reference accelerometer to the roving accelerometer type 4383 were obtained, from which the normal modes of the structure were extracted. Figure 12 shows two structural mode shapes having resonance frequencies near 1070 Hz and 1300 Hz. The 1070 Hz mode is most likely contributing significantly to the sound pressure level. The 1070 Hz mode has one half wavelength in the axial direction and three half wavelengths in circumferential direction. The 1300 Hz mode has also one half wavelength in axial direction but four half wavelengths in circumferential direction. International Journal of Acoustics and Vibration, Vol. 14, No. 2, 2009
N. Bert Roozen, et al.: SOURCE IDENTIFICATION AND NOISE REDUCTION OF A RECIPROCATING COMPRESSOR; A CASE HISTORY (a)
(a)
(b)
(b)
Figure 13. Predicted natural modes, Grasso V700 prototype, a) natural mode at 1081 Hz, b) natural mode at 1285 Hz.
efficient natural modes of the steel plated cylinder head at approximately 1000 Hz and decrease the flexibility of the remaining modes. Alternatively, the noise path could be damped by means of double plating. It was decided to abandon the idea of double plating because of possible major problems with weldability and complying with the Pressure Equipment Directive (97/23/EC).14
Figure 12. Experimental modal analysis results, Grasso V700 prototype a) natural mode at 1070 Hz, b) natural mode at 1300 Hz.
2.6. Modal Analysis (Simulations) The structural dynamics of the cylinder heads were simulated with the finite element method,12 ,13 using the software package Pro-Mechanica 3.0. The model was able to predict most of the experimentally obtained normal modes, of which two modes are shown in Fig. 13. These two normal modes correspond well to the experimental modes shown in Fig. 12, thus validating the finite element model, including material properties and boundary conditions.
3. NOISE REDUCTION Noise control of machinery is well described in literature.13 In this specific case the main focus was to get rid of the International Journal of Acoustics and Vibration, Vol. 14, No. 2, 2009
Amongst many others, the following design changes were discussed: • Thickness increase (e.g. from 8 mm to 15 mm) of the head would result in a stiffer (increase of factor 6.6) and heavier (almost doubled) construction. As a result the natural frequencies could be shifted upwards roughly by a factor 2. The added weight reduces the deflection levels due to the excitation. However it was questioned if this would be enough to counteract any increase in radiation efficiency. More practical, the cylinder head would be too heavy to handle. • Use of stiffening ribs on the outside of the cylinder head (for better weldability) would also raise the natural frequencies, but then the radiating surface would increase while the mass effect would be lower. Also in this case a potential danger for an increased radiation efficiency exists. 95
N. Bert Roozen, et al.: SOURCE IDENTIFICATION AND NOISE REDUCTION OF A RECIPROCATING COMPRESSOR; A CASE HISTORY (a)
Figure 14. Base shape of cylinder head. Left: old design (compare Fig. 11). Right: new design (compare Fig. 15).
(b)
Figure 15. Ductile cast iron cylinder head driving point measurement set-up.
• Changing the production method towards casting, since ductile cast iron also adds more internal damping (roughly factor 4). Appropriate material in respect to the Pressure Equipment Directive14 would be ductile cast iron (EN-GJS-40015 ), taken into account the strength/safety factor ratio. However, one should be aware that higher safety factors together with lower mechanical properties compared to steel (S355J2+N1 ) would probably result in higher mass and possibly additional mounting covers. Nevertheless, much more constructive possibilities could be explored in order to cope with requirements regarding sound, flow efficiency, heat transfer, etcetera. By changing the base shapes when using cast iron from a half-pipe to a coupled pipe (see Fig. 14), the natural frequency of the efficiently radiating modeshape was shifted to higher frequencies. Simultaneously the flexibility was decreased significantly. To reduce the noise of the steel plated cylinder head it was decided to redesign the head using ductile cast iron. Ductile cast iron has inherently much more material damping, which should damp the resonant behavior, which was one of the main problems in the prototype. Furthermore, it was decided to construct the cylinder head more compact, thus decreasing the mobility of the head structure. Supported by modal analysis simulations by means of finite elements, the cylinder heads were redesigned. In the next section the results of the finite element simulations are presented. 96
Figure 16. Numerical analysis cast iron cylinder head a) solid model, b) normal mode at 1284 Hz.
3.1. Finite Element Analysis Redesigned Cylinder Heads Due to the more compact design of the cylinder heads, as shown in Fig. 16a the resonance frequencies were shifted upwards. The finite element model predicted the mode as shown in Fig. 13a to be shifted up from 1000 Hz to 1320 Hz, as shown in Fig. 16b . As the excitation spectrum level decreases with increasing frequency, this will reduce the acoustic noise production.
3.2. Verification Driving Point Measurements On Improved Prototype To verify the decrease in mobility for the redesign of the compressor head, driving point measurements were performed on the Grasso V700 pre-production compressor. Figure 15 shows the test set-up of the driving point measurements on the cast iron cylinder head. The results of these measurements are shown in Fig. 17. As compared to the prototype cylinder head, shown with a dotted line, the mobility was reduced by almost a factor 10 (20 dB) at frequencies around 1000 Hz. Moreover, for frequencies above 800 Hz the dynamic behavior was much more damped, though between 400 and 700 Hz there seems to be some resonant behavior present. International Journal of Acoustics and Vibration, Vol. 14, No. 2, 2009
N. Bert Roozen, et al.: SOURCE IDENTIFICATION AND NOISE REDUCTION OF A RECIPROCATING COMPRESSOR; A CASE HISTORY (a)
−3
10
Cast iron cylinder head Steel plated cylinder head
−4
ms−1N−1
10
−5
10
−6
10
200
400
600
800 1000 1200 Frequency [Hz]
1400
1600
1800
2000
Figure 17. Driving point mobility prototype and redesigned cylinder head.
Figure 18. Compressor sound power level of Grasso 412 (baseline), prototype Grasso V700 (proto) and pre-production Grasso V700 (final).
3.3. Validation Intensity Measurements (ISO 9614) To quantify the achieved noise reduction, sound intensity measurements according to ISO 9614-2 (intensity scanning)2 were again performed on the new prototype (see Fig. 19). A Br¨uel & Kjaer sound intensity probe kit type 3581, intensity microphone pair type 4181 and a Br¨uel & Kjaer Pulse data acquisition system were used. The sound power of the source was determined by taking the surface integral across the measurement surface of the normal component of the sound intensity vector. The quality of a sound intensity measurements is indicated by the repeatability index and by the sound field pressureintensity index,2 ,16 .17 The repeatability check consists of two subsequent measurements of the sound power through a measurement surface, scanning with the sound intensity probe in perpendicular oriented scan patterns. The check requires the difference between the two power estimates to be smaller than 3 dB for each 1/3rd octave band and for each scanned sub area. For the 1/3rd octave bands above 100 Hz this requirement was satisfied in almost all individual sub area measurements. For the 1/3rd octave bands below 100 Hz, however, it appeared to be very difficult to comply. Fortunately, in absolute sense the sound power levels in the 50 Hz, 63 Hz and 80 Hz 1/3rd octave bands were not high, and therefor not significant in terms of the overall sound power level of the compressor. International Journal of Acoustics and Vibration, Vol. 14, No. 2, 2009
(b)
Figure 19. Sound intensity measurement set-up (Grasso V700 pre-production with cast iron cylinder heads).
The sound field pressure-intensity indicator checks for the error due to phase mismatches in the measurement chain. The ratio between the sound pressure level and the sound intensity level is called the pressure-intensity index. Two types of pressure-intensity indices exists, i.e. the pressure-intensity index of a measurement, called the sound field pressure-intensity index LpI , and the pressure-intensity index as measured during a calibrate test, the residual pressure-intensity index LpI0 . To obtain an accuracy better than 1 dB due to phase mismatch, a minimum difference of 7 dB between the residual pressureintensity index LpI0 and the sound field pressure-intensity index LpI is required (Grade 3). A minimum difference of 10 dB ensures a maximum error of 0.5 dB (Grade 2). To improve the quality of the sound intensity measurements, i.e. to reduce the sound field pressure-intensity index LpI , the reverberation of the test cell was reduced by means of 10 cm thick foam walls during the verification measurements, as shown in Fig. 19). Nevertheless, it appeared that Grade 3 was the best grade that could be obtained for frequencies at and above 250 Hz, probably due to a relatively low residual pressure-intensity index LpI0 . Thus an accuracy of 1 dB in terms of sound power could be obtained, which might be also one of the reasons for the discrepancy found in Fig. 8. The measured sound power radiated by pre-production (with the redesigned cast iron cylinder head) as well as the prototype (steel plated cylinder head) and its predecessor, the Grasso 12 97
N. Bert Roozen, et al.: SOURCE IDENTIFICATION AND NOISE REDUCTION OF A RECIPROCATING COMPRESSOR; A CASE HISTORY
compressor, are presented in Fig. 18. The 1000 Hz 1/1 octave band sound power levels for the cast-iron pre-production compressor were reduced by 7 dB, resulting in an overall reduction of the A-weighted sound power level in the order of 5 dB as compared to the steel plated cylinder head V700 prototype. As compared to the predecessor, the Grasso 12 compressor, the Grasso V700 pre-production emits an insignificant 1 dB more sound power. From Fig. 18 it can also be seen that the cast iron cylinder head V700 pre-production compressor produces higher noise levels at frequencies below 500 Hz, which, from a perceptual point of view, customers experience as more robust and more pleasant.
4
Richardson, M. H., Is it a mode shape, or an operating deflection shape?, Sound & Vibration Magazine, (1997).
5
McGary, M. C. and Crocker, M. J., Phase shift errors in the theory and practice of surface intensity measurements, Journal of Sound and Vibration, 82(2), 275-288, (1982).
6
Yoshihiro Hirao, Kohei Yamamoto, Kentaro Nakamura and Sadayuki Ueha, Development of a hand-held sensor probe for detection of sound components radiated from a specific device using surface intensity measurements, Applied Acoustics, 65(7), 719-735, (2004).
7
Thrane, N. and Gade, S., Use of operational deflection shapes for noise control of discrete tones, Br¨uel & Kjaer, Technical Review, (1988).
8
Microphone Handbook for the FalconTM Range of Microphone Products, Br¨uel & Kjær BA510512 (1995).
9
Cakar, O. and Sanliturk, K. Y., Elimination of transducer mass loading effects from frequency response functions, Mechanical Systems and Signal Processing, 19(1), 87-104, (2005).
4. CONCLUSIONS 1. The combination of signal analysis (excitation harmonics, operational deflection shape, surface intensity) and system analysis (modal analysis) is an essential approach for a first-time-right analysis. The surface intensity measurement contributed to this by clearly pinpointing the dominant noise source. 2. The unwanted noise increase of approximately 6 dB due to a new plated cylinder head design was successfully resolved. By means of a proper use of noise control engineering insights and analysis tools the dominant noise source in the cylinder head was identified. Using this knowledge the cylinder head was completely redesigned in cast iron which led to a 5 dB noise reduction.
10
Silva, J. M. M., Maia, N. M. M. and Ribeiro, A. M. R., Cancellation of mass-loading effects of transducers and evaluation of unmeasured frequency response functions, Journal of Sound and Vibration 236(5), 761-779, (2000).
11
3. From a perceptual point of view, probably because of shifting frequencies, customers characterize the sound itself as more robust and more pleasant as well.
D.J. Ewins, Modal testing: theory, practice and application (2nd edtion), Research Studies Press Ltd., Great-Britain, (2000).
12
K.J. Bathe and E.L. Wilson, Numerical methods in finite element analysis, Prentice-Hall Inc., Englewood Cliffs, New Jersey, (1976).
13
Crocker, M. J. (Ed.), Handbook of noise and vibration control, John Wiley & Sons, Inc. (2007).
14
97/23/EC, The European Pressure Equipment Directive, (1997).
15
DIN EN 1563, Founding - Spheroidal graphite cast irons, (2008) (2005).
16
Crocker, M. J. and Arenas, J. P., Fundamentals of the Direct Measurement of Sound Intensity and Practical Applications, Acoustical Physics, 49(2), 163-175, (2003).
17
Gade, S., Validity of Inensity Measurements in Partially Diffuse Sound Field, Br¨uel & Kjaer Technical Review, No. 4. (1985).
REFERENCES 1
2
3
98
DIN EN 10025-2, Hot rolled products of structural steels - Part 2: Technical delivery conditions for non-alloy structural steels, DIN-adopted European Standard, (2005) (2004). ISO 9614-2, Acoustics - determination of sound power levels of noise sources using sound intensity - Part 2: Measurement by scanning. International Organization for Standardization, (1996). Dossing, O., Structural Stroboscopy - Measurement of Operational Deflection Shapes, Sound & Vibration Magazine, (1988).
International Journal of Acoustics and Vibration, Vol. 14, No. 2, 2009