BY KIN-YIP CHUN, RICHARD g. KOKOSKI, AND GORDON F. WEST. ABSTRACT. Source scaling relation is studied over the magnitude (mN) range 2.6 to 5.4.
Bulletin of the Seismological Society of America, Vol. 79, No. 1, pp. 015-030, February 1989
SOURCE SPECTRAL CHARACTERISTICS OF MIRAMICHI EARTHQUAKES: RESULTS FROM 115 P-WAVE OBSERVATIONS BY KIN-YIP
C H U N , RICHARD
g.
KOKOSKI,
AND G O R D O N F. W E S T
ABSTRACT
Source scaling relation is studied over the magnitude (mN) range 2.6 to 5.4 using P waves generated by 31 tightly clustered earthquakes in New Brunswick, Canada. The recording stations, six in total, have a 60-points/sec sampling rate and a dynamic range of about 100 dB. They are located at regional distance (188 to 448 km), with a wide azimuthal coverage. The data interpreted consist of 115 spectral ratio curves (2-20 Hz), each obtained in a manner that allows effective cancellation of the effects caused by source radiation pattern, path attenuation, geometrical spreading, instrument error, and variability in site function. The data selected in this study differ from the single-station records used in a previous source-scaling study of Miramichi earthquakes (Chael, 1987) in having: 1) broader distance coverage; 2) greater recording dynamic range; 3) higher Nyquist frequency; and 4) larger data size. We conclude from the observed spectral ratios that source models having an ~-2 high-frequency fall-off (~-square model) are strongly favored by the data over those having an ~-3 high-frequency fall-off (~-cube model) and that stress drop increases with moment at a rate proposed earlier by Nuttli (1983a, b). INTRODUCTION
Spectral scaling relations have been extensively studied over the past two decades (Aki, 1967, 1972; Geller, 1976; Nuttli, 1983a, b; Somerville et al., 1987; Chael, 1987). In eastern Canada where damaging earthquakes characterized by unusually large felt areas (La Malbaie, Quebec, 1925; Timiskaming, Quebec, 1935; Cornwall, Quebec, 1944) occur only occasionally, there is a lack of database to predict the ground shaking when they do occur. In this case, source scaling relations derived from small to moderately large earthquakes can provide an alternative, albeit indirect, means of predicting the ground shaking for larger events. In seismic verification research, measured scaling relations are useful for checking the validity of theoretical source models for earthquakes and underground explosions (Evernden et al., 1986). Reliably established, scaling relations can be used for amplitude normalization of earthquake sources to facilitate studies of seismic wave scattering and attenuation, the knowledge of which is essential in the seismic determination of explosive yields of underground nuclear detonations. Not to be overlooked is the fact that the scaling relations provide constraints on fundamental earthquake source physics, which are unattainable from detailed analysis of individual seismic events. However, as in most other seismic studies involving the use of seismic wave amplitudes, the determination of the source scaling relations is complicated by strong trade-offs among the source spectra, path attenuation, and station effects (which incorporate both the instrument error and station site effects), and by the source radiation pattern effects--especially at high frequencies. In eastern North America where high frequency digital data for even moderate-sized earthquakes (i.e., m N ---- 4.5) are meager, it is difficult to isolate the interfering factors from the parameters of interest, namely, those which characterize the spectral shape of the source excitation function. A further complication, pointed out by Evernden et al. (1986), is that the recorded seismic signals are frequently band-limited in such a 15
16
K.-Y. CHUN, R. J. KOKOSKI, AND G. F. WEST
way that they do not extend much beyond the corner frequencies of the events analyzed. This, according to Evernden et al. (1986), results in underestimation for both the corner frequency and the rate of fall-off of the high-frequency seismic spectrum. Earlier work on mid-plate earthquakes (Kanam0ri, 1979; Liu and Kanamori, 1980; Nuttli, 1983a, b) indicated major differences in the source characteristics between the events occurring in mid-plate regions and the ones occurring near plate margins. The controversy over whether such differences exist appear unresolved by several recent studies (Boore and Atkinson, 1987; Chael, 1987; Somerville et al., 1987). On 9 January 1982 a moderately large earthquake ( r a n ---- 5.8) occurred in Miramichi region of New Brunswick, Canada, followed by a sequence of aftershocks which continued for more than 3 years (Basham et al., 1985). Choy et al. (1983), using teleseismic P waves, estimated the main shock seismic moment to be 4.7 (__ 1.1) × 1024 dyne-cm, a value which is too large by a factor of 1.8, due to their negligence of the free surface correction (Boatwright, personal communication to Boore); Wetmiller et al. (1984) obtained a value of 2.2 (_+0.7) × 1024 dyne-cm from seismic surface-wave data. By comparing the observed with synthetic Pn~ waves, Somerville et al. (1987) gave a main shock moment estimate of 1.3 × 1024 dyne-cm, with an uncertainty factor of 1.5. The results from a July 1983 field survey of Miramichi aftershocks, conducted jointly by Geological Survey of Canada (GSC) (formerly, the Earth Physics Branch, Department of Energy, Mines and Resources of Canada) and USGS, have shown that they were mostly located within a small volume and that they occurred along two conjugate fault planes, one dipping east and the other west (Wetmiller et al., 1984; Basham et al., 1985). The same authors also concluded that, similar to the main shock (Choy et al., 1983), the aftershocks were characterized by nearly pure thrust mechanisms, with roughly north-striking nodal planes dipping from 50 ° to 70 °. These source characteristics imply a similar radiation pattern for the earthquakes associated with the Miramichi sequence which began on 9 January 1982. With the event magnitude being the most notable variable, the Miramichi earthquakes are ideal sources for studying the spectral scaling relations. Chael (1987) carried out a source scaling study of the Miramichi earthquakes using 12 Pn records from a Regional Seismic Test Network (RSTN) station, RSNY, located in the Adirondacks, New York, about 6 ° in epicentral distance from the earthquake source region. He concluded that the data strongly favor the ~-square model. Given the limited dataset he used and the uncertainty associated with the individual spectral ratio measurements, Chael was uncertain as to whether there existed a positive correlation between the stress drop and the seismic moment. His study was also hampered by the bandwidth of the RSNY velocity response (flat between 1 and 10 Hz) and the low, 40-points/sec sampling rate which limits the data Nyquist frequency to 20 Hz. Given the current discussion on the source scaling relations for eastern North American earthquakes, it is imperative that we reexamine the issue using a greatly enlarged dataset to provide for better statistical qualities of the amplitude observations. The source scaling study to be described below follows the data processing and interpretation methods of Chael (1987). Our data differ from Chael's in having: a wide distance coverage (188- to 478-km); a nearly uniform azimuthal coverage; a (24-dB) greater recording dynamic range; a 50 per cent greater Nyquist frequency; and a dataset size nearly tenfold as large.
S O U R C E S P E C T R A L CHARACTERISTICS OF M I R A M I C H I E A R T H Q U A K E S
17
SEISMIC DATA
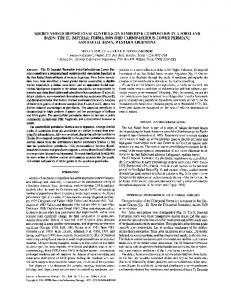
Table 1 lists the 31 Miramichi earthquakes and the six Eastern Canada Telemetered Network (ECTN) stations selected for this study. Also shown in Table 1 are the magnitudes of these events, as provided by the Geophysics Division, Geological Survey of Canada (GSC). The source and station locations are shown in Figure 1. The Miramichi main shock event (raN ----5.8), which occurred on 9 January 1982, is conspicuously absent from Table 1. This is due to an untimely system malfunction of the GSC data acquisition computer, resulting in the unfortunate loss of all digital ECTN records for this event (Shannon, personal communication). Note that all aftershocks listed share precisely the same epicentral location at 47.00 ° latitude and 66.60 ° longitude, according to our GSC-supplied event listing. This location corresponds to the center of the aftershock area, as determined in a joint GSC/USGS field program carried out in July 1983 (Basham et al., 1985). This affershock zone measures 6 km NS by 6 km EW by 7 km deep. According to Wetmiller (personal TABLE 1 EVENTS FOR P n SPECTRAL SCALING Event
Date
Hr
1 2 3 4 5 6 7 8 9 10 11 12 13 14 15 16 17 18 19 20 21 22 23 24 25 26 27 28 29 30 31
28 Nov 1981 09 J a n 1982 11 J a n 1982 12 J a n 1982 13 J a n 1982 15 J a n 1982 17 J a n 1982 26 J a n 1982 27 Feb 1982 01 Mar 1982 16 Mar 1982 31 Mar 1982 08 Apr 1982 11 Apr 1982 18 Apt 1982 28 Apr 1982 02 May 1982 06 May 1982 28 Jul 1982 26 Oct 1982 13 May 1983 10 J u n 1983 11 J u n 1983 04 Jul 1983 01 Sep 1983 17 NOV 1983 24 Feb 1984 30 NOV 1984 15 J a n 1985 05 Oct 1985 21 J a n 1986
05 17 21 01 17 12 13 05 17 09 11 21 04 18 22 06 23 16 05 15 17 04 13 10 18 15 03 05 06 05 02
Origin Time Min Sec 12 27 41 58 56 37 33 00 34 33 14 02 54 00 47 36 31 28 35 31 26 22 47 18 47 32 17 54 46 34 32
03 54 08 01 43 40 56 30 58 57 01 20 34 53 21 02 37 07 37 33 02 39 58 06 21 18 13 22 15 14 26
Latitude (°N) 47.03 47.00 47.00 47.00 47.00 47.00 47.00 47.00 47.00 47.00 47.00 47.00 47.00 47.00 47.00 47.00 47.00 47.00 47.00 47.00 47.00 47.00 47.00 47.00 47.00 47.00 47.00 47.00 47.00 47.00 47.00
Longitude (°W) 66.61 66.60 66.60 66.60 66.60 66.60 66.60 66.60 66.60 66.60 66.60 66.60 66.60 66.60 66.60 66.60 66.60 66.60 66.60 66.60 66.60 66.60 66.60 66.60 66.60 66.60 66.60 66.60 66.60 66.60 66.60
. Stations LPQ(1), MNQ(2), GGN(3), GNT(4), GSQ(5), LMN(6) A t ( S n -- Pn) 29 sec 44 24 46 25 22 t mN: magnitude based on Lg amplitude; rob: body wave magnitude.
Magnitude 3.7 m N t 3.8 m~ 5.4 mbt 3.5 mN 4.0 mN 3.8 mN 3.6 mN 3.3 mN 3.4 mN 3.4 mN 3.5 mN 5.0 mb 3.4 mN 4.0 mN 4.1 mN 3.4 mN 3.3 mN 4.0 mN 3.7 mN 3.5 m y 3.5 mN 3.3 mN 3.4 m~ 2.6 mN 2.6 mN 3.7 mN 3.7 mN 3.7 mN 2.7 mN 3.9 mN 3.4 mN
Stations* 1, 2, 4, 5, 1, 2, 4, 5, 1, 2, 3, 4, 1, 2, 3, 4, 1, 2, 3, 4, 1, 2, 4 1, 2, 4, 5 1, 2, 4, 5, 1, 2, 3 2, 3, 5, 6 1, 2, 3, 4, 1, 2, 3, 4, 1, 2, 5 1, 2, 3, 5 1, 4, 5 3, 5 3, 5 1, 2, 3, 5 1, 2, 3, 5, 3, 5 1, 2, 3, 4, 1, 2, 3, 4, 1, 2, 3, 5 6 3, 5 3, 4, 5, 6 1, 2, 3, 4, 1, 2, 3, 4, 1 2, 4, 5 5, 6
6 6 5, 6 5 5, 6
6
5, 6 5
6 5 5
5, 6 5, 6
18
K.-Y. CHUN, R. J. KOKOSKI, AND G. F. WEST
F
200 km
'r"~/
I
~
GN
(
~
~
.
~