Demonstration Paper
CIKM’18, October 22-26, 2018, Torino, Italy
Spark-parSketch: A Massively Distributed Indexing of Time Series Datasets Oleksandra Levchenko, Djamel-Edine Yagoubi, Reza Akbarinia, Florent Masseglia, Boyan Kolev
Dennis Shasha Dep.of Computer Sc., NYU
[email protected]
Inria & LIRMM, Montpellier, France
[email protected]
ABSTRACT A growing number of domains (finance, seismology, internet-ofthings, etc.) collect massive time series. When the number of series grow to the hundreds of millions or even billions, similarity queries become intractable on a single machine. Further, naive (quadratic) parallelization won’t work well. So, we need both efficient indexing and parallelization. We propose a demonstration of Spark-parSketch, a complete solution based on sketches / random projections to efficiently perform both the parallel indexing of large sets of time series and a similarity search on them. Because our method is approximate, we explore the tradeoff between time and precision. A video showing the dynamics of the demonstration can be found by the link http://parsketch.gforge.inria.fr/video/ parSketchdemo_720p.mov.
CCS CONCEPTS • Computing methodologies → Massively parallel algorithms; Parallel algorithms; • Information systems → Distributed retrieval; Similarity measures; Nearest-neighbor search; Specialized information retrieval;
KEYWORDS time series; indexing; similarity search; distributed data processing; Spark ACM Reference Format: Oleksandra Levchenko, Djamel-Edine Yagoubi, Reza Akbarinia, Florent Masseglia, Boyan Kolev and Dennis Shasha. 2018. Spark-parSketch: A Massively Distributed Indexing of Time Series Datasets . In The 27th ACM International Conference on Information and Knowledge Management (CIKM ’18), October 22–26, 2018, Torino, Italy. ACM, New York, NY, USA, 4 pages. https://doi.org/10.1145/3269206.3269226
1
INTRODUCTION
Time series arise in many application domains such as finance, agronomy, health, earth monitoring, weather forecasting, to name a few. Because of advances in sensor technology, such applications may produce millions to trillions of time series,requiring fast analytical and summarizing techniques. Usually, indexing is at the core of major time series management solutions, as well as analytical tasks (e.g., classification, clustering,
pattern discovery, visual analytics, and others) because indexes enable fast execution of similarity queries, which constitute the core operation of the domain. That core operation is what we want to solve very fast, viz. given a time series, find similar time series (e.g., all those having a correlation above a threshold). Unfortunately, creating an index over billions of time series by using traditional centralized approaches is highly time consuming. For example, our experiments [16] show that iSAX2+ [2], a state of the art index, may take at least one day with one billion time series, or more, in a centralized environment. In centralized systems, one of the most efficient ways to index time series for the purpose of similarity search is to combine a sketch approach [4] with grid structures. Random projection is based on the idea of taking the inner product of each time series, considered as a vector, with a set of random vectors whose entries are +1 or -1 [4]. The resulting sequence of inner products is called a sketch vector (or sketch for short). The goal is to filter pairs of time series by comparing their much shorter sketches, discarding those whose sketch distance is too far. To avoid comparing the sketch of each time series of the database with that of the searched time series, [4] uses grid structures on pairs of sketch entries (e.g., the first and second entry in one grid, the third and fourth in the second grid, and so on) to reduce the complexity of search. Given the sketches s and s ′ of two time series t and t ′ , the more grids in which s and s ′ coincide, the greater the likelihood that t and t ′ are similar. In time series data mining, sketch-based approaches have also been used to identify representative trends [5, 10], maintain histograms [15], and to compute approximate wavelet coefficients [7], etc. An appealing opportunity for improving the index construction time is to take advantage of the computing power of distributed systems and parallel frameworks such as MapReduce [6] or Spark [18]. All aspects of the sketch-based approach are parallelizable: the computation of sketches, the creation of multiple grid structures, and the computation of pairwise similarity. However, a naive parallel implementation of existing techniques would underexploit the available computing power.
2
PARALLEL CORRELATION METHODS
Spark-parSketch [17] presents a parallel solution to construct a sketch-based index over large sets of time series. Spark-parSketch parallelizes every step of algorithm, thus exploiting each available core. This section reviews the sketch / random projection-based method to index time series, with an additional attention to parallelism of index construction both to increase speed and improve quality.
Publication rights licensed to ACM. ACM acknowledges that this contribution was authored or co-authored by an employee, contractor or affiliate of a national government. As such, the Government retains a nonexclusive, royalty-free right to publish or reproduce this article, or to allow others to do so, for Government purposes only. CIKM ’18, October 22–26, 2018, Torino, Italy © 2018 Copyright held by the owner/author(s). Publication rights licensed to ACM. ACM ISBN 978-1-4503-6014-2/18/10. . . $15.00 https://doi.org/10.1145/3269206.3269226
1951
Demonstration Paper
CIKM’18, October 22-26, 2018, Torino, Italy
21
9
Our method is based on the use of random vectors. The basic idea is to multiply each time series (or in a sliding window context, each window of a time series) with a set of random vectors. The result of that operation is a "sketch" for each time series consisting of the distance (or similarity) of the time series to each random vector. Then two time series can be compared by comparing sketches. The sketch approach we advocate is a kind of Locality Sensitive Hashing [8], by which similar items are hashed to the same buckets with high probability. In particular, the sketch approach is similar in spirit to SimHash [3], in which the vectors of data items are hashed based on their angles with random vectors. Our goal (and contribution) is to construct a parallel index by exploiting the sketch approach in a distributed environment for both:
b
s1 6 s1
b
18
b
s2
s2
b
15
3
12
0 9
12
15
18
4
7
10
13
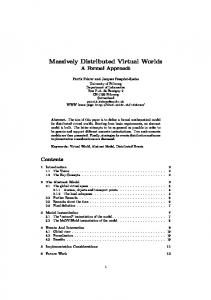
Figure 1: Two series (s 1 and s 2 ) may be similar in some dimensions (here, illustrated by Grid 1 ) and dissimilar in other dimensions (Grid 2 ). The higher their similarity, the larger the fraction of grids in which the series are close.
• better performance (fast index building, compared to approaches from the state of the art, like iSAX2+) • high quality (precision and recall) for similarity search.
2.1
Partitioning Sketch Vectors
In the following, we use correlation and distance more or less interchangeably because one can be computed from the other once the data is normalized. Multi-dimensional search structures don’t work well for more than four dimensions in practice [14]. For this reason, as indicated in Example 1, we adopt a first algorithmic framework that partitions each sketch vector into subvectors and builds grid structures for the subvectors as follows:
The sketch approach [1, 9, 12] provides a very nice guarantee: with high probability a random mapping taking b points in Rm to points in (Rd ) 2b+1 (the (2b+1)-fold cross-product of Rd with itself) approximately preserves distances (with higher fidelity the larger b is). In our version of this idea, given a point (a time series or a windo of a time series) t ∈ Rm , we compute its dot product with N random vectors ri ∈ {1, −1}m . This results in N inner products called the sketch (or random projection) of ti . Specifically, sketch(ti ) = (ti • r1 , ti • r2 , ..., ti • rN ). We compute sketches for t 1 , ..., tb using the same random vectors r 1 , ..., r N . By the Johnson-Lindenstrauss lemma [11], the distance ∥sketch(ti ) − sketch(tj )∥ is a good appproximation of ∥ti − tj ∥. Specifically, if ∥sketch(ti ) − sketch(tj )∥ < ∥sketch(tk ) − sketch(tm )∥, then it’s very likely that ∥ti − tj ∥ < ∥tk − tm ∥. In our approach, we use a set of grid structures to hold the time series sketches. Each grid maintains the sketch values corresponding to a specific set of random vectors over all time series. Let |д| be the number of random vectors assigned to each grid, and N the total number of random vectors, then the total number of grids is b = N /|д|. The distance of time series in different grids may be different. We consider two time series similar if they are similar in a given (large) fraction of grids. Example 1. Let’s consider two time series t 1 =(2, 2, 5, 2, 6, 5) and t 2 =(2, 1, 6, 5, 5, 6). Suppose that we have generated four random vectors as follows : r 1 =(1, -1, 1, -1, 1, 1), r 2 =(1, 1, 1, -1, -1, 1), r 3 =(-1, 1, 1, 1, -1, 1) and r 4 =(1, 1, 1, -1, 1, 1). Then the sketches of t 1 and t 2 , i.e. the inner products computed as described above, are respectively s 1 =(14, 6, 6, 18) and s 2 =(13, 5, 11, 15). In this example, we create two grids, Grid 1 and Grid 2 , as depicted in figure 1. Grid 1 is built according to the sketches calculated with respect to vectors r 1 and r 2 (where t 1 has sketch values 14 and 6 and t 2 has sketch values 13 and 5). In other words, Grid 1 captures the values of the sketches of t 1 and t 2 on the first two dimensions (vectors). Grid 2 is built according to vectors r 3 and r 4 (where t 1 has sketch values 6 and 18 and t 2 has sketch values 11 and 15). Thus, Grid 2 captures the values of the sketches on the last two dimensions. We observe that t 1 and t 2 are close to one another in Grid 1 . On the other hand, t 1 and t 2 are far apart in Grid 2 .
• Partition each sketch vector s of size N into groups of some size |д|. • The ith group of each sketch vector s is placed in the ith grid structure (of dimension |д|). • If two sketch vectors s 1 and s 2 are within distance c × d in more than a given fraction f of the groups, then the corresponding time series are candidate highly correlated time series and should be checked exactly. For example, if each sketch vector is of length N = 40, we might partition each one into ten groups of size |д| = 4. This would yield 10 grid structures. Suppose that the fraction f is 90%, then a time series t 1 is considered as similar to a searched time series t 2 , if they are similar in at least nine grids.
3
INDEXING AND QUERYING TIME SERIES WITH Spark-parSketch
Spark-parSketch1 takes full advantage of parallel data processing, both while constructing indexes and querying them for similarity search.
3.1
Index construction
Time-series index construction on the input dataset D within distributed data processing frameworks proceeds as follows (Figure 2): 1) At the sketch computation stage the dot product of time series t, where t ∈ D, with the random transformation matrix R, where each element r i, j ∈ R is a random variable in {1, −1}, results in a vector of much lower dimension: s j = t j • R. 1 Spark-parSketch
spark-parsketch/
1952
is implemented and available at https://github.com/lev-a/
Demonstration Paper
CIKM’18, October 22-26, 2018, Torino, Italy
Figure 2: Parallel index construction
Figure 3: Parallel query processing
At each node, sketch vectors S D over the input set of time series D are built locally and then partitioned into equal subvectors of given size. Each subvector corresponds to a grid. Thus, each sketch is assigned to a grid cell in each of the grids. 2) At the next stage grouping by grid cell is performed, which requires data shuffling between computation nodes. As a result, each grid cell is mapped to the list of time series identifiers assigned to that cell. 3) We use a set of relational database instances to store the resulting grids G D , previously created and distributed at the nodes.
as to store preliminary data and final results, and thus to overcome the bottleneck of centralized data storing. Spark-parSketch stores grids (the resulting indexes) to a distributed relational storage, setup as a number of PostgreSQL instances. Each Spark worker connects to each of the databases through JDBC and persists the contents of each grid cell as soon as they are identified. This pipelined procedure avoids the in-memory storage of large intermediate datasets, hence reduces the memory consumption during grid construction, thus avoiding memory overflow at Spark workers. Moreover, the embedded feature of RDBMS for indexation provides for more efficient query processing.
3.2
Query processing
Given a collection of queries Q, in the form of distributed time series dataset, and a previously constructed index on a dataset D, we consider the problem of finding time series that are similar to Q in D. We perform such a search in the following steps (Figure 3): 1) The sketches of the time series queries Q are computed in parallel SQ , using the same random matrix R, as for grid construction. The resulting sketches are then partitioned into sub-vectors in parallel. Then the sub-vectors are sent to their appropriate grids and placed in grid cells. 2) Then, the contents of the corresponding grid cells in the index, previously stored as a collection of grids G D , are retrieved from all the database instances in parallel on each node. Thus, if a sub-vector of a query time series q lands in the same grid cell as a database time series d, then d is a possible match for q. Two time series (a query and an indexed one) are considered to be similar if they are assigned to the same grid cell in a large user-tunable fraction of grids. 3) This requires global communication. 4) Because sketching is approximate, each candidate match between a query q and data vector d is checked by performing correlations.
3.3
Figure 4: Spark-parSketch distributed architecture
4
DEMONSTRATION
This demonstration illustrates the quality/performance tradeoff of Spark-parSketch. We present below the mutable and fixed initial parameters, details concerning datasets and demonstration scenarios.
4.1
Parameters and datasets
In this demonstration, some parameters are fixed to default values, while others can be configured by the demo user. The fixed parameters are related to the sketch-based algorithm itself, e.g., dimension of grids, size of sketch, etc., while the configurable parameters include the size of grid cells that some query time series q and database time series d must be both assigned to, for q and d to be considered close enough. Spark-parSketch was evaluated over a real dataset and a synthetic one. The first one is a Seismic dataset which contains 40 million time series. For the purpose of experimentation, we generated synthetic input datasets, whose sizes/volumes vary between
Architecture of Spark-parSketch
Figure 4 illustrates the basic architecture of Spark-parSketch. The project is written in Scala on top of Apache Spark [18], a parallel framework that aims at efficiently processing large datasets. The main components of Spark-parSketch, i.e., Index Construction (IC) and Query Processing (QP), are developed within Spark. Spark is deployed on top of Hadoop Distributed File System (HDFS) [13] in order to efficiently read input time series, query time series, as well
1953
Demonstration Paper
CIKM’18, October 22-26, 2018, Torino, Italy
We compare the performance of Spark-parSketch with parallelized Linear Search algorithm [17], a parallel direct computation of correlation. Attendees will be able to vary configurable parameters and then view the result in terms of performance and quality. The demonstration GUI is divided into a sequence of screens. First, the introductory screens explain the sketch-based method. Next, the GUI enables the user to use drop-downs to modify a set of parameters: size of input sets of time-series, size of batches of query time series, grid cell size (affects only the output of Spark-parSketch) and then to observe the difference in performance (Figure 5). A bar chart compares time performance of the two approaches. Two line charts depict the time series found both using direct correlation and using sketches. The demonstration GUI is available here: http://parsketch.gforge. inria.fr/. The demonstration video is available here: http://parsketch.gforge. inria.fr/video/parSketchdemo_720p.mov.
5
ACKNOWLEDGEMENTS
The research leading to these results has received funds from the European Union’s Horizon 2020 Framework Programme for Research and Innovation, under grant agreement No. 732051.
REFERENCES [1] Dimitris Achlioptas. 2003. Database-friendly Random Projections: JohnsonLindenstrauss with Binary Coins. J. Comput. Syst. Sci. (2003). [2] Alessandro Camerra, Jin Shieh, Themis Palpanas, Thanawin Rakthanmanon, and Eamonn J. Keogh. 2014. Beyond one billion time series: indexing and mining very large time series collections with i SAX2+. Knowl. Inf. Syst. 39, 1 (2014), 123–151. [3] Moses S. Charikar. 2002. Similarity Estimation Techniques from Rounding Algorithms. In Proceedings of the Thiry-fourth Annual ACM STOC. [4] Richard Cole, Dennis Shasha, and Xiaojian Zhao. 2005. Fast Window Correlations over Uncooperative Time Series. In Proc. of the Elev. ACM SIGKDD. [5] Graham Cormode, Piotr Indyk, Nick Koudas, and S. Muthukrishnan. 2002. Fast Mining of Massive Tabular Data via Approximate Distance Computations. In Proc.of the 18th ICDE. [6] J. Dean and S. Ghemawat. 2008. MapReduce: Simplified Data Processing on Large Clusters. Commun. ACM 51, 1 (2008), 107–113. [7] Anna C. Gilbert, Yannis Kotidis, S. Muthukrishnan, and Martin Strauss. 2001. Surfing Wavelets on Streams: One-Pass Summaries for Approximate Aggregate Queries. In Proc. of the 27th VLDB. [8] Aristides Gionis, Piotr Indyk, and Rajeev Motwani. 1999. Similarity Search in High Dimensions via Hashing. In Proc. of 25th VLDB. [9] Piotr Indyk. 2000. Stable Distributions, Pseudorandom Generators, Embeddings and Data Stream Computation. In 41st An. Symp. on FOCS. [10] Piotr Indyk, Nick Koudas, and S. Muthukrishnan. 2000. Identifying Representative Trends in Massive Time Series Data Sets Using Sketches. In Proc. of the 26th VLDB. [11] W. B. Johnson and J. Lindenstrauss. 1984. Extensions of Lipschitz mapping into Hilbert space. In Conf. in MAP. [12] Eyal Kushilevitz, Rafail Ostrovsky, and Yuval Rabani. 1998. Efficient Search for Approximate Nearest Neighbor in High Dimensional Spaces. In Proc. of the 30th Annual ACMSTOC. [13] J. Shafer, S. Rixner, and A. L. Cox. 2010. The Hadoop distributed filesystem: Balancing portability and performance. In IEEE ISPASS. [14] D. Shasha and Y. Zhu. 2004. High Performance Discovery in Time series, Techniques and Case Studies. Springer. [15] Nitin Thaper, Sudipto Guha, Piotr Indyk, and Nick Koudas. 2002. Dynamic Multidimensional Histograms. In Proc. of the SIGMOD. [16] Djamel Edine Yagoubi, Reza Akbarinia, Florent Masseglia, and Themis Palpanas. 2017. DPiSAX: Massively Distributed Partitioned iSAX. In Int. Conf. on Data Mining (ICDM). [17] Djamel Edine Yagoubi, Reza Akbarinia, Florent Masseglia, and Dennis E. Shasha. 2017. RadiusSketch: Massively Distributed Indexing of Time Series. In IEEE Int. Conf. on Data Science and Advanced Analytics (DSAA). [18] M. Zaharia, M. Chowdhury, M. J. Franklin, S. Shenker, and I. Stoica. 2010. Spark: Cluster Computing with Working Sets. In Proceedings of the 2Nd USENIX Conference on Hot Topics in Cloud Computing.
Figure 5: Users can vary the size of input dataset, size of batch of queries and grid cell size. The demo will report back the times of direct computation of correlations vs. sketch filtering followed by computation of correlation. It also evaluates the quality of the sketch-based correlation as defined to be correlation of the 10th time series found by sketches divided by the 10th time series found by direct computation of correlation.
50M to 300M time series. Each object of the synthetic dataset is identified with an identifier ID and consists of 256 points. At each time point, a random walk generator cumulatively adds to the value of the previous time point a random number drawn from a Gaussian distribution N(0,1). Thus the total size of the biggest synthetic dataset is around 300 GB.
4.2
Scenarios
This part of the demo will center around Spark-parSketch performance, in terms of response time and quality. The user can observe the tool performance on a range of input datasets. Experiments were conducted on a cluster2 of 16 compute nodes with two 8 cores Intel Xeon E5-2630 v3 CPUs, 128 GB RAM, 2x558GB capacity storage per node. The cluster is running under Hadoop version 2.7, Spark v. 2.1 and PostgreSQL v. 9.4 as a relational database system. 2 http://www.grid5000.fr
1954