yields spatial filters that are explicitly designed for the classification of ... been successfully used for the classification of EEG recorded during motor im- agery [1].
ESANN'2006 proceedings - European Symposium on Artificial Neural Networks Bruges (Belgium), 26-28 April 2006, d-side publi., ISBN 2-930307-06-4.
Spatial filters for the classification of event-related potentials Ulrich Hoffmann, Jean-Marc Vesin and Touradj Ebrahimi
∗
Ecole Polytechnique F´ed´erale de Lausanne – Signal Processing Institute CH–1015 Lausanne – Switzerland
Abstract. Spatial filtering is a widely used dimension reduction method in electroencephalogram based brain-computer interface systems. In this paper a new algorithm is proposed, which learns spatial filters from a training dataset. In contrast to existing approaches the proposed method yields spatial filters that are explicitly designed for the classification of event-related potentials, such as the P300 or movement-related potentials. The algorithm is tested, in combination with support vector machines, on several benchmark datasets from past BCI competitions and achieves state of the art results.
1
Introduction
As is well known, learning a classification rule can be difficult and time-consuming in high dimensional spaces. Therefore feature extraction and dimension reduction are central components of almost every machine learning system. A good feature extraction method should reduce the dimension of the input data as much as possible while keeping all the information necessary for classification. To this end, usually application dependent prior assumptions are applied in feature extraction methods. A prior assumption that can be applied in the area of electroencephalogram (EEG) based brain-computer interfaces is that the spatial distribution of the EEG remains stable during short epochs. Dimension reduction can then be performed by spatial filtering, i.e. by linearly combining data from all electrodes to form a small set of ‘virtual’ electrodes. A good example of dimension reduction using spatial filtering is the common spatial patterns method (CSP), which has been successfully used for the classification of EEG recorded during motor imagery [1]. CSP determines spatial filters that maximize the temporal variance of data recorded under one condition and minimize the temporal variance of data recorded under a second condition. The success of CSP stems from the fact, that temporal variance in the μ and β frequency bands is an important feature for the classification of EEG signals recorded during motor imagery. For the classification of event-related potentials (ERPs) however, temporal variance is a less useful feature and therefore CSP is not a suitable method. The success of CSP for motor imagery recordings motivated us to propose a supervised dimension reduction algorithm that determines spatial filters for ∗ The
first author was supported by Swiss National Science Foundation grant 2153067852.02.
47
ESANN'2006 proceedings - European Symposium on Artificial Neural Networks Bruges (Belgium), 26-28 April 2006, d-side publi., ISBN 2-930307-06-4.
the classification of ERPs. In contrast to existing spatial filtering methods for ERPs such as independent component analysis [2] or principal component analysis our method is supervised and explicitly designed to compute filters suitable for classification. In addition the algorithm is of low computational complexity and achieves state of the art performance. Another advantage of the presented method is, that it can directly deal with more than two classes; which is not the case for the CSP algorithm. The layout of the rest of the paper is as follows. In Section 2 the computation of the spatial filters is described. In Section 3, results on benchmark datasets are provided, and conclusions are drawn in Section 4.
2
Spatial filters for event-related potentials
In order to compute a set of spatial filters from training data, we propose to maximize the following criterion: J=
tr(Sb ) . tr(Sw )
(1)
This criterion was introduced in [3] and can be interpreted as a measure of the separation between two sets of feature vectors. Maximizing J amounts to maximizing the sum of the squared distances of the components of the mean feature vectors, while keeping the sum of within-class variances of the components of the feature vectors small. We first briefly describe how the above criterion is generally computed and then show how it can be used to obtain spatial filters for ERPs. The general between-class scatter matrix Sb is computed as follows: Sb =
K �
pk (¯ xk − x ¯)(¯ xk − x ¯)T ,
x ¯k =
1 � xi , Nk i∈Ck
k=1
x ¯=
1 � xi . N i∈C
Here feature vectors are denoted by xi , the class conditional mean vectors are ¯, and the pk are the a denoted by x ¯k , the overall mean vector is denoted by x priori class probabilities. The index set Ck contains the indices of all feature vectors belonging to class k and the set C is the union of the Ck . The number of classes is K, and the cardinalities of the index sets are Nk and N . The within-class scatter matrix is the sum of the class conditional covariances: Sw =
K � k=1
pk S k ,
Sk =
1 � (xi − x ¯k )(xi − x ¯k )T . Nk i∈Ck
To obtain spatial filters with the help of Criterion 1, the quantities involved in the computation of Sb and Sw are expressed in terms of EEG signals and spatial filters. We represent EEG epochs containing n samples from m electrodes by m × n matrices Ei . As before the subscript i together with the index sets Ck indicates to which class an epoch belongs. Feature vectors are the result of
48
ESANN'2006 proceedings - European Symposium on Artificial Neural Networks Bruges (Belgium), 26-28 April 2006, d-side publi., ISBN 2-930307-06-4.
spatially filtering one epoch and can be written as the product of a spatial filter f and an EEG epoch: xi = EiT f . We denote further by ei (t) the column vector that contains all the samples at time t from epoch Ei . Now the tth element of the class conditional mean vector x ¯k can be written as: x ¯k (t) = f T¯ ek (t) ,
¯ ek (t) =
1 � ei (t). Nk i∈Ck
Given the above equation, it is easy to derive an expression for the trace of the between-class scatter matrix: �� Sˆb = pk (¯ ek (t) − ¯ e(t))(¯ ek (t) − ¯ e(t))T . tr(Sb ) = f T Sˆb f , t∈T k∈K
Similarly, the trace of the within-class scatter matrix is: tr(Sw ) = f T Sˆw f ,
1 �� � Sˆw = (ei (t) − ¯ ek (t))(ei (t) − ¯ ek (t))T . N t∈T k∈K i∈Ck
Finally, Criterion 1 can be expressed as: J(f ) =
f T Sˆb f . f T Sˆw f
(2)
Equation 2 is a generalized Rayleigh quotient and an optimal f can be found by solving a generalized eigenvalue problem. The solution of the generalized eigenvalue problem is a set of eigenvectors and eigenvalues. Eigenvectors correspond to spatial filters, and the discriminative power of the filters is indicated by the associated eigenvalues. Since the spatial filters usually have to be estimated from noisy training data it can be advantageous to regularize the estimates. In the framework proposed here this can for example be achieved by replacing Sˆw by (1 − λ)Sˆw + λI, where I is the identity matrix. Using large λ amounts to specifying a smoothness prior on the spatial filters. Note that equation 2 strongly resembles the criterion that is used in classical linear discriminant analysis (LDA). If each epoch consist of only one sample from all electrodes, the proposed method is in fact equivalent to LDA. However, if more than one sample per epoch is used, the method is different from LDA and can be seen as an extension of LDA for spatial filter design. The above procedure can also be employed to compute temporal filters for the classification of ERPs. This can be achieved by simply changing the vectors e which contain samples from all electrodes at one point in time to vectors containing samples from one electrode at several points in time. If temporal filters are considered, a close connection to the eigenfilter method [4] can be shown. Due to space constraints we omit a further discussion of the eigenfilter method and temporal filtering.
49
ESANN'2006 proceedings - European Symposium on Artificial Neural Networks Bruges (Belgium), 26-28 April 2006, d-side publi., ISBN 2-930307-06-4.
3
Experiments
3.1
Datasets
The P300 speller datasets from the BCI competitions 2003 and 2004 were used to benchmark the proposed spatial filtering algorithm1 . The idea behind the P300 speller paradigm is, to let users choose symbols from a predefined set of symbols, only by means of their brain-activity [6]. To achieve this, a 6 × 6 matrix of symbols is presented to the user, and rows and columns of the matrix are flashed in random order. The user can select a symbol by counting how often it flashes or simply by concentrating on the flashes of the desired symbol. Each time the desired symbol flashes, a P300 is evoked and can be detected by an appropriate algorithm. 3.2
Preprocessing
Before submitting the data to the feature extraction and learning algorithms the data were bandpass filtered between 0.1Hz and 5Hz with a 4th order Butterworth filter and then downsampled to a sampling rate of 20Hz. Only the first 14 samples were kept for each epoch, this corresponds to a time-window of approximately 660ms after stimulus onset. To reduce the effect of outliers the 5th and the 95th percentile were computed for each channel and values below the lower percentile or above the upper percentile were set to the corresponding percentile. A set of spatial filters was then determined and the data were projected onto these spatial filters. 3.3
Cross-validation
Estimates of hyperparameters and classification accuracy were obtained with a ten-fold cross-validation. In each iteration the percentile values for outlier reduction, the spatial filters, and the parameters of a linear support vector machine (SVM) [7] were learned from the training part of the data2 . To infer symbols in the test set, a score was computed for each candidate symbol. The score was the sum of the values of the SVM decision function for the epochs in which the candidate symbol would have evoked a P300. After the computation of scores for all 36 symbols, the symbol with the highest score was chosen. Since there are three hyperparameters that have to be estimated, a simple heuristic was used to avoid lengthy computations. First the filter regularization parameter λ was set to 0.1 and the SVM hyperparameter and the optimal number of spatial filters were estimated in a cross-validation loop. Then the 1 The
datasets, as well as classification results of the competition winners are available on the BCI competition website [5]. 2 In order to obtain unbiased classifiers the same number of target epochs (in which a P300 was evoked) and non-target epochs (in which no P300 was evoked) was used for training, i.e. only a randomly chosen subset of the non-target epochs was used. This simple approach is clearly suboptimal, however it is sufficient to show the feasibility of our spatial filtering method.
50
ESANN'2006 proceedings - European Symposium on Artificial Neural Networks Bruges (Belgium), 26-28 April 2006, d-side publi., ISBN 2-930307-06-4.
regularization parameter λ for the spatial filters was tuned in a second crossvalidation loop, using the values for the two other hyperparameters found in the first cross-validation loop. 3.4
Results
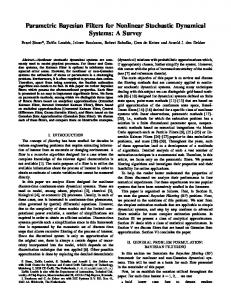
The competition datasets all consist of a training set and a test set. The goal in the competition was to train a classifier on the training set and to predict the symbols in the test set. We simulated the competition conditions and used only the training set to determine classifier parameters and hyperparameters. The estimated values of the hyperparameters for spatial filtering, as well as the cross-validation accuracy are shown in Table 1. For all of the three datasets a large reduction in dimension was possible, namely the 64 original electrodes could be reduced to 1, 13, and 3 ‘virtual’ electrodes. Moreover, for all three datasets the same value for the regularization parameter λ was used. In fact, the cross-validation procedure showed that for values of λ which were close to zero classification accuracy was optimal, lower classification accuracy was obtained for larger values of λ. Examples of spatial filters computed for one of the 2004 P300 datasets are shown in Figure 1. After estimating parameters and hyperparameters on the competition training sets, the classifiers were applied to the competition test sets. The results in Table 1 (column Test) show that the spatial filtering algorithm, in combination with a linear SVM, yields results comparable to those of the competition winners (column Comp.). A further improvement of the performance could possibly be obtained by applying a more sophisticated SVM training procedure, such as the method proposed in [8].
4
Conclusion
We have shown how spatial (or temporal) filters for the classification of ERPs can be obtained as the solution to a generalized eigenvalue problem. The method we proposed is of low computational complexity, leads to a considerable reduction of the number of features, yields results that are physiologically plausible, and is comparable to the state of the art in terms of classification accuracy. Possible future research topics are the application of our algorithm in other BCI paradigms, the development of a more elaborated regularization method and the use of the algorithm for the computation of temporal filters. Dataset 2003 Subject A 2004 Subject B 2004
Filters 1 13 3
λ 0.1 0.1 0.1
CV 100.0 ± 0 95.0 ± 6.5 96.3 ± 6.2
Test 100.0 91.0 97.0
Comp. 100.0 97.0 96.0
Table 1: Classification accuracy and hyperparameters for the three datasets.
51
ESANN'2006 proceedings - European Symposium on Artificial Neural Networks Bruges (Belgium), 26-28 April 2006, d-side publi., ISBN 2-930307-06-4.
Fig. 1: First four spatial filters for Subject A (2004). Shown are the absolute values of the filter coefficients, scaled to [0, 1]. The top row shows the filters with largest (left) and second largest eigenvalues (right). Filters associated to the third and fourth eigenvalues are shown in the second row. The first two filters have large weights in the central, parietal, and occipital regions, which corresponds well to the neurophysiology of the P300.
References [1] H. Ramoser, J. M¨ uller-Gerking and G. Pfurtscheller, Optimal spatial filtering of single trial EEG during imagined hand movement, IEEE Trans. Rehab. Eng. 8:441-446, 2000. [2] N. Xu, X. Gao, B. Hong, X. Miao, S. Gao and F. Yang, Enhancing P300 Wave Detection Using ICA-Based Subspace Projections for BCI Applications, IEEE Trans. Biomed. Eng. 51:1067-1072, 2004. [3] K. Fukunaga Introduction to Statistical Pattern Recognition, Academic Press, London, 1990. [4] P.P. Vaidyanathan and T.Q. Nguyen, Eigenfilters: A New Approach to Least-Squares FIR Filter Design and Applications Including Nyquist Filters, IEEE Trans. Circ. Syst. 34:11-23, 1987. [5] BCI Competition Website: http://ida.first.fhg.de/projects/bci/bbci_official/ index_en.html#competitions. [6] L. A. Farwell and E. Donchin, Talking off the top of your head: toward a mental prosthesis utilizing event-related brain potentials, Electroencephalogr. Clin. Neurophysiol. 70: 510523, 1988. [7] C. Chang and C. Lin, LIBSVM: a library for support vector machines. Software Manual. Software available at http://www.csie.ntu.edu.tw/~cjlin/libsvm. [8] A. Rakotomamonjy, V. Guigue, G. Mallet, and V. Alvarado, Ensemble of SVMs for improving Brain Computer Interface P300 speller performances. In W. Duch, J. Kacprzyk, E. Oja, and S. Zadrozny, editors, Proceedings of International Conference on Artificial Neural Networks 2005, Lecture Notes in Computer Science 3696, pages 45-50, SpringerVerlag, 2005.
52