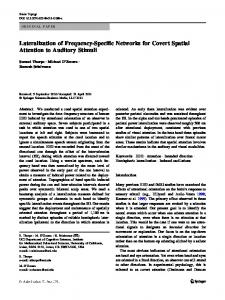
USA. Vol. 77, No. 1, pp. 662-665, January 1980. Neurobiology. Spatial frequency specific interaction of dot patterns and gratings. (visual perception/adaptation).
Proc. Natil. Acad. Sci. USA Vol. 77, No. 1, pp. 662-665, January 1980
Neurobiology
Spatial frequency specific interaction of dot patterns and gratings (visual perception/adaptation)
KAREN K. DE VALOIS* AND EUGENE SWITKESt *Primate Vision Laboratory, Department of Psychology, University of California, Berkeley, California 94720; and tCommittee on Psychobiology, Division of Natural Sciences, University of California, Santa Cruz, California 95064
Communicated by Russell L. De Valois, October 10, 1979
ABSTRACT Adaptation to patterns of paired random dots produces loss of contrast sensitivity to sinusoidal luminance gratings oriented perpendicularly to the dot-pair direction. This adaptation loss is spatial frequency- and orientation-specific and varies with dot-pair separation in a manner predictable from the Fourier spectra of the stimuli and observed characteristics of the visual system. These results support the idea that the visual system acts as a periodicity analyzer with known restrictions and cannot be accounted for by a feature-detector model. When the bars of the test gratings are aligned in the dot-pair direction, there is no adaptational loss at any frequency despite the fact that the adaptation pattern contains significant spectral power at all frequencies in this orientation. This lack of adaptation may be due to inhibitory interactions among channels or to nonlinear effects within local receptive fields.
Adaptation to (i.e., the prolonged viewing of) patterns of paired dots in otherwise random positions temporarily reduces one's ability to detect sinusoidal luminance gratings of certain spatial frequencies and orientations, even though the adaptation patterns and the test gratings bear no obvious resemblance to each other. Numerous other detection and adaptation experiments have been satisfactorily explained by assuming that the visual system contains a series of channels, each of which operates as a spatial frequency band-bass filter (1-5). Most of these experiments, however, have used simple one-dimensional stimuli, and their results can be as readily explained by models (6, 7) that assume that the world is analyzed into such seminaturalistic features as bars of specific width and edges of particular orientation. Stimuli of a more complex form, such as those used in this study, should allow one to test the relative predictive power and generality of these theories. It has been shown (8) that, if a pattern of random dots (which bears no resemblance to a grating in terms of either its apparent features or its Fourier spectrum) is translated in one dimension and then superimposed upon the original pattern, the resultant pattern (composed of correlated pairs of dots in an otherwise random pattern) contains easily perceived texture. These patterns have characteristic two-dimensional power spectra that oscillate along one frequency axis but are relatively constant along the orthogonal axis. Examples of the paired-dot patterns and their power spectra are shown in Fig. 1. Analytically, the Fourier spectrum of such a pattern is:
F(f2,fy) = Fo(fxjfy)f1 + exp(-2riAfx)j
[1]
in which Fo is the transform of the original dot pattern and A is the distance between correlated dots (here we have assumed that the translation is in the x direction). The power spectrum is then: [2] P(f'jfy) = 4F2 cos2irAf. The publication costs of this article were defrayed in part by page charge payment. This article must therefore be hereby marked "advertisement" in accordance with 18 U. S. C. §1734 solely to indicate this fact.
For a random pattern containing k dots, each of unit intensity:
2(f) ;k [crJl(7rorf)12 [3] in whichf2 f2 + fy, oa is the diameter of a single dot, and J, is a Bessel function of order 1. The term is merely a constant factor for infinitesimal points, but for dots of finite extent FO is an orientation independent, slowly decreasing function of spatial frequency in the region of interest. The phase cancellation implied by Eq. 3 requires the dots to be distributed over a region larger than 1/fmin, fmin being the lowest frequency of interest. The two-dimensional nature of the power spectrum is clearly evident in the optical Fourier spectra of Fig. 1 (9). Because we have measured the effects of adaptation to dot patterns on the contrast thresholds of vertically and horizontally oriented test gratings, the spectral power of the dot patterns alongfJ = 0 and fy = 0 is of particular interest (we do not suggest that power is necessarily the visually relevant measure of spectral content but only that any appropriate measures-e.g., the amplitude of the Fourier spectrum-will vary monotonically with power density). Three important features of the dot-pair power spectra can be deduced from Eqs. 1-3 and can be seen in Fig. 1. (i) Along f, = 0 the power is at a relative maximum and slowly decreases with spatial frequency. Here the spectrum is similar to that of an ensemble of completely randomly positioned dots, although it is twice as large due to coherent interactions within pairs. Horizontal test gratings would have spectral power along this axis. (ii) Alongfy = 0 the power oscillates with maxima at fx = 0, + +2/A, .. and minima atfx = d1/2A, +3/2A, .... Vertical test gratings would exhibit spectral power along this axis. (iii) At any frequency the power along fix= 0 is never less than at the corresponding frequency on the fy = 0 axis. Computer-generated dot patterns were imaged on an oscilloscope display and photographed to give high-contrast Kodalith positive transparencies. Test gratings were produced on a Tektronix 654 oscilloscope. Subjects made contrast threshold settings for sinusoidal gratings by the method of adjustment. A total of 22 frequencies were used, ranging from 0.59 to 11.63 cycles/degree (c/deg). Test settings were made before and after 5-min adaptation to one of the random-dot patterns projected onto a screen laterally displaced from the oscilloscope display. The adaptation and test patterns, framed by circular apertures, each subtended a 5.8° visual angle and were viewed monocularly against a white surround. At this viewing distance, the intra-pair separations were 0.30° and 0.160 for the patterns in Fig. 1 a and b, respectively, and the individual dots subtended a visual angle of 0.050. A high level of adaptation was maintained by periodic short-term readaptation between threshold settings. Details of the grating generation and test procedures are reported elsewhere (5). Abbreviation: c/deg, cycles per degree.
662
Neurobiology:
Proc. Natl. Acad. Sci. USA 77 (1980)
De Valois and Switkes
663
a
b
FIG. 1. Dot-pair patterns used as adaptation stimuli (Left) and corresponding Fourier power spectra (Right). Intra-pair dot separation: a, 0.052 X stimulus extent; b, 0.028 X stimulus extent.
Three subjects were used. The one whose data are presented here was a highly trained but naive subject who had served as a paid observer in similar experiments for more than 2 years. He was not told the details of the experiments or any expected results. Data from the other two subjects (K.K.DeV. and E.S.) were similar in character to those presented. The changes in grating contrast sensitivity resulting from adapting to dot patterns are shown in Fig. 2. Three main features are evident in these data: (i) there is little adaptation of any spatial frequency when the bars of the test gratings are oriented in the same direction as the dot pairs (Fig. 2a); (ii) significant, spatial frequency-specific adaptation occurs when the test grating is oriented perpendicularly to the dot pairs (Fig. 2 b and c); and (*M) for an intra-pair separation of 0.30°, contrast sensitivity reduction occurs in the 3-8 c/deg region (Fig. 2b) whereas for a separation of 0.16° adaptation is confined to the 5-8 c/deg region (Fig. 2c). These observations do not depend on the absolute orientation, horizontal or vertical, of the adapting pattern. Although the magnitude of the loss in contrast sensitivity is somewhat less than that observed in sine-sine adaptation experiments, it is highly significant when compared to the observer's lack of change in contrast sensitivity (mean = 0.0, SD = 0.024) after adaptation to a blank field. These results for test gratings perpendicular to the direction of translation (Fig. 2 b and c) are consistent with a spatial fre-
quency analysis model of visual processing. A model based on ideal Fourier detecting channels would relate the extent of contrast sensitivity reduction at a given spatial frequency to the power found at that frequency in the Fourier spectrum of the adaptation pattern. However, any spatial frequency processing carried out by the visual system is clearly at best an approximation to an actual Fourier analysis, and observed nonidealities must be taken into account in interpreting our results. Finite bandwidth is one such nonideality, and, indeed, the breadth or narrowness of the detecting channels serves to distinguish a linear system that can merely be described by Fourier analysis from one which could actually perform such analysis. Adaptation experiments indicate bandwidths of approximately 1 octave (4, 5). Thus, in describing responses to stimuli with continuous Fourier spectra, attention must be given to the amount of spectral input falling within a single channel's bandwidth (10). To facilitate comparison with experiment, we have transformed the power density per cycle (Eq. 2) to power density per octave, P(f)df -fP(f) (d log f) and have plotted this spectral density in Fig. 2. For each of the two dot patterns used as adapting stimuli (Fig. 1) the contrast sensitivity reduction closely follows the rise in spectral density per octave. As predicted, adaptation occurs at lower spatial frequencies when the intra-pair separation is 0.300 than when it is 0.16°. For the 0.30° pattern, adaptation does not reach a minimum
Neurobiology: De Valois and Switkes
664
Proc. Natl. Acad. Sci. USA 77 (1980)
b
C.)
0
1 .
CL a) .40
7UC
1
c
2
'a
-a
.C Cu
.3 n
-
.2 .
1 0
1 -.
1
~
IT 2
4
I\
8*
Spatial frequency, c/deg
FIG. 2. Observed change in contrast sensitivity due to adaptation
[logarithm (preadaptation sensitivity/postadaptation
sensitivity)l
for gratings oriented with stripes in the same direction as the dot-pair translation (a), gratings aligned perpendicular to the dot-pair translation, intra-pair separation 0.300 (b), and gratings perpendicular
0.16° *,
to dot-pair translation, intra-pair separation (c). For each figure the continuous curve is the spectral power density per octave along *, A the relevant dimension. (a)f, = 0 in Fig. 1 a or b; A = (b) fy = 0 in Fig. la; A = 0.30'.(c) fy = 0 in Fig. lb; A= =
0.16°. 0.160.
0.30°;
c/deg (3/2A) but maintains its strength in the 3-8 c/deg unexpected, given the bandwidth of the peaks are separated by only1 octave Adjacent spectral channels. the first and at
5
range. This is not
for both patterns, but for the 0.300 pattern both second maxima (3.30 and 6.60 c/deg) occur within a region of uniformly high contrast sensitivity (3-6 c/deg). Because channel bandwidth is estimated to be about1 octave, channels centered between these two maxima would be stimulated (and thus adapted) by spectral power from both peaks. Because there is insufficient power in the adaptation stimulus to compensate for the lower channel sensitivity at high spatial frequencies, little relative adaptation is observed in the 8-12 c/deg region. The sensitivities of the channels (not included in the theoretical curves of Fig. 2) are presumably specified by the overall contrast sensitivity function which shows maximal sensitivity in the 3-6 c/deg range with reduced sensitivity at higher and lower spatial frequencies. Ref. 5 contains contrast sensitivity functions for the naive observer who participated in the present study. Alternative models based on the detection of bars and edges suggest that the dot pairs predominantly stimulate bar detectors in the peraligned in the direction of translation but not those be sensitive pendicular direction. These bar detectors should notdirection of to gratings whose stripes are perpendicular to the translation. Thus, for the patterns of Fig. 1 such a model would predict no adaptational effects in the detection of verticalof gratings; this is contrary to our observations. The prediction
no adaptational effects for this orientation applies both to the original, highly nonlinear, feature detector theories which assume elements specifically responsive to and narrowly tuned for the width, orientation, and direction of bars and edges and to more recent models utilizing linear bar and edge detectors with wide-band spatial frequency characteristics (11, 12). Although any linear detector may be transformed into a frequency filter, spatial frequency and edge/bar detector models may be distinguished on the basis of the spectral shape and bandwidth of the analyzers and the informational significance suggested for their ouputs. The interactions reported here correlate with the periodicity, not the"barness," of the stimuli. The lack of adaptation when the bars of the test gratings are in the same direction as the dot pairs (Fig. 2a), a surprising and interesting result, is inconsistent with both an ideal Fourier model of visual pattern processing and a feature analysis model. Test gratings in this orientation have Fourier components that lie along the dense central stripe in the spatial frequency spectra of the dot patterns, yet no adaptation occurs. In fact, the power at each frequency in this direction is never less than that at the corresponding frequency in the orthogonal direction where In adsignificant contrast sensitivity reductions are observed. dition, feature analysis models, as discussed above, predict that any interactions that might occur would involve gratings whose stripes are parallel to the dot-pair direction. We find significant adaptational effects only on the detection of gratings perpendicular to the dot pair translation. There are several potential explanations for this lack of effect in the parallel direction. Our data could be accounted for by a spatial frequency analysis model that postulated inhibitory interactions among patterns with slowly channels. If such interactions were bepresent, little varying frequency spectra might expected to produce analogous adaptation at any spatial frequency. This would beproduces a to lateral inhibition in the spatial domain, which marked insensitivity to slowly varying luminance changes (13). (5,
There is other evidence for such inhibitory interactions 14-17). Alternative explanations arise when one considers the nature
of localized receptive fields. Cortical cells showing half-wave rectification, linear spatial summation (at above-background response states), and spatial frequency tuning have been observed in macaques (18). Linear summation of outputs from many such cells with similar receptive fields distributed
spatial throughout the visual field could result in a "global" filter. The average stimulation of such a channel frequency would reflect the magnitude of the power in the relevant spatial frequency region. However, if initial linear spatial summation were followed by nonlinear processing (e.g., simple threshold, probability summation, or nonlinear summation), channels more responsive to peak levels of stimulation in the linearly proposed summating input cells could result. "And" detectors,processing by Barlow (19), are an extreme case of nonlinearpatterns that only those resulting in a channel responsive tofield. the receptive stimulate maximally We have considered the overlap of dot pairs with model rerelative ceptive fields as a function of the position of the dot pair to the receptive field. These model receptive fields were equal in overall length and width and consisted of one elongated inhibitory region flanked by two parallel excitatory regions tuned to match the dot separation. When the dot pairs are parallel to the receptive fields, many of the receptive fields overlap with a single dot. When the dot pairs are in the perpendicular difields encompass any dots
rection, on average fewer receptive
but those that do are more likely to overlap with two dots. Thus,
Neurobiology:
De Valois and Switkes
different distributions of activity occur in the two cases. Although the total activity is the same (as would be required by equal power atfx = 1/A, fy = 0, andfx = 0,f y = 1/A, in Eq. 2), nonlinear peak-enhancing effects would result in greater activity in channels that detect gratings perpendicular to the dot pairs than in those for gratings parallel to the intra-pair orientations, as required by our results. In summary, we have shown that adaptation to dot patterns can produce orientation- and spatial frequency-specific reduction of the contrast sensitivity for sinusoidal gratings. A visual feature detector model based on bar and edge analysis cannot account for these results. However, when finite, constant-octave-bandwidth channels are considered, the frequency specificity of the loss of sensitivity for test gratings perpendicular to the dot-pair orientation is in striking agreement with predictions based on the Fourier spectra of the dot patterns. When the bars of test gratings are in the same direction as the dot pairs there is little adaptation despite a significant overlap of spectral power between the adaptation and test patterns. Inhibition among spatial frequency analyzers or non-linear effects among localized receptive fields could account for this observation. The ability of a spatial frequency model to describe interactions between such widely different stimuli provides strong support for periodicity analysis as an important visual mechanism; however, its failure to predict the lack of adaptation to a pattern with a slowly varying spatial frequency spectrum clearly indicates that the model in its simplest form is insufficient.
We thank R. De Valois, R. F. Quick, Jr., and J. Hamerly for valuable comments and H. Barlow for preprints describing his work. This re-
search was funded by U.S. Public Health Service Grant EY00014 and National Science Foundation Grant BNS 78-86171.
Proc. Natl. Acad. Sci. USA 77 (1980)
665
1. Campbell, F. W. & Robson, J. G. (1968) J. Physiol. (London) 197, 551-566. 2. Campbell, F. W. (1974) in The Neurosciences Third Study Program, eds. Schmitt, F. 0. & Worden, F. G. (MIT Press, Cambridge, MA), pp. 95-103. 3. Robson, J. G. (1978) in Handbook of Perception, Seeing, eds. Carterette, E. & Friedman, M. (Academic, New York), Vol. 5, pp. 81-116. 4. Blakemore, C. & Campbell, F. W. (1964) J. Physiol. (London) 203,237-260. 5. De Valois, K. K. (1977) Vision Res. 17, 1057-1065. 6. Lindsay, P. M. & Norman, D. A. (1972) Human Information Processing (Academic, New York). 7. Neisser, U. (1967) Cognitive Psychology (Appleton, New
York). 8. Glass, L. & Switkes, E. (1976) Perception 5, 67-72. 9. Goodman, J. W. (1968) Introduction to Fourier Optics (McGraw-Hill, San Francisco), pp. 141-184. 10. Legge, G. (1976) Vision Res. 16, 1407. 11. Shapley, R. M. & Tolhurst, D. J. (1973) J. Physiol. (London) 229, 165-183. 12. King-Smith, P. E. & Kulikowski, J. J. (1975) J. Physiol. (London) 247,237-271. 13. Ratliff, E. (1965) Mach Bands: Quantitative Studies on Neural Networks in the Retina (Holden-Day, San Francisco). 14. Tolhurst, D. J. (1972) J. Physiol. (London) 226, 231-248. 15. Tolhurst, D. J. & Barfield, L. P. (1978) Vision Res. 18, 951958. 16. Stecher, S., Sigel, C. & Lange, R. B. (1973) Vision Res. 13,
2527-2531. 17. Henning, G. B., Hertz, B. G. & Broadbent, D. E. (1975) Vision Res. 15, 887-897. 18. De Valois, R. L., Albrecht, D. G. & Thorell, L. G. (1978) in Frontiers of Visual Science, eds. Cool, S. J. & Smith, E. L., III (Springer, Berlin), pp. 544-556. 19. Barlow, H. B. (1978) in Frontiers of Visual Science, eds. Cool, S. J. & Smith, E. L., III (Springer, Berlin), pp. 240-252.