In a recent blog post (2013) entitled âIf Christaller had Google Earthâ¦,â Rafael Periera ..... Tech behind Man of Steel's Metropolis coming to a developer near.
Spatial Transformations and Visualization: Selected Common Threads and Root Concepts Linking Old to New Sandra L. Arlinghaus* and Joseph Kerski** Introduction In the twentieth century, much of mathematics experienced a well-known paradigm shift in moving from a focus on mathematical objects to a focus on transformations of objects. Thus, one sees, for example, linear algebra courses that focus on matrix vector products as linear transformations, rather than on the algebra of the matrices, themselves. As Birkhoff and Mac Lane note in their ground-breaking mid-20th Century classic, A Survey of Modern Algebra, “It is desirable to have at hand not merely the formal operations with matrices, but also the (often neglected) interpretation of the matrices by linear transformations” (p. vi). Indeed, midway through this work (pp. 192-194) the authors develop the Gram-Schmidt Orthogonalization Process to show how to orthogonalize any basis of a Euclidean vector space, leading to the result that all finite-dimensional abstract Euclidean vector spaces have thus been determined. Generally, and beyond the bounds of higher algebra, the individual end results may be the same when comparing a local result (performed with ‘objects’) to a global result (performed with ‘transformations’). The transformational approach covers a broad range of objects simultaneously and thus affords creative opportunity for generalization and for moving ahead in different directions both within and beyond disciplinary boundaries. Also in the 20th Century, transformational approaches appeared in the early work of D’Arcy Thompson (1917) in Biology and of Kurt Lewin (1936) in Psychology. Geographer Waldo Tobler noted these and others in creating his “Map Transformations of Geographic Space” (1961). Our current technological environment offers interesting opportunity to move forward
S. Arlinghaus and J. Kerski
Solstice, Vol. XXVI, No. 1, 2015
rapidly and creatively, along tracks parallel to earlier directions as well as perhaps in unforeseen directions. We look here at some examples, from geometry and set theory, of such creative opportunity, particularly in regard to how things might (or might not) have changed through time….as threads linking old to new. Geometry: Selected Root Concepts Dilation In a recent blog post (2013) entitled “If Christaller had Google Earth…,” Rafael Periera perceptively wondered what Walter Christaller (1933) might have come up with had he had the tools of today during the time when he was alive and intellectually productive. How have tools or concepts changed over time? When we look at cities, we often look at buildings and their positions on the surface of the Earth in relation to road networks, to each other, and to a variety of landmarks. Google Earth, Esri software, and a variety of digital displays show stunning views that aid in such visualization. It is a simple matter to enlarge the view and see things more clearly using such software. What is involved in such enlargement? It is the mathematical transformation of dilation—as is done by an ophthalmologist using drops to dilate (in this case, enlarge) the pupil and take a closer look inside the eye, and a corresponding process is done by the Earth observer to take a closer look inside the city or some other geographic feature. Dilation: To make larger or smaller: similar. In the past, dilation on a map or image could be executed using a tool called a ‘pantograph’ to enlarge or reduce images, or simply to make a 1:1 copy of an image (Figure 1). This awkward-
2
S. Arlinghaus and J. Kerski
Solstice, Vol. XXVI, No. 1, 2015
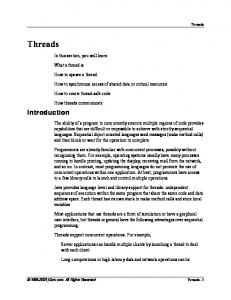
looking contraption, based on parallelograms and similar triangles, could be purchased in drafting and art supply stores. In fact, one could create a pantograph at home with an Erector Set (A. C. Gilbert), as the lead author has done (Terrae Antipodum, 1986, in Arlinghaus and Nystuen), to make a wall map from a smaller map. Its function is based on principles of similar triangles and when the concepts are understood, the tool can be built. One end is fixed at a ‘stationary mount’ (lower left in Figure 1) while a stylus (middle low point in Figure 1) traces an image on a map and the linked pencil (lower right point in Figure 1) traces a larger image on the same sheet, or different sheet, of paper. This contraption is flexible but awkward to use and it takes a good deal of practice to learn to use it to make reasonable enlargements.
Figure 1. Pantograph. Based on an image found at: http://www.marquetry.org/photos_and_illustrations/alfs_pantograph_v1.jpg To see where a pantograph fits with enlarging or reducing a set of buildings in Google Earth, imagine that the stationary mount is the eye of the viewer, and that the tracer point stylus follows the buildings, creating a larger set of buildings beyond the computer screen. Then, imagine that the larger set slides into the screen. The enlargement here is based on a combination of transformations: scale enlargement with pantographic action followed by simple lateral
3
S. Arlinghaus and J. Kerski
Solstice, Vol. XXVI, No. 1, 2015
movement to bring the traced image into view (much as if it had been traced on a separate sheet of paper using a physical pantograph). Another instance of dilation in computer software appears in Adobe PhotoShop. The clonestamp tool may be used, for example, to take an image of a window from one part of a building façade and draw it on another part of the façade that had been covered by a shrub. To do so, one sets the ‘tracer point’ (pantograph terminology) and then traces over the old window while the other end of the tool traces the old window in a new location—in this case, there is no enlargement—just simple 1:1 pantographic transferral. The tools we use today to execute dilation differ from what they once were; the concepts do not—here, the root concepts involve the ideas of dilation, geometric similarity, and parallelism. When one sees the common elements that underlie apparently disparate tools (here, the pantograph, zooming in on Google Earth, and the clone-stamp tool in Adobe PhotoShop), the task of learning to use any of these that might appear to be ‘new’ becomes relatively easy. Indeed, the ability to change scale is now, and has long been, critical in many projects: tools have changed from static ones such as the pantograph to dynamic, often interactive, ones involving the computer. Root concepts have not; those have always been, and remain, dynamic within the human imagination. Translation In explaining dilation as it related to taking a closer look in Google Earth, we visualized a pantographic action followed by sliding in the new image created by that action, as if it were on a separate sheet of paper. The ‘sliding’ action is the mathematical transformation called ‘translation’ (L. trans + latus, carry across). 4
S. Arlinghaus and J. Kerski
Solstice, Vol. XXVI, No. 1, 2015
Translation: To move a shape, without rotating or flipping it. "Sliding.” The shape remains the same, but goes to a different place. This transformation sees geometric uses, as suggested above, as well as linguistic uses in carrying meaning from one natural language to another. As with dilation, this transformation also derives more-than-additive power when coupled with other transformations. Shear When zooming in, in Google Earth, it may become convenient to ‘tip’ the image so that one building does not block another, or it may be useful to ‘tip’ the image to see the skyline in relation to the horizon. Such tipping is an example of ‘shearing’. In a simpler context in the typesetting or word-processing worlds, italicized words are sheared versions of their upright counterparts. Shear: A shear mapping in the plane is a linear map that displaces each point in a fixed direction, by an amount proportional to its signed distance from a line that is parallel to that fixed direction. Indeed, the cartographic world has taken advantage of the upright to italics transformation in creating lettering sets for making inked letters on a map. A ‘Leroy lettering set’ (Figure 2) employed this transformation to create consistent lettering long before there was plastic and drytransfer lettering; both of which predate computerized lettering. The templates in this set contains carved-out backward-sloping letters on a ruler. A scriber composed of a tracer point and a pen (look for similarities to the pantograph and to dilation as a 1:1 transformation) is used. One end of the scriber is placed in a trough in the template to keep the lettering on the same line, while the tracer point follows the backwards-sloping italicized letter to produce an upright inked 5
S. Arlinghaus and J. Kerski
Solstice, Vol. XXVI, No. 1, 2015
letter on the paper of the same size and shape as the italicized letter in the template. It is the principle of shearing that permits such replication.
Figure 2. Note the backward-sloping, italicized letters in the template used to produce straight letters on the paper. http://www.prc68.com/I/Images/Leroy1.jpg Shearing does not change area (or in three dimensions, volume). Thus, angle of viewing is changed, but not building volume, when looking at 3D views of urban landscapes using an interactive program such as Google Earth. Effective use of Google Earth, to look at urban landscapes, may involve a succession of transformations: dilation, translation, and shearing. Indeed, William Kingdon Clifford noted in 1885 that “…we may shear any triangle into a rightangled triangle, and this will not alter its area. Thus the area of any triangle is half the area of the rectangle on the same base and with height equal to the perpendicular on the base from the opposite angle.” Clearly he had identified ‘shear’ as a root concept in looking at geometrical figures. We see it also as a root concept in a variety of contexts, from visualizing 3d buildings to creating consistent lettering. Set Theory: Selected Root Concepts—Union and Intersection Transformations carry objects to other objects. It is convenient to send whole sets of objects to other whole sets of objects. One might talk about the manner in which such transformation takes
6
S. Arlinghaus and J. Kerski
Solstice, Vol. XXVI, No. 1, 2015
place, whether it is one-to-one, onto, and so forth (Arlinghaus and Kerski, 2013, in the context of mapping). The discipline of ‘set theory’ (Hausdorff, 1914) contains a large number of ideas that work in association with the root concepts within the idea of ‘transformation’. Set theory served as the theoretical backbone of the so-called ‘New Mathematics’ prevalent in the U.S. precollegiate mathematics curriculum from the mid-20th century for many decades. Thus, students schooled in set theory were ready to look at trigonometry as a set of functions (transformations) rather that as right-triangle tricks. Further, they were ready to extend the abstract concepts into a variety of realms. Here, we consider only the concepts of set union and intersection, presumably familiar to readers of this journal. In common language, the word ‘or’ is associated with the concept of set union, and the word ‘and’ is associated with the concept of set intersection. There are, however, two forms of the word ‘or’: the inclusive and the exclusive forms. In mathematical language, it is the inclusive form that is assumed (either a or b, or both). In legal language or elsewhere it may be that the exclusive form is assumed (either a or b, but not both). Distinctions such as this one that assign uncommon meaning to common words can cause difficulty. They appear not only in the academic world but in all worlds. In the world of urban planning, for example, the phrase ‘affordable housing’ has a very specific legal meaning determining price ranges that might not be viewed as ‘affordable’ (used in the common sense manner). Thus, ‘affordable housing’ might be quite different from ‘reasonably-priced housing.’ It is good to be clear at the outset what is meant; some disciplines use words that clearly beg the reader to ask questions…’do you want to buy a used betatron’ will cause a prospective buyer to ask questions that ‘do you want to buy an affordable house’ will not.
7
S. Arlinghaus and J. Kerski
Solstice, Vol. XXVI, No. 1, 2015
Here, we illustrate using GIS software a case where the reader must take care to understand the words being used. The ‘Union’ command in the software transforms the image on the left, in Figure 3, to the image on the right: red and yellow regions on the left blend to make the entire region become orange.
Figure 3. Union transformation in a GIS environment. The area covered follows the concept of set-theoretic amalgamation. The blending of color is an added feature. The ‘Intersect’ command, on the other hand (Figure 4), takes the two regions on the left and transforms them to only the region in common and colors it orange.
Figure 4. Intersection transformation in a GIS environment. The area covered follows the concept of set-theoretic intersection. The blending of color is an added feature.
8
S. Arlinghaus and J. Kerski
Solstice, Vol. XXVI, No. 1, 2015
The set-theoretic ‘union’ and ‘intersection’ are strictly interpreted in determining the region that gets colored; coloring is not part of the set-theoretic terminology and is a nice feature added in the software (Esri, ArcGIS, v. 10.2). Another related feature in mapping software (Esri, ArcGIS, v. 10.2) involves Boolean ‘Or’ and ‘And’ operations. The ‘Or’ operation corresponds to the concept of set-theoretic ‘union’ while the ‘And’ operation corresponds to set-theoretic intersection. The figures below show where these set-theoretic root concepts appear in this case. In Figure 5, the Boolean ‘Or’ operation transforms the pair of rasters (grids) on the left to the raster on the right. If any input cell on the left, in either raster, has NoData, then the corresponding output cell on the right also has NoData. We function only with situations in which there is available data in what is being combined. Where there is data in paired input locations, the Or operation combines as one would expect from set-theoretic union. Thus, the pair (non-zero, 0) goes to non-zero (represented as 1); (0, non-zero) goes to non-zero; (non-zero, non-zero) goes to non-zero. Only (0,0) goes to 0.
Figure 5. The Boolean ‘OR’ transformation applied to a raster. In Figure 6, the two rasters (grids) on the left combine to form the raster on the right under the transformation of Boolean And. Again, if any input cell on the left, in either raster, has NoData, then the corresponding output cell on the right also has NoData. We function only with 9
S. Arlinghaus and J. Kerski
Solstice, Vol. XXVI, No. 1, 2015
situations in which there is available data in what is being combined. Where there is data in paired input locations, the And operation combines as one would expect from set-theoretic intersection. Here, the pair (non-zero, 0) goes to 0; (0, non-zero) goes to 0; (0, 0) goes to 0. Only (non-zero, non-zero) goes to non-zero (represented as 1).
Figure 6. The Boolean ‘AND’ transformation applied to a raster. There are many more zeroes in Figure 6 than there are in Figure 5; more has been ‘cut out’ (coded 0) as would be expected from the parallel with Figures 4 and 3 and the associated root set-theoretic concepts. In spatial analysis within a geographic information systems environment, for example, the use of the “And” operator yields vastly different results from the “Or” in raster calculation. If an analyst were researching soil erosion in the Loess Hills north of Omaha, Nebraska (Figure 7), for example, a grid of elevation values might be queried to select those cells having an elevation of at least 350 meters (Figure 8).
10
S. Arlinghaus and J. Kerski
Solstice, Vol. XXVI, No. 1, 2015
Figure 7. Loess Hills of Omaha, Nebraska
Figure 8. Cells having an elevation of over 350 meters. From the elevation, a slope grid might then be created and a query made on the slope grid to select land having 10 degrees of slope or more (Figure 9).
11
S. Arlinghaus and J. Kerski
Solstice, Vol. XXVI, No. 1, 2015
Figure 9. Land having 10 degrees of slope, or more. For a raster grid indicating which land was at an elevation of at least 350 meters and having a slope of at least 10 degrees, the & (and) operator was used in a raster calculation, resulting in the land indicated in blue (Figure 10).
Figure 10. Use of the AND operator on slope and elevation grids. 12
S. Arlinghaus and J. Kerski
Solstice, Vol. XXVI, No. 1, 2015
If the | (or) operator had been used instead, the resulting grid (Figure 11) yields land that contains either a high elevation and also land where the slopes are steep.
Figure 11. Use of the OR operator on slope and elevation grids.
In Figures 5 and 6 we saw how the differences between the AND and OR operators played out in a tiny swatch of pixels—in a four-by-four array. Notice how those differences enlarge when looking at real maps of broad areas, such as in Figures 10 and 11. It is critical to understand seemingly simple root concepts such as the words ‘and’ and ‘or’ in order to make good decisions in mapping (and probably elsewhere, as well). Reflection
It is not uncommon to see forward interdisciplinary movement proceed more slowly in practice than in theory. Part of such a lag is perhaps due to a certain hesitancy to acquire new software; the new tools, interface, and methods appear to be very different from the comfortable older
13
S. Arlinghaus and J. Kerski
Solstice, Vol. XXVI, No. 1, 2015
versions. When one views this process as a transformation from one software package to another the transition may be made easier by identifying root mathematical concepts that link the old spatial tool to the new one (Arlinghaus and Kerski, 2013). In this article, we offered studies suggesting a few root concepts to illustrate this idea and hope that they will encourage the thoughtful reader to look for more in whatever interests him/her in the real world. Indeed, at a very broad intellectual scale, we might consider that we are immersed today in a paradigm shift, similar to that noted in shifting the mathematical focus from ‘object’ to ‘transformation’, but with regard to all information: in that view, a traditional library is a collection of objects (books, magazines, etc.); the Internet is a collection of transformations (links).
14
S. Arlinghaus and J. Kerski
Solstice, Vol. XXVI, No. 1, 2015
Citations and References for Further Reading
Arlinghaus, S. and Kerski, J. 2013. Spatial Mathematics: Theory and Practice through Mapping. Boca Raton: CRC Press. Arlinghaus, S. and Nystuen, J. 1986. Mathematical Geography and Global Art: the Mathematics of David Barr’s Four Corners Project. “Terrae Antipodum,” Appendix C. Ann Arbor: Institute of Mathematical Geography. Available at http://www.imagenet.org/ Arlinghaus, S. 2003. “Ann Arbor, Michigan: Virtual Downtown Experiments, Part II.” Solstice: An Electronic Journal of Geography and Mathematics. Volume XIV, Number 2. Available at http://www.imagenet.org/ Batty, Michael. Profile, University of London. http://iris.ucl.ac.uk/iris/browse/profile?upi=JMBAT23 Birkhoff, G. and Mac Lane, S. 1961. A Survey of Modern Algebra. New York: MacMillan. Christaller, Walter. 1933. Die zentralen Orte in Süddeutschalnd. Jena: Gustav Fischer. Clifford, W. K. 1885. Common Sense and the Exact Sciences, page 113. ComputerWorld. 2013. Tech behind Man of Steel’s Metropolis coming to a developer near you. http://www.computerworld.com.au/article/525998/tech_behind_man_steel_metropolis_comi ng_developer_near/ Coxeter, H. S. M., 1961, Introduction to Geometry. New York: MacMillan. Coxeter, H. S. M., Emmer, M., Penrose, R., and Teuber, M. L. eds. 1986. M. C. Escher: Art and Science. Amsterdam: North-Holland. Esri. Changing Geography by Design: Selected Readings in GeoDesign. http://www.esri.com/library/ebooks/GeoDesign.pdf Gilbert, A. C . Erector Set. Hausdorff, F. 1914. Grundzüge der Mengenlehre. Leipzig: Verlag Veit & Co. Herstein, I. N. 1975. Topics in Algebra, New York: Wiley. Kerski, Joseph J. 1993. The impact of the Bruce R. Watkins Roadway Project on Neighborhoods in Kansas City, Missouri. Master’s Thesis. University of Kansas. Keuffel & Esser, Leroy Lettering Set. Lewin, Kurt. 1936. Principles of Topological Psychology. New York: McGraw-Hill. Loeb, Arthur. 1976. Space Structures: Their Harmony and Counterpoint. Reading, MA: Addison-Wesley. McCloskey, Paul. 2013. Esri’s CityEngine eases urban planning mapmaking in 3-D. http://gcn.com/articles/2013/12/18/esri-cityengine.aspx M.I.T. Media Lab. https://www.media.mit.edu/ Morris, E. Scott. Ongoing work on fractal measures of the 3D City, U. Texas, Dallas. Penn State. Geodesign. https://geodesign.psu.edu/ Periera, Rafael, 2013. Urban Demographics Blog, If Christaller had Google Earth… http://urbandemographics.blogspot.co.uk/2013/10/if-christaller-had-google-earth.html 15
S. Arlinghaus and J. Kerski
Solstice, Vol. XXVI, No. 1, 2015
Thompson, D’Arcy Wentworth. 1917. On Growth and Form. Cambridge University Press. Tobler, Waldo R. 1961. Map Transformations of Geographic Space. University of Washington, Department of Geography. Weyl, Hermann. 1952. Symmetry. Princeton: Princeton University Press.
*Dr. Arlinghaus is Adjunct Professor, School of Natural Resources and Environment, University of Michigan, Ann Arbor, and in Institute for Research on Labor, Employment and the Economy, University of Michigan, Ann Arbor. **Dr. Kerski is Education Manager, Esri, 1 International Court, Broomfield CO 80021-3200, USA
16