sustainability Article
Spatiotemporal Variation in Full-Flowering Dates of Tree Peonies in the Middle and Lower Reaches of China’s Yellow River: A Simulation through the Panel Data Model Haolong Liu 1 , Junhu Dai 1 and Jun Liu 2, * 1 2
*
ID
Key Laboratory of Land Surface Pattern and Simulation, Institute of Geographic Sciences and Natural Resources Research, CAS, Beijing 100101, China;
[email protected] (H.L.);
[email protected] (J.D.) Tourism School, Sichuan University, 24 South Section 1 Ring Road No. 1, Chengdu 610065, China Correspondence:
[email protected]
Received: 15 June 2017; Accepted: 28 July 2017; Published: 1 August 2017
Abstract: The spring flowering of tree peony (Paeonia suffruticosa) not only attract tens of million tourists every year, but it can also serve as a bio-indicator of climate change. Examining climate-associated spatiotemporal changes in peony flowering can contribute to the development of smarter flower-viewing tourism by providing more efficient decision-making information. We developed a panel data model for the tree peony to quantify the relationship between full-flowering date (FFD) and air temperature in the middle and lower reaches of China’s Yellow River. Then, on the basis of the model and temperature data, FFD series at 24 sites during 1955–2011 were reconstructed and the spatiotemporal variation in FFD over the region was analysed. Our results showed that the panel data model could well simulate the phenophase at the regional scale with due consideration paid to efficiency and difficulty, and the advance of peony FFD responded to the increase in February–April temperature at a rate of 3.02 days/1 ◦ C. In addition, the simulation revealed that regional FFDs followed the latitudinal gradient and had advanced by 6–9 days over the past 57 years, at the rate of 0.8 to 1.8 days/decade. Among sub-areas, the eastern forelands of Taihang Mountains and Luliang Mountains showed more FFD advances than the other areas. Keywords: tree peony; full-flowering date; panel data model; spatiotemporal variation; climate change; smarter tourism; decision-making information
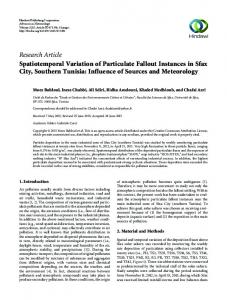
1. Introduction Phenological events, which are independent of instrumental records, could serve as bioindicators of climate change [1,2]. Numerous studies in Europe and North America indicated that spring phenophases have advanced to various extents at mid- and high latitudes in recent decades [3–5]. Similar conclusions were also made in Chinese literature [6–8]. These studies also provided insight into how future climate changes may manifest in biological systems. Among these studies, ornamental plants and economic plants in China have received a few attention (e.g., [9–11]). However, most of related studies were still on local scales. By comparison, scaling phenology from the local to the regional level has been an international trend in oversea studies [12,13]. Therefore, further phenological investigations on the two kinds of plants in China are still necessary [14]. Tree peony (Paeonia suffruticosa) is one of the most attractive native ornamental plants in China (Figure 1A). Furthermore, it is also an important economic plant with medicinal and oil-utilized values, which is especially attractive to elderly and female tourists. In 2017, the peony festival in Luoyang alone attracted about 24.94 million tourists and generated 22.35 billion RMB incomes. Nevertheless, the related seasonal tourism is vulnerable to climate changes. The starting dates of peony festival in Sustainability 2017, 9, 1343; doi:10.3390/su9081343
www.mdpi.com/journal/sustainability
Sustainability 2017, 9, 1343 Sustainability 2017, 9, 1343
2 of 12 2 of 12
peony festival in Luoyang advanced from5 Apr. 15 to30Apr. 5 in recent years,of due to the impact Luoyang has advanced fromhas April 15 to April in recent years, due to the30impact global warming. of global warming. In addition, thewas festival date, wastodecided by phenophases reference to the spring In addition, the festival date, which decided bywhich reference the spring of the last phenophases of the last year, sometimes a little later than the flowering. a year, sometimes occurs a little earlier oroccurs later than theearlier actualorflowering. As actual a result, tourists As may result, tourists may not happen to travel in the best flower-viewing period for tree peonies,negative making not happen to travel in the best flower-viewing period for tree peonies, making a potential aeffect potential negative effect onDisappointing visiting experiences. Disappointing experiences havetourist been on visiting experiences. visiting experiences havevisiting been proved to restrain proved restrain tourist spending discourage tourists from revisiting [16]. Therefore, in spendingto[15] and discourage tourists[15] fromand revisiting [16]. Therefore, in order to increase the economic order to increase theof economic and social efficiency of the flower-viewing tourism, designs of and social efficiency the flower-viewing tourism, related designs of landscape andrelated travel route need landscape and travel route need more spatiotemporal knowledge of florescence than ever. more spatiotemporal knowledge of florescence than ever. At present, observation data on peony florescence are lacking in many places places of China. present,the theactual actual observation data on peony florescence are lacking in many of Considering that phenological models are the method thatthat cancan project China. Considering that phenological models areonly the only method projectinto intothe thefuture future or reconstruct the past [17], we utilized a new kind kind of of phenological phenological model—the panel data model—to quantify the relationship between temperature and full-flowering date (FFD), and reconstructed the spatiotemporal spatiotemporal variation variation in peony FFD in stations. The applications of this model for phenological studies in China have not been reported, but it can also provide a good accuracy in prediction like the process-based model. In the meantime, it is simpler to set up than the process-based model. The reconstructed spatiotemporal variation in peony FFD upscaled peony phenology from the single site to the the larger largerregion, region,and andextrapolated extrapolated results to the time period beyond the actual observation. thethe results to the time period beyond the actual observation. This This willonly not only contribute tounderstanding our understanding of peony phenology changes during 1955– studystudy will not contribute to our of peony phenology changes during 1955–2011 2011 which were unknown in thebut past, also provide insight how peony florescence will which were unknown in the past, alsobut provide insight into howinto peony florescence will response response to the futurechanges. climate changes. It couldthe provide the flower-viewing tourism with a scientific to the future climate It could provide flower-viewing tourism with a scientific basis on basis on its adaptation and mitigation policies aimthe toimpact lessen of theclimate impactchange, of climate change, its adaptation and mitigation policies that aim tothat lessen promote the promote the tourism management and be smarter, and enrich tourists experiences. tourism management and services to beservices smarter,toand enrich tourists experiences.
Figure 1. (A) (A) The The photograph photograph of of peonies peonies viewed viewed by by people; people; (B) (B) the the distribution distribution area area of of Zhongyuan Zhongyuan Figure 1. Peony in China; and (C) phenological and meteorological meteorological observation observation stations. stations.
2. 2. Materials Materials and and Methods Methods 2.1. Phenological and Meteorological Data Twelve phenological data sets in the middle and lower reaches reaches of of the the Yellow Yellow River (Figure (Figure 1B,C) 1B,C) Twelve were used used in inthis thisstudy studytoto analyze spatiotemporal variation in peony This choice was analyze thethe spatiotemporal variation in peony FFD.FFD. This choice was made because the most famous cultivar group of tree peonies in China—Zhongyuan Peony—is traditionally grown in this warm-temperate region [18]. Two hundred and twenty observations were
Sustainability 2017, 9, 1343
3 of 12
made because the most famous cultivar group of tree peonies in China—Zhongyuan Peony—is traditionally grown in this warm-temperate region [18]. Two hundred and twenty observations were collected from1963 to 2011. The geographic location and observations of each station were provided in Table 1. In addition to date series from Heze and Shijiazhuang as well as Kaifeng, most of the other observations are derived from the China Phenological Observation Network (CPON), which is a nationwide system of phenological monitoring. Date series from Heze were mainly picked out from the previous literatures [19–21], while those from Shijiazhuang were obtained from the Shijiazhuang phenological data platform. Some reports in local newspapers also contributed 45 observations to data sets. All the observations conformed to the same standard of full flowering: at least 50% of flowers are in full bloom [22]. Table 1. The summary of peony FFD dataset at each station. Station
Province
Beijing Shanhaiguan Shijiazhuang Xintai Kaifeng Luoyang Xi’an Yulin Heze Tai’an Zibo Taigu
Beijing Hebei Hebei Hebei Henan Henan Shaanxi Shaanxi Shandong Shandong Shandong Shanxi
Location 40◦ 010 40◦ 020 38◦ 010 37◦ 040 34◦ 460 34◦ 400 34◦ 130 38◦ 140 35◦ 170 36◦ 100 36◦ 530 37◦ 300
N, 116◦ 200 N, 119◦ 440 N, 114◦ 250 N, 114◦ 300 N, 114◦ 200 N, 112◦ 250 N, 108◦ 580 N, 109◦ 440 N, 115◦ 290 N, 117◦ 010 N, 118◦ 140 N, 112◦ 370
E E E E E E E E E E E E
Elevation (ma. s. l.)
Period
Observations
116 45 84 77 25 138 438 1045 55 155 33 796
1963–2011 1967–1972 1983–2008 1985–1996 2006–2010 1964–2011 1963–2011 1965–1966 1963–2011 1982–1989 1966–1967 1964–1966
40 6 15 12 5 43 35 2 49 8 2 3
To construct and evaluate the panel data model, we used mean monthly temperatures data of 1963–2011 from 12 cs, which are located nearby the above phenological stations. After the model validity test, temperatures data from other 12 meteorological stations (Figure 1C) were used to reconstruct FFD series in the study area. All meteorological data were obtained from the China Meteorological Data Sharing Service System (http://cdc.cma.gov.cn/). 2.2. Methods 2.2.1. Model Construction The term “panel data” refers to the pooling of observations on a cross-section of individuals over several periods [23]. The regional data on the FFD of Zhongyuan Peony and its climate factors are fully consistent with the essential trait of panel data sets. According to the biometrics and statistics literature, panel data sets possess many advantages over conventional cross-sectional or time-series data sets [24]. For example, panel data can give more variability, more degrees of freedom and more estimate efficiency. Remarkably, this model can control individual heterogeneity, whereas time-series and cross-section studies may run the risk of obtaining biased results, e.g., see [25,26]. Panel data models haven’t been widely applied in the phenological field, so we tried this new approach to peony FFD. The subject we are interested in is the quantitative relation between the annual FFDs of tree peonies {Yit } and the related temperature factor {Xit }. Here, Yit was measured as days of deviation from 23 April (same as below), which is the mean value of all FFD data in the distribution area during 1963–2011. For the Zhongyuan peonies, the temperature condition during February–April is the predominant factor controlling FFD (e.g., [18,19]). Thus, February–April mean temperature was selected as the only input variable of the model. Aim to construct a uniform model which
Sustainability 2017, 9, 1343
4 of 12
can be extrapolated to any station and time period, a linear regression with variable intercepts was constructed. The function can be written as the following form: Yit = α + βXit + uit
(1)
where α is a scalar, β is a constant, Xit is the explanatory variable (February–April mean temperature) in the year t at the station i. The error term, uit , represents the effects of those omitted variables that are peculiar to both the individual stations and time periods. Ideally, individual-specific effect and the remainder disturbance, say µi and vit , should be explicitly introduced into omitted variables. Thus, uit can be written as: uit = µi + vit (2) As for this model, parameter estimators are different under three premise conditions. Under the first assumption, the sub-model is called pooled model, whose µi and vit are identically zero for all i and t. Ordinary-least-squares (OLS) estimation is appropriate for it. Under the second one, the sub-model is called fixed effects model. In the function, µi are fixed parameters and the stochastic vit are independent and identically distributed. Least-squares dummy-variable (LSDV) estimation is the more proper approach. Under the last one, the sub-model is called random effects model. µi and vit are both random, and Xit are independent of µi and vit , for all i and t. Generalized-least-squares (GLS) estimation is its optimization algorithm. Hsiao elaborated on the relevant details and assessed the corresponding parameter estimation efficiencies [24]. In order to reduce or avoid the omitted-variable bias as much as possible, the redundant fixed-effects test and Hausman test are often used to find out the most appropriate model form [22–26]. The former can confirm that if the fixed-effects assumption was more appropriate than the pooled assumption. The latter helps to choose between the model with fixed effects and the one with random effects. This paper employed the EViews software to run all the related tests and estimate the model parameters. 2.2.2. Model Validity Test The double cross-validation was used to test the robustness of this model. Samples were firstly split into two subsets during different periods: 1963–1987 and 1988–2011. Then, the calibration equation was constructed with the training set in 1963–1987 by using the LS estimator, while the validation set in 1988–2011 was leaved out to test the generalization ability of the derived model. Four statistics were used to measure the fractional variance between actual and reconstructed FFDs. Among them, the calibration validity was measured by the determination coefficient (square of correlation coefficient, R2 ) and the root-mean-square error (RMSE, Equation (3)), and the verification validity was measured not only by the R2 and RMSE, but also by the reduction of error (RE, Equation (4)), and the coefficient of efficiency (CE, Equation (5)). In the final step, switching the subset in 1988–2011 as the calibration data and another subset in 1963–1987 as the verification data, the same tests were run. s 2 ∑( xi − xˆi ) RMSE = (3) n RE = 1.0 −
CE = 1.0 −
2 ∑( xvi − xˆ vi ) 2 ∑ ( x vi − x c ) 2 ∑( xvi − xˆ vi ) 2 ∑ ( x vi − x v )
(4)
(5)
where xi and xˆi are the observed and simulated data in i year of the calibration period or the verification period, xvi and xˆ vi are the observed and simulated data in i year of the validation period, x c is the mean observed FFD in the calibration period, and x v is the mean observed data in the validation period.
Sustainability 2017, 9, 1343
5 of 12
2.3. Spatiotemporal Variation Analysis of Simulated Peony FFDs We took five steps to analyse the spatiotemporal variation in the regional peony FFDs. Firstly, on the basis of the panel data model, annual FFDs in 1955–2011 were reconstructed for all phenological and meteorological stations. Secondly, the 57-year mean values of every reconstructed FFD series were calculated. Thirdly, their contour distribution was derived by the Kriging interpolation. Fourthly, a linear regression between FFDs and years was used to evaluate the temporal trends and calculate the accumulated advance in FFD for each station. Finally, the spatial pattern of accumulated advances in FFD over the study area was analysed by use of ArcGIS. 3. Results 3.1. Optimised Parameters Estimation According to the principle of the above-mentioned tests [23,27], the fixed effects model is superior to the pooled model, because the p-value of redundant fixed-effects test is smaller than 0.05 (Table 2). In meanwhile, the random-effects model is better than the fixed-effects model, because of the p-value larger than 0.05 yielded by the Hausman test (Table 3). Table 2. The result of redundant fixed-effects test. Effects Test
Statistic
d. f.
Prob.
Cross-section F Cross-section Chi-square
7.035 69.868
(11,207) 11
0.000 0.000
Table 3. The result of Hausman test. Test Summary
Chi-Sq. Statistic
Chi-Sq. d. f.
Prob.
Cross-section random
0.016
1
0.899
After the random-effects model was identified as the optimal choice, we fitted the model by the GLS estimation. Estimated parameters and statistical indicators of the model accuracy were provided in Table 4. Among them, the R2 is as high as 0.680 (p < 0.001) and the RMSE is 3.037. The equation of this unified model for FFD predicting across the region can be written as: Yit = 24.406 − 3.018 × Xit
(6)
From the equation, we can know that the advance of regional peony FFD responded to the increase in spring (February–April) temperature at a rate of −3.02 days/1 ◦ C. The predicting values of FFD at each phenological station can be further revised by the corresponding uit . Table 4. Parameter estimation for the random effects model. Parameter
Fitted Value
Std. Error
Prob.
α β
24.406 –3.018
1.192 0.139
0.000 0.000
uit for individual phenological stations Beijing Kaifeng Shanhaiguan Tai’an Xi’an Yulin
−1.000 −0.717 −2.806 −1.323 −0.190 2.874
Heze Luoyang Shijiazhuang Taigu Xingtai Zibo
0.335 −2.205 0.925 0.034 3.617 0.457
Weighted Statistics R2 Adjusted R2 Prob.
0.682 0.680 0.000
RMSE. F-statistic
3.037 466.811
Sustainability 2017, 9, 1343 Sustainability 2017, 9, 1343
6 of 12 6 of 12
3.2. Model Model Validity Validity 3.2. The model model was was satisfactory satisfactory in in terms terms of of four four test test statistics. statistics. First, First, the the determination determination coefficient coefficient The indicatesthat thatthe theregression regressionmodels models can explain 70–80% of the variance (Figure 2). Second, RE indicates can explain 70–80% of the FFDFFD variance (Figure 2). Second, RE and and CE over the validation period 1988–2011 are 0.77 and 0.65, respectively; whereas they are 0.73 CE over the validation period 1988–2011 are 0.77 and 0.65, respectively; whereas they are 0.73 and 0.61 andthe0.61 for theperiod validation period 1963–1987. According and to climatological and hydrological for validation 1963–1987. According to climatological hydrological experiences [28–30], experiences both indicates of them high beingreliability positiveofindicates high reliability of The the medians derived both of them [28–30], being positive the derived reconstructions. reconstructions. The as medians R2 and wellrespectively. as CE are 0.76, and 0.63, respectively. The of R2 and RE as well CE areof 0.76, 0.75,RE andas0.63, The0.75, decreasing trend in these three decreasing trend exactly in thesethe three statistics follows the expected rigor level ofand the validation regression statistics follows expected rigor level ofexactly the regression model calibration model Last, calibration and validation median the RMSE is of 3.62, which indicates the akind of tests. the median RMSE is tests. 3.62, Last, whichthe indicates kind regression model has good regression model has a good predictive/reconstructive performance. The predicting validity of this predictive/reconstructive performance. The predicting validity of this model has been proved in model hasand been proved in fields biometric andOur econometrics fields [23,27]. Ourapproach study further shows that biometric econometrics [23,27]. study further shows that this can also provide this approach can also provide accurate results for phenological studies. accurate results for phenological studies.
Figure 2. 2. Results Resultsofofdetermination determinationcoefficient coefficient and RMSE double cross-validation. (A) 1963– Figure and RMSE forfor thethe double cross-validation. (A) 1963–1987 1987 the calibration period; (B) 1988–2011 as the validation (C) 1988–2011 as the calibration as theas calibration period; (B) 1988–2011 as the validation period;period; (C) 1988–2011 as the calibration period; period; and (D) 1963–1987 as the validation period. Here, both x and y are in terms of days of deviation and (D) 1963–1987 as the validation period. Here, both x and y are in terms of days of deviation from from 23 April. 23 April.
3.3. Spatial Spatial Variations Variations in in 57-Year 57-Year Mean MeanFFD FFDand andFFD FFDTrend Trend 3.3. The simulated simulated spatial spatialpattern patternof of57-year 57-yearmean meanFFDs FFDsacross acrossthe thestudy studyarea areawas was shown Figure The shown inin Figure 3. 3. The regional FFD gradually became later from south to north with an amplitude of approximately The regional FFD gradually became later from south to north with an amplitude of approximately ◦ N, month. The while the latest FFD occurred onon 17 11 month. The earliest earliest FFD FFDoccurred occurredon on15 15April Aprilininlatitude latitude31° 31N, while the latest FFD occurred ◦ May in in latitude 40°40N.N. In In addition, thethe FFD was notnot strictly linearly increased with latitude, which is 17 May latitude addition, FFD was strictly linearly increased with latitude, which more obvious in the northern subarea than in the southern subarea. These results imply that the is more obvious in the northern subarea than in the southern subarea. These results imply that the atmospheric meridional the most important controlling factor for the atmospheric meridional temperature temperaturegradient gradientshould shouldbebe the most important controlling factor for spatial pattern of peony FFDs, while temperature large-scale the spatial pattern of peony FFDs, while temperaturechange changeclosely closelyrelated relatedto to impacts impacts of of large-scale terrains leads leads to to the the zonal zonal spatial spatial heterogeneity heterogeneity of of peony peony FFDs. FFDs. terrains The reconstructed peony FFDs in the study area for 1955–2011 showed significant advance trends. The mean linear trend in the study area was about −1.3 days/decade, varying from −1.8 to −0.8
Sustainability 2017, 9, 1343
7 of 12
The reconstructed peony FFDs in the study area for 1955–2011 showed significant advance trends. The mean linear trend in the study area was about −1.3 days/decade, varying from −1.8 to Sustainability 2017, 9, 1343 7 of 12 −0.8 days/decade (p < 0.001) at different phenological stations (e.g., Beijing, Heze, Luoyang, and Sustainability 2017, 9, 1343 7 of 12 Tai’an,days/decade shown in Figure 4). In general, phenological the study area can be divided three sub-areas, according (p < 0.001) at different stations (e.g., Beijing,into Heze, Luoyang, and Tai’an, in Figure 4). In general, the study area can be divided into three sub-areas, according to the to the shown magnitude of advance over the past 57 years (Figure 5). The first sub-area included Beijing, days/decade (p < 0.001) at different phenological stations (e.g., Beijing, Heze, Luoyang, and Tai’an, magnitude of advance over the past 57 years (Figure 5). The first sub-area included Beijing, Tianjin, shown in Figure 4). In general, the study area can be divided into three sub-areas, according to the Tianjin, most parts of Hebei, east of Shanxi, and north of Henan, where the FFD advance was greatest parts of Hebei, east of Shanxi, north (Figure of Henan, where thesub-area FFD advance wasBeijing, greatestTianjin, (about magnitude ofThe advance over the pastand 57 years The first included (aboutmost 8–9 days). second sub-area was in east of 5). Shaanxi, west of Shanxi, north of Henan, and 8–9 second sub-area wasand in east of of Shaanxi, of the Shanxi, of Henan, and west of mostdays). parts The of Hebei, east of Shanxi, north Henan,west where FFD north advance was greatest (about west of Shandong, where the advance in FFD was moderate (about 7–8 days). The last one was located Shandong, where the advance FFD 7–8 days). north The last one wasand located 8–9 days). The second sub-areain was in was east moderate of Shaanxi,(about west of Shanxi, of Henan, west in of in easteast of Shandong, south ofofHenan, northwest ofHubei, Hubei,and and southeast of Shaanxi, where the FFD of Shandong, south Henan, northwest of southeast of Shaanxi, the FFD Shandong, where the advance in FFD was moderate (about 7–8 days). The last onewhere was located in exhibited days of advance. exhibited 6–7 days of advance. east6–7 of Shandong, south of Henan, northwest of Hubei, and southeast of Shaanxi, where the FFD exhibited 6–7 days of advance.
Figure 3. Spatial variation in the 57-year mean FFD for the Zhongyuan peonies.
Figure 3. Spatial variation in the 57-year mean FFD for the Zhongyuan peonies. Figure 3. Spatial variation in the 57-year mean FFD for the Zhongyuan peonies.
Figure 4. Annual variations of the regional peony FFDs and their linear trends from 1955 to 2011. Figure 4. Annual variations of the regional peony FFDs and their linear trends from 1955 to 2011.
Figure 4. Annual variations of the regional peony FFDs and their linear trends from 1955 to 2011.
Sustainability 2017, 9, 1343 Sustainability 2017, 9, 1343
8 of 12 8 of 12
Figure 5. Spatial variation in FFD trend for the Zhongyuan peonies during 1955–2011.
Figure 5. Spatial variation in FFD trend for the Zhongyuan peonies during 1955–2011.
4. Discussion
4. Discussion 4.1. Benefits of the Panel Data Model
4.1. Benefits of the Panel Data Model
The panel data model possesses several major advantages over conventional phenological The panel modellinear possesses several major advantages conventional modelcs. Thedata single-site regression model is simple to set up over and usually providesphenological accurate results. However, its extrapolation to othermodel regionsisand time periods may notusually be robust, especially in modelcs. The single-site linear regression simple to set up and provides accurate extreme conditions. The process-based model can produce a smaller than the results. However, its extrapolation to other regions and time periodsextrapolation may not be error robust, especially former,conditions. but it is more difficult to establish. It costs more time to extrapolation run simulations, andthan the the in extreme The process-based model can much produce a smaller error simulation effectiveness depends on the algorithm schedule, the choice of initial temperature, and former, but it is more difficult to establish. It costs much more time to run simulations, and the the number of iterations. By comparison, the panel data model can be viewed as a simplified form of simulation effectiveness depends on the algorithm schedule, the choice of initial temperature, and the process-based model, according to the cognition that plant growth during the quiescent period is the number of iterations. By comparison, the panel data model can be viewed as a simplified form of nearly linear [12,31]. It is much more robust than the single-site linear regression model, and easier the process-based model, according tomodel. the cognition that plantthe growth during the quiescent period is to establish than the process-based More importantly, two conventional models cannot nearly linear It isheterogeneity much more robust than linearbiased regression andby easier control the[12,31]. individual and thus runthe the single-site risk of obtaining results.model, However, to establish the process-based model. More importantly, the two conventional models cannot utilizingthan information on both the intertemporal dynamics and the individuality of the stations being control the individual heterogeneity thus run theinrisk of obtaining biased results. investigated, the panel data model and is able to control a more natural way for the effectsHowever, of those by missing or unobserved variables [23,24]. utilizing information on both the intertemporal dynamics and the individuality of the stations being For the spring predominant factor investigated, theZhongyuan panel datapeonies, model is able temperature to control inisathe more natural way forcontrolling the effectsFFD, of those while precipitation and sunshine duration have no significant influences (e.g., [18,19]). Therefore, missing orthe unobserved variables [23,24]. we a panel data model which has only one explanatory variable—February–April meanwhile Forconstructed the Zhongyuan peonies, spring temperature is the predominant factor controlling FFD, temperature. However, for other plant species in China, the precipitation and sunshine duration may the precipitation and sunshine duration have no significant influences (e.g., [18,19]). Therefore, we need to be considered as the explanatory variables (e.g., [32,33]). Conventional time-series studies in constructed a panel data model which has only one explanatory variable—February–April mean the phenological field are often plagued with the collinearity among explanatory variables. By temperature. However, otherapplied plant species in China, the precipitation and sunshine duration comparison, panel datafor models to econometric estimates can reduce the collinearity among mayexplanatory need to be variables considered as the explanatory variables (e.g., [32,33]). Conventional time-series [23,24]. Thus, the panel data model should be expected to have more studies in the phenological field are often plagued with the collinearity among explanatory variables. application in phenological studies.
By comparison, panel data models applied to econometric estimates can reduce the collinearity among 4.2. The Consistency of Regional Phenological Trends explanatory variables [23,24]. Thus, the panel data model should be expected to have more application in phenological studies. The advanced FFD trend of Zhongyuan Peony was largely consistent with spring phenological changes in other places. For example, over the past 57 years, the advance of peony FFD in Luoyang,
4.2. The Consistency ofXi’an Regional Trends Heze, Beijing, and was Phenological respectively −1.2, −1.6, −1.8, and −1.4 days/decade. Another phenological
result from [34] FFD was trend close to study: trends of was the first leaf consistent date (FLD)with for Chinese ash trees The advanced of this Zhongyuan Peony largely spring phenological (Fraxinus chinensis Roxb.) over the period 1952–2007 were nearly −1.1 days/decade in Henan, −2.0
changes in other places. For example, over the past 57 years, the advance of peony FFD in Luoyang, Heze, Beijing, and Xi’an was respectively −1.2, −1.6, −1.8, and −1.4 days/decade. Another phenological result from [34] was close to this study: trends of the first leaf date (FLD) for Chinese ash
Sustainability 2017, 9, 1343
9 of 12
trees (Fraxinus chinensis Roxb.) over the period 1952–2007 were nearly −1.1 days/decade in Henan, −2.0 days/decade in Beijing and Shandong, and −1.4 days/decade in Shaanxi. Furthermore, the first flowering dates of 23 species at 22 stations in eastern China since the 1960s were found to advance at the average rate of 1.2 days/decade [35], and the same rate has been reported for the FLD across the Northern Hemisphere over the period 1955–2002 [36]. The two results are also in good agreement with the average trend (−1.3 days/decade) of Zhongyuan Peony. Based on the phenology theory that phenophases of different species in the same climatic zone usually advance or delay synchronously [37], the advanced FFD trend of Zhongyuan Peony can be viewed as a good proxy of the overall mean phenological changes in the warm-temperate zone of China during the recent decades. 4.3. Influential Factors on Spatial Heterogeneity in FFD Peony FFDs in the eastern forelands of Taihang Mountains and Lvliang Mountains showed steeper gradients and clearer advances of than those in the other sub-areas (Figures 3 and 5). These piedmont regions are located in the climate-sensitive area (32◦ –42◦ N, 110◦ –120◦ E) where the strongest advance of FLD has occurred in China during the past 50 years [38]. In addition, these regions belong to the high-risk area of wheat dry-hot wind in northern China [39]. We consider that the foehn caused by mountainous terrain should impose an important influence on the above phenomena. It is well known that the foehn can not only cause the temperature to rise, but also cause the relative humidity to fall on the lee side of a mountain range. Furthermore, the advance of spring phenophases can be prompted by it. In the case of the Taihang Mountains, the foehn area can generally extend 170 km to the east, and up to 254 km farther during stronger foehn processes [40]. In general, a foehn area possesses a heat resource as much as the southern areas about 2–3 latitudes away [41]. Beijing, Baoding, Shijiazhuang and Xingtai, where peony FFD showed the strongest advance in the study area, happen to locate in the above-mentioned range. 4.4. Practical Applications of Phenoloigcal Researches in Tourism In China, tourism industry has gradually become a pillar industry and played an important role in the society during the past 30 years. However, there are still some problems which cannot be neglected in the development of tourism, such as inefficient management, low service level, and mismatch with accelerated technological and social developments. In order to regulate and upgrade the traditional tourism, the smarter tourism, inspired by IBM’s “Smarter Planet” and “Smarter City”, has been put forward as a strategic solution [42]. Our research results can contribute to the development of the smart tourism by providing more efficient and intelligent information. From a perspective of tourism destination, phenological knowledge can help them to first recognise the new challenge arising from changes in both the climate and tourists, and then to proactively respond in terms of landscape planning and tourist management. With phenological information being embedded on tourism organisations and entities, it can also enhance the competitiveness of destinations, support travel agencies to make smarter decision on travel routes, and enrich experiences of tourists and local residents. Bringing smartness into tourism, especially into tourism destinations, requires phenological studies in China to be more closely connected with the development of tourism industry. Although this paper and some other studies (e.g., [43–45]) has shed some light on the spatiotemporal dynamics of flower-viewing in China, more measures are still needed to expand the contributions of phenology. For example, in most of the time, tourists only have limited knowledge and low awareness on the phenological changes of destinations they visit. Thus, more regional phenological calendars should be updated with the support of observation data and simulation results as soon as possible, and be provided by the tourism service platform of destinations. Furthermore, due to uncertainties in future climate, the risk prediction of phenoloigcal landscapes should combine phenological models with different climate scenarios and related strategies of risk management should also be adapted
Sustainability 2017, 9, 1343
10 of 12
to them. In addition, analyzing the relation between the spatiotemporal changes of tourist flow and phenoloigcal landscapes would be a prosperous field in tourism geography for the future. 5. Conclusions In the present study, a panel data model was utilized to quantify the relationship between the peony FFD and spring temperature, and the spatiotemporal variation in FFD in the middle and lower reaches of China’s Yellow River in 1955–2011 was further analyzed on the basis of the model. The following conclusions can be made: (1) the panel data model can well simulate FFDs at the regional scale, with due consideration paid to both efficiency and difficulty; (2) the advance of peony FFD responded to the increase in February–April temperature at a rate of 3.02 days/1 ◦ C; (3) regional FFDs of tree peonies followed the latitudinal gradient and had advanced by 6–9 days over the past 57 years, at the rate of 0.8 to 1.8 days/decade; (4) the eastern forelands of Taihang Mountains and Luliang Mountains showed more FFD advances than the other sub-areas. Acknowledgments: This research study was supported by the National Natural Science Foundation of China (grant No. 41427805) and the Basic Research Project of the Ministry of Science and Technology (grant No. 2014FY210900 and 2011FY120300]. We also thank three anonymous reviewers and the editor for providing comments and critiques that significantly improved the manuscript. Author Contributions: Haolong Liu contributed to all aspects of this work; Junhu Dai revised the paper; and Jun Liu analyzed the data and put forward the related suggestions for tourism; all authors reviewed the manuscript. Conflicts of Interest: The authors declare no conflict of interest.
References 1. 2. 3. 4. 5.
6. 7. 8. 9.
10. 11. 12.
Walther, G.-R.; Burga, C.A.; Edwards, P.J. “Fingerprints” of Climate Change: Adapted Behaviour and Shifting Species Ranges; Kluwer Academic/Plenum Publishers: New York, NY, USA, 2001. Schwartz, M.D. Phenology: An Integrative Environmental Science; Kluwer Academic Publishers: Dordrecht, The Netherlands, 2003. Schwartz, M.D.; Reiter, B.E. Changes in North American spring. Int. J. Climatol. 2000, 20, 929–932. [CrossRef] Parmesan, C.; Yohe, G. A globally coherent fingerprint of climate change impacts across natural systems. Nature 2003, 421, 37–42. [CrossRef] [PubMed] Rosenzweig, C.; Casassa, G.; Karoly, D.J.; Imeson, A.; Liu, C.; Menzel, A.; Rawlins, S.; Root, T.L.; Seguin, B.; Tryjanowski, P. Assessment of observed changes and responses in natural and managed systems. In Climate Change 2007: Impacts, Adaptation and Vulnerability; Parry, M.L., Canziani, O.F., Palutikof, J.P., van der Linden, P.J., Hanson, C.E., Eds.; Contribution of Working Group II to the Fourth Assessment Report of the Intergovernmental Panel on Climate Change; Cambridge University Press: Cambridge, UK, 2007; pp. 79–131. Chen, X.Q.; Zhang, F.C. Spring phonological change in Beijing in the last 50 years and its response to the climatic changes. Chin. J. Agrometeorol. 2001, 22, 1–5. Wu, X.C.; Liu, H.Y. Consistent shifts in spring vegetation green-up date across temperate biomes in China, 1982–2006. Glob. Chang. Biol. 2013, 19, 870–880. [CrossRef] [PubMed] Zhu, L.; Meng, J. Determining the relative importance of climatic drivers on spring phenology in grassland ecosystems of semi-arid areas. Int. J. Biometeorol. 2015, 59, 237–248. [CrossRef] [PubMed] Chen, Z.H.; Xiao, M.; Chen, X. Change in flowering dates of Japanese Cherry Blossoms (P. yedoensis Mats.) on campus of Wuhan University and its relationship with variability of winter temperature. Acta Ecol. Sin. 2008, 28, 5209–5217. Kong, F.Z.; Liu, J.M.; Kong, L.; Zhang, Z.H. Mid and long-term forecast model for the early florescence of Heze Peony. Chin. J. Agrometeorol. 2011, 32, 115–121. Li, X.C.; Tao, H.; Zhang, S.M.; Liu, H.Y. The impact and prediction of climate change on first-flowering date of Korla Fragrant Pear. Chin. J. Agrometeorol. 2012, 33, 119–123. Chuine, I.; Cambon, G.; Comtois, P. Scaling phenology from the local to the regional level: Advances from species-specific phenological models. Glob. Chang. Biol. 2000, 6, 943–952. [CrossRef]
Sustainability 2017, 9, 1343
13. 14. 15. 16. 17.
18. 19. 20. 21. 22. 23. 24. 25. 26. 27. 28. 29. 30. 31.
32. 33.
34. 35.
36. 37. 38.
11 of 12
Honjo, H.; Fukui, R.; Sugiura, T.; Aono, Y. The DTS accumulation model for predicting the flowering date of Japanese pear tree in Japan. Acta Hort. 2006, 707, 151–158. [CrossRef] Ge, Q.S. The progress of phenology studies and challenges to modern phenology research in China. Bull. Chin. Acad. Sci. 2010, 25, 310–316. Chhabra, D.; Healy, R.; Sills, E. Staged authenticity and heritage tourism. Ann. Tour. Res. 2003, 30, 702–719. [CrossRef] Poria, Y.; Butler, R.; Airey, D. The core of heritage tourism: Distinguishing heritage tourists from tourists in heritage laces. Ann. Tour. Res. 2003, 30, 238–254. [CrossRef] Cleland, E.E.; Chiariello, N.R.; Loarie, S.R.; Mooney, H.A.; Field, C.B. Diverse responses of phenology to global changes in a grassland ecosystem. Proc. Natl. Acad. Sci. USA 2006, 103, 13740–13744. [CrossRef] [PubMed] Lan, B.Q.; Li, J.J.; Duan, Q.X. Chinese Tree Peony Encyclopaedia; China Science and Technology Press: Beijing, China, 2002. Wei, X.L.; Kong, F.Z.; Zhang, Z.Y.; Zhang, C.Y. Long term forecast for peony florescence in Heze. Meteorol. Mon. 2001, 27, 55–57. Wang, P.; Li, R.J.; Xu, H.Y. The forecasting of peony florescence based on multivariate regression analysis. Agric. Netw. Inf. 2008, 3, 139–142. Zhang, F.; Xing, X.X.; Li, R.J.; Gai, S.P.; Zheng, G.S. A prediction model for florescence of tree peony based on soil temperature in Heze city of Shandong Province. Chin. J. Agrometeorol. 2008, 29, 87–89. Wan, M.W.; Liu, X.Z. Phenological Observation Method in China; Science Press: Beijing, China, 1979. Baltagi, B.H. Econometric Analysis of Panel Data, 3rd ed.; John Wiley&Sons Ltd.: Chichester, UK, 2005. Hsiao, C. Analysis of Panel Data; Cambridge University Press: Cambridge, UK, 2003. Moulton, B.R. Random group effects and the precision of regression estimates. J. Econom. 1986, 32, 385–397. [CrossRef] Moulton, B.R. Diagnostics for group effects in regression analysis. J. Bus. Econ. Stat. 1987, 5, 275–282. [CrossRef] Gao, T.M. The Analysis Method and Statistical Modelling of Econometrics: A Guidebook for Using EViews; Tsinghua University Press: Beijing, China, 2009. Lorenz, E.N. Empirical Orthogonal Functions and Statistical Weather Prediction; Department of Meteorology, Massachusetts Institute of Technology: Cambridge, MA, USA, 1956. Nash, J.E.; Sutcliffe, J.V. River flow forecasting through conceptual models part I—A discussion of principles. J. Hydrol. 1970, 10, 282–290. [CrossRef] Cook, E.R.; Meko, D.M.; Stahle, D.W.; Cleaveland, M.K. Drought reconstructions for the continental United States. J. Clim. 1999, 12, 1145–1162. [CrossRef] Sparks, T.H.; Jerffree, E.P.; Jeffree, C.E. An examination of the relationship between flowering times and temperature at the national scale using long-term phonological records from the UK. Int. J. Biometeorol. 2000, 44, 82–87. Xu, Y.Q.; Lu, P.L.; Yu, Q. Impacts of climate change on the first-flowering dates of Robinica pseudoacacia. and Syringa amurensis. in China. J. Beijing For. Univ. 2004, 26, 94–97. Jiang, J.F.; Liang, C.H.; Yang, H.; Zhang, Y.L.; Ding, W.K.; Yang, Y.L. Influence of temperature and precipitation on phenology of desert plant Haloxylon ammodendron and Cornulaca alaschanica in recent ten years. J. Arid Land Res. Environ. 2017, 32, 141–146. Wang, H.J.; Dai, J.H.; Ge, Q.S. The spatiotemporal characteristics of spring phenophase changes of Fraxinus chinensis in China from 1952 to 2007. Sci. China Earth Sci. 2012, 55, 991–1000. [CrossRef] Ge, Q.S.; Dai, J.H.; Zheng, J.Y.; Bai, J.; Zhong, S.Y.; Wang, H.J.; Wang, W.C. Advances in first bloom dates and increased occurrences of yearly second blooms in eastern China since the 1960s: Further phenological evidence of climate warming. Ecol. Res. 2011, 26, 713–723. [CrossRef] Schwartz, M.D.; Ahas, R.; Aasa, A. Onset of spring starting earlier across the Northern Hemisphere. Glob. Chang. Biol. 2006, 12, 343–351. [CrossRef] Zhu, K.Z.; Wan, M.W. Phenology; Science Press: Beijing, China, 1973. Ge, Q.S.; Wang, H.J.; Dai, J.H. Simulating changes in the leaf unfolding time of 20 plant species in China over the twenty-first century. Int. J. Biometeorol. 2014, 58, 473–484. [CrossRef] [PubMed]
Sustainability 2017, 9, 1343
39. 40. 41. 42. 43. 44. 45.
12 of 12
Yang, F.Y.; Zhu, Y.J.; Liu, W.C. Occurrence rules and risk zoning of dry-hot wind in winter wheat producing areas of north China. J. Nat. Disast. 2013, 22, 112–121. Chen, M.; Fu, B.P. Numerical study for foehn in east slope of TaiHang Mountain. Plateau Meteorl. 1995, 14, 443–450. Chen, S.L.; Guo, Y.C.; Guo, K. Investigation Study on the Climate of Taihang Mountains and Luliang Mountains; Meteorology Press: Beijing, China, 1993. Zhang, L.Y.; Li, N.; Liu, M. On the basic concept of Smarter Tourism and Its theoretical system. Tour. Trib. 2012, 27, 66–73. Ma, L.A.; Fang, X.Q. Effects of global warming on seasonal tourism for the last 20 years in Beijing—A case study on the Peach flower stanza of Beijing Botanical Garden. Adv. Earth Sci. 2006, 21, 313–319. Liu, J.; Li, Y.Y.; Liu, H.L.; Ge, Q.S.; Dai, J.H. Climate change and peach blossom viewing: Impact and adaptation. Geogr. Res. 2016, 35, 504–512. Tao, Z.X.; Zhong, S.Y.; Ge, Q.S.; Dai, J.H.; Xu, Y.J.; Wang, H.J. Spatiotemporal variations in flowering duration of woody plants in China from 1963 to 2012. Acta Geogr. Sin. 2017, 72, 53–63. © 2017 by the authors. Licensee MDPI, Basel, Switzerland. This article is an open access article distributed under the terms and conditions of the Creative Commons Attribution (CC BY) license (http://creativecommons.org/licenses/by/4.0/).