grams are shown in insets between 2 V1âV2 cell pairs. Solid blue line displays peaked correlogram (right inset) and dotted line a flat correlogram (left inset).
Specificity of Color Connectivity Between Primate V1 and V2 ANNA WANG ROE1 AND DANIEL Y. TS’O2 Section in Neurobiology, Yale School of Medicine, New Haven, Connecticut 06510; and 2Department of Neurobiology, The Rockefeller University, New York City, New York 10021
1
Roe, Anna Wang and Daniel Y. Ts’o. Specificity of color connectivity between primate V1 and V2. J. Neurophysiol. 82: 2719 –2730, 1999. To examine the functional interactions between the color and form pathways in the primate visual cortex, we have examined the functional connectivity between pairs of color oriented and nonoriented V1 and V2 neurons in Macaque monkeys. Optical imaging maps for color selectivity, orientation preference, and ocular dominance were used to identify specific functional compartments within V1 and V2 (blobs and thin stripes). These sites then were targeted with multiple electrodes, single neurons isolated, and their receptive fields characterized for orientation selectivity and color selectivity. Functional interactions between pairs of V1 and V2 neurons were inferred by cross-correlation analysis of spike firing. Three types of color interactions were studied: nonoriented V1/nonoriented V2 cell pairs, nonoriented V1/oriented V2 cell pairs, and oriented V1/nonoriented V2 cell pairs. In general, interactions between V1 and V2 neurons are highly dependent on color matching. Different cell pairs exhibited differing dependencies on spatial overlap. Interactions between nonoriented color cells in V1 and V2 are dependent on color matching but not on receptive field overlap, suggesting a role for these interactions in coding of color surfaces. In contrast, interactions between nonoriented V1 and oriented V2 color cells exhibit a strong dependency on receptive field overlap, suggesting a separate pathway for processing of color contour information. Yet another pattern of connectivity was observed between oriented V1 and nonoriented V2 cells; these cells exhibited interactions only when receptive fields were far apart and failed to interact when spatially overlapped. Such interactions may underlie the induction of color and brightness percepts from border contrasts. Our findings thus suggest the presence of separate color pathways between V1 and V2, each with differing patterns of convergence and divergence and distinct roles in color and form vision.
INTRODUCTION
Cross-correlation techniques have been used to reveal the cooperative computations between groups of neurons both within and between areas. In the case of the lateral geniculate nucleus and primary visual cortex (V1), correlated firing reveals pairs of neurons with overlapping receptive fields, i.e., computation of spatial similarity (Reid and Alonso 1995; Tanaka 1985). Within V1, correlated firing is found between neurons with matching orientation and color preferences (Ts’o and Gilbert 1988; Ts’o et al. 1986). Thus far, little is known about the computations performed in V2 nor the relationship of the functional maps to those computations. By studying pairs of V1-V2 neurons, identified according to anatomic location and classified by color and orientation, we have begun to The costs of publication of this article were defrayed in part by the payment of page charges. The article must therefore be hereby marked “advertisement” in accordance with 18 U.S.C. Section 1734 solely to indicate this fact.
address the question of what the relevant computations between V1 and V2 may be. Within the primate visual pathway, area V2 receives its primary ascending input from area V1 and is considered the next hierarchical level beyond area V1. V1 and V2 are characterized by quite distinct functional organizations and share strong functional and connectional relationships (Girard and Bullier 1989; cf. Mignard and Malpeli 1991; Salin and Bullier 1995). As revealed by anatomic methods, the interdigitated lattices of “blobs” and “interblobs” in area V1 project selectively to the thin and pale cytochrome oxidase stripes in V2, respectively. Although each of these organizational structures contains a range of cell types, each is dominated by different populations of visual cells: thin stripes and blobs are characterized by nonoriented color-selective cells and pale stripes and interblobs by oriented broadband cells (DeYoe and Van Essen 1985; Hubel and Livingstone 1987; Livingstone and Hubel 1984; Roe and Ts’o 1995; Tootell 1988; Tootell and Hamilton 1989; Ts’o and Gilbert 1988; Ts’o et al. 1990a; cf. Gegenfurtner et al. 1996; Leventhal et al. 1995; Levitt et al. 1994). These anatomic studies establish a concrete structural framework for parallel color, form, and disparity/motion pathways in V1 and V2 (DeYoe and Van Essen 1988; Hubel and Livingstone 1987; Livingstone and Hubel 1984, 1987a,b). Some subsequent studies, however, have diverged from a strictly segregated view of connectivity (e.g., for review, see Merigan and Maunsell 1993). In this study, we address the issue of what type of interactions exist between the color and form cortico-cortical pathways and whether within the color pathway there is further specification of connectivity. To approach this issue, we have assessed functional connectivity by using cross-correlation analysis to detect the coincidence of spike firing of simultaneously recorded V1/V2 cell pairs in Macaque monkeys. Previous studies using cross-correlation techniques to study cortico-cortical connectivity have focused on interactions between V1 and V2, interhemispheric interactions, or thalamocortical relationships (cf. Bauer et al. 1995; Brosch et al. 1995, 1997; Frien et al. 1994; Girard and Bullier 1989; Nowak et al. 1995; Reid and Alonso 1995; Salin et al. 1992; Toyama et al. 1977a,b). However, these studies have not examined selectivity of interaction with respect to known functional compartments within visual cortex. In this study, we have first optically imaged visual areas V1 and V2 and subsequently targeted imaged structures (e.g., the blobs and stripes) with multiple microelectrodes. This approach permits the examination of interaction with respect to cell type and functional compartment. Our findings suggest a highly specific set of interactions between color cells that differ depending on color selectivity,
0022-3077/99 $5.00 Copyright © 1999 The American Physiological Society
2719
2720
A. W. ROE AND D. Y. TS’O
orientation selectivity, and spatial overlap. In this report, we have chosen to focus on V1/V2 interactions involving color cells. Interactions within the orientation system will be presented in a subsequent paper. METHODS
Surgical prep Eleven hemispheres in nine adult monkeys (Macaca fascicularis) were used for these experiments. Four of these monkeys also were used for V2 mapping experiments (Roe and Ts’o 1994; cf. Roe and Ts’o 1992, 1993a,b). After an initial anesthetic dose of ketamine hydrochloride (10 mg/kg), animals were intubated endotracheally and a 22-g catheter implanted in the saphenous vein for drug delivery. Anesthesia was maintained throughout the experiment by a constant infusion of sodium thiopental (1–2 mg z kg21 z h21);. Animals were paralyzed (pancuronium bromide, 100 mg z kg21 z h21) and respirated; after paralysis the level of anesthetic sufficient during surgical procedures was maintained. To further assess depth of anesthesia, vital signs including heart rate and electroencephalogram (EEG) were monitored continuously. Rectal temperature was maintained at 38°C and expired CO2 at 4%. After dilation of the pupils (atropine sulfate 1%), eyes were refracted and fitted with appropriate contact lens to focus on computer monitor 57 inches in front of the animal. Fovea were projected onto the monitor with a Topcon fundus camera. A craniotomy and a durotomy, ;1 cm in size, were made over a region around the lunate sulcus (centered ;15 mm anterior to occipital ridge and 10 mm lateral to midline), exposing a visual cortical area near the V1/V2 border representing 2–5° eccentricity. Analgesics and antibiotics were administered on recovery. All procedures were conducted in accordance with National Institutes of Health guidelines.
Studying interactions between specific functional structures in V1 and V2 OPTICAL IMAGING. To guide placement of microelectrodes, optical imaging of intrinsic cortical signals (Frostig et al. 1990; Grinvald et al. 1986, 1988; Ts’o et al. 1990a) first was used to localize functional compartments within V1 and V2. The details of imaging procedures have been described elsewhere (cf. Grinvald et al. 1986; Ts’o et al. 1990a) and only will be described briefly here. For increased cortical stabilization during optical recording, an optical chamber was cemented over the craniotomy, filled with lightweight silicone oil, and sealed with a coverglass. The cortical surface was illuminated through the chamber window with 630-nm wavelength light provided by optic fiber light guides. A slow-scan CCD (charge coupled device) camera (Photometrics) fitted with standard camera lenses then was positioned over the chamber. Images of the cortical surface were collected during visual stimulation of the eyes. All stimuli were presented with a Barco color monitor controlled by an IBM PC/AT with a Sargent Pepper Number Nine graphics card. A variety of visual stimuli, including luminance and chromatic contrast gratings, stationary and moving, of different spatial frequencies and orientations were presented in a pseudorandom fashion. For color stimuli, the monitor was calibrated to present isoluminant color contrast gratings. An electromechanical shutter in front of each eye allowed for independent stimulation of each eye. Images were digitized, collected, and processed. In a typical session, all frames acquired for each stimulus condition were summed and divided by the sum of blank stimulus trials; this procedure maximizes signal-to-noise ratios and minimizes effects of uneven illumination. For each functional property (e.g., ocular dominance, color/luminance preference), the sum of images obtained under one stimulus condition (e.g., left eye) was subtracted from that obtained under another (e.g., right eye). These difference images then were scaled, clipped,
smoothed, and displayed on a color monitor, and printed out for further inspection and comparison. OPTICAL IMAGING AS A GUIDE FOR TARGETING ELECTRODES.
Multiple functional maps, including those for ocular dominance, orientation, blob/interblob patterns in V1, and stripe locations in V2 (Ts’o et al. 1990a), were obtained. By revealing cortical organizations relative to cortical surface vasculature, we could precisely target cortical structures for purposes of electrophysiological recording with microelectrodes or for tracer injections. Once generated, these maps could be used for multiple recording sessions within the same cortical region. Figure 1 illustrates our experimental strategy. At the beginning of an experimental session, we generated a series of functional maps of a cortical region including central portions of both V1 and V2. These maps revealed ocular dominance, orientation, blob/interblob patterns in V1, and stripe locations in V2 (Ts’o et al. 1990a). As shown in Fig. 1B, imaging for ocular dominance (right eye light, left eye dark) clearly localizes the V1/V2 border (indicated by bars at left and right). Centers of monocularity were useful for localizing blobs (Ts’o et al. 1990a unpublished data). Blobs and thin stripes also were localized by imaging for color versus luminance stimuli (Fig. 1D). Orientation maps (Fig. 1C) of the same cortical region revealed mosaics of orientation columns in V1 as has been described previously (Blasdel 1992a,b; Ts’o et al. 1990a). Dark regions in this orientation map indicate cortical regions preferentially activated by horizontal (0°) oriented gratings and light regions those preferring vertical (90°) gratings. Thin, pale, and thick stripes and their subcompartments in V2 also were imaged (cf. Roe and Ts’o 1995). Optical imaging of orientationselective regions in V2 (upper part of Fig. 1C, stripes of dark and light patches oriented perpendicular to the V1/V2 border) revealed the locations of pale and thick stripes (cf. Roe and Ts’o 1995; Ts’o et al. 1991). These stripes were separated by regions without clear orientation domains (uniform gray), regions that overlay the color (or thin) stripes, as confirmed by imaging for color activation (Fig. 1D) (cf. Roe and Ts’o 1995, 1997; unpublished data). Because cytochrome oxidase stripes have higher levels of metabolic activity, locations of thin and thick stripes also were confirmed by imaging for general activation. In some cases, disparity (or thick) stripes were imaged directly by comparison of monocular versus binocular stimulation; because of the preponderance of obligatory binocular cells, thick stripes are relatively less activated by monocular stimulation and therefore appear white in these images (not shown) (cf. Ts’o et al. 1989). Further subcompartmentalization within individual V2 stripes were also visible. For example, imaging for color versus luminance (cf. Figs. 18 and 20 from Roe and Ts’o 1995) often revealed substructure within thin stripes in V2. These functional domains within V2 stripes were examined further electrophysiologically and their interactions with V1 organizations studied. By using optical maps generated either from the same recording session or from previous recording sessions, multiple independently drive microelectrodes (2–5) were targeted in selected V1 and V2 locations (see Fig. 1, C and D). Because we have concentrated primarily on the color and orientation domains, electrodes targeted primarily blobs and interblobs in V1 and thin and pale stripes in V2. In a typical session, one or two electrodes were held in V1 while one or more electrodes sampled multiple targeted zones in V2 stripes. This arrangement enabled the concurrent recording and comparison of interactions of a given cell type (e.g., a V1 color nonoriented cell) with several other cell types (e.g., a V2 color nonoriented cell and a V2 color oriented cell), using identical and simultaneous visual stimulation conditions. Recordings were obtained from superficial layers only (recording depths ranged from 0 to 600 mm). On each electrode, single cells were isolated and physiologically characterized. To characterize cells, receptive fields were plotted with ELECTROPHYSIOLOGICAL CHARACTERIZATION.
V1–V2 COLOR CONNECTIVITY IN PRIMATES
2721
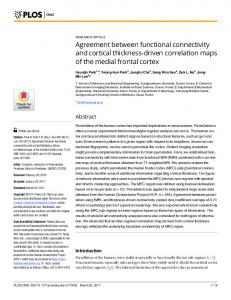
FIG. 1. Methodological approach. Electrophysiological study guided by optical imaging of V1 and V2. A: blood vessel map of imaged region (anterior up); top border is located near the lunate sulcus. Locations of electrode penetrations in V1 and V2 placed with the guidance of optical images are indicated by colored symbols. Receptive field properties of cells recorded are indicated by colored (color-selective cells) and white (broadband cells) bars (oriented cells) and dots (unoriented cells). Two sample correlograms are shown in insets between 2 V1–V2 cell pairs. Solid blue line displays peaked correlogram (right inset) and dotted line a flat correlogram (left inset). These recording site locations are redisplayed on each of the images shown in B, C, and D. Small portion of dural flap is seen in extreme top right and top left corners. Scale bar: 1 mm applies to A–D. B: ocular dominance map obtained by subtracting left eye activation (dark) from right eye activation (light). The V1/V2 border is clearly demarcated because V2 is not organized by ocularity (approximate location indicated by short line at side of each image shown in B–D). C: orientation map obtained by subtracting horizontal (dark) from vertical (light). In V1, the pattern of orientation columns is similar to those previously described (Ts’o et al. 1990). In V2, stripes containing orientation clusters correspond to pale/thick stripe locations (cf. Malach et al. 1994; Ts’o et al. 1991). Pale/thick stripes in V2 contain orientation clusters (positions indicated by gray arrows). Black arrows indicate regions lacking in orientation organization, resulting in an even gray map; these regions correspond with locations of thin stripes shown in D. D: map obtained by red-green isoluminant grating activation (minus blank activation). Three activated color (thin) stripes in V2 are seen. Appropriate subtraction also revealed centers of monocularity (blobs) in V1 which were also targeted. Note compelementarity of color stripes (black arrows) and orientation stripes (gray arrows, cf C).
a hand-held projection lamp. By listening to raw amplified and to discriminated pulse outputs of neural responses (window discriminator by BAK or Gawnwave, courtesy Tim Gawne and Barry Richmond), we qualitatively characterized each unit for ocular dominance, peak and width of orientation tuning, degree of direction selectivity, degree of end inhibition, and color selectivity. Orientation selectivity was rated on a qualitative scale A–D, where A is most narrowly (,30°) and D is most broadly tuned (cf. Livingstone and Hubel 1984); cells rated A or B were considered oriented. Color selectivity was determined by using narrowband interference filters equalized for luminance, ranging from 450 to 630 nm in 30-nm increments. We use the term color selective to mean preferentially responsive to nonwhite stimuli, such as red, green, blue, and yellow, over equiluminant white stimuli as determined with narrowband interference filters. We classified cells as broadband if they responded most strongly to white light. This qualitative method of color classification was used due to the time constraints of these experiments and was adequate for the conclusions drawn. Nonoriented color cells without antagonistic surrounds were classified as Type II and those with broadband antagonistic surrounds were classified as modified Type II (Ts’o and Gilbert 1988). Occasionally true double-opponent cells were encountered
(Livingstone and Hubel 1984). Cells with broadband center-surround organization were classified as Type III. For more detailed description of our characterization of V2 receptive field properties, see Roe and Ts’o (1995, 1997). VISUAL STIMULATION, SPIKE TRAIN COLLECTION AND CROSSCORRELATION ANALYSIS. After isolation of single cells on each
electrode, neural spike trains were collected from each cell during visual stimulation. Several neuronal spike trains and stimulus sync pulses were recorded simultaneously and time stamped (temporal resolution, 0.1 ms) using a Spike 9 board driven software package (HIST written by Kaare Christian). Poststimulus time histograms and raw cross correlograms were calculated and displayed on-line. Because of the low spontaneous firing rates typical of cortical neurons, we collected spike trains during the presentation of visual stimulation. Typically, stimuli (STIM software written by Kaare Christian) comprised moving bars of preferred orientation, size, color, and velocity presented on a computer monitor. The eyes subsequently were converged by placing a Risley prism in front of one eye and achieving precise overlap of right and left eye receptive fields of a V1 or V2 binocular cell. This setup ensures stimulation at a known and consistent disparity (roughly 0).
2722
A. W. ROE AND D. Y. TS’O
When possible, separate stimuli were presented for each isolated cell. For cells with nonoverlapping receptive fields, we presented stimuli optimal for each cell (usually moving light bars the orientation, color, and speed of which were tailored for each cell’s preferences). For cell pairs with overlapping receptive fields, we presented stimuli that were effective in stimulating both neurons in the cell pair (e.g., a single bar suboptimal for one or both cells). For example, for two cells with overlapping receptive fields, one of which is red selective and one that is broadband, a red stimulus, which is less effective for the broadband cell but effective in driving each cell, was used. To correct for the increase in spike firing because of visual stimulation, shuffle correlograms were calculated (the shift predictor) (Perkel 1966) and subtracted from the raw correlogram. Stimulus-induced increases in spike firing coincidence therefore (in principle) were removed by shuffle subtraction. Correlograms (6400 ms, 1.6-ms binwidths) were normalized for spike firing rate (1/sqrt(numspike1*numspike2)) and smoothed (weighted, moving Gaussian average 7 bins). Baseline means and SD were calculated from the first and last 100 ms in the correlograms. Peak position and peak height were determined and peak widths (at 0.25, 0.5, and 0.75 heights) calculated. Only peaks that were 2 SD above baseline were considered for peak analysis. Strength indices were calculated as the sum of deviation from baseline over the region of the peak (Ts’o et al. 1986). For comparison of peaks, we found peak height to be the most reliable indicator of interaction strength, as strength indices often were complicated by excessively broad peaks commonly found in V1/V2 interactions. In our data set, peak values ranged from 0 to 0.05. These values then were divided into quartiles and indexed from 0 to 3 (index 0: 0–0.0034, n 5 69; index 1: 0.0035– 0.0069, n 5 68; index 2: 0.007– 0.012, n 5 64; index 3: .0.012, n 5 71). Because of the breadth of the peaks, it is difficult to infer specific monosynaptic or polysynaptic connectivities. However, correlograms are used to indicate simply the presence or absence of functional interaction. Correlograms with significant peaks (e.g., Fig. 1A, solid line) were taken as evidence of the presence of functional interaction and flat correlograms (e.g., Fig. 1A, dotted line) the lack of interaction. TRACER INJECTIONS AND HISTOLOGY. To aid in localizing recording sites post mortem, in some experiments pressure injections of red rhodamine or green beads (Lumafluor) were made with a glass pipette. In other experiments, during the recording session electrolytic lesions were made along each penetration by passing current (4 mA for 4 s) through the electrode tip. At the end of data collection, animals then were given a lethal dose of pentobarbital sodium and perfused through the heart with 4% paraformaldehyde. After extraction of the brain, the desired cortical region was removed, flattened, and immersed in 30% sucrose solution. The cortical tissue then was sectioned tangentially at 30 mm and alternate sections either were reacted for cytochrome oxidase histochemistry or coverslipped for visualization of fluorescent bead labeling. We reconstructed our recording site locations on the tissue by aligning electrolytic lesions, tracer injection sites, and imaged surface vasculature patterns with locations and sizes of vascular lumen in superficial sections of cortical tissue. Because our recording locations were indicated directly on the image of cortical surface vasculature (which is in exact registration with the functional images collected), we could accurately align recording sites with the optical images and with cytochrome oxidase stained sections. RESULTS
Little is known about how color information from V1 is distributed to color-selective structures in V2 and what new properties may arise from such interactions. To examine this issue, we studied the interactions of color-selective cells in V1 with those in V2. Recordings from both V1 and V2 were in the superficial layers. Cross-correlograms were collected between 249 pairs of V1–V2 cells, 146 of which were between color-
TABLE
1.
Number of V1–V2 cell pairs recorded by type Type
n
Color-color cell pairs Nonoriented/nonoriented Nonoriented/oriented Oriented/nonoriented Oriented/oriented Color-broadband cell pairs Nonoriented/nonoriented Nonoriented/oriented Oriented/nonoriented Oriented/oriented Broadband-color cell pairs Nonoriented/nonoriented Nonoriented/oriented Oriented/nonoriented Oriented/oriented Broadband-broadband cell pairs Nonoriented/nonoriented Nonoriented/oriented Oriented/nonoriented Oriented/oriented Total
146 61 36 11 38 38 9 20 3 6 23 3 3 15 2 42 3 6 5 28 249
n 5 249 cell pairs.
selective cell pairs (see Table 1). Of the 146 V1/V2 color-color cell pairs studied, 42% (n 5 61) were nonoriented/nonoriented, 25% (n 5 36) were nonoriented/oriented, 7% (n 5 11) oriented/nonoriented, and 26% (n 5 38) oriented/oriented cell pairs (see Table 1). We also examined interactions between 38 color V1 and broadband V2 cell pairs, 23 broadband V1/color V2 cell pairs, and 42 broadband V1 and broadband V2 cell pairs. Interactions between oriented-oriented cell pairs will be presented in a separate paper. We have used the classification system of Wiesel and Hubel (1966) and further extended by Livingstone and Hubel (1984) and Ts’o and Gilbert (1988). Whereas most V1 nonoriented color cells recorded were dominated strongly by a single eye, almost all V2 cells were strongly binocular. The vast majority of nonoriented cells we encountered fell in the Type II (57% in V1, 50% in V2) or modified Type II (50% in V1, 40% in V2) classification. Two true double-opponent cells, recorded in V1, were encountered. In some cases (18/81), broadband cells in V2 displayed strong secondary responses to specific colors (nonoriented: 5 red, 1 blue, 2 yellow; oriented: 5 red, 5 green). In both V1 and V2, roughly 20 –25% of all color cells were related to the blueyellow system, and the remaining to the red-green system, consistent with previous reports of RG/BY ratios in V1 (Ts’o and Gilbert 1988). Although V1 and V2 contain similar receptive field types (cf. Yoshioka and Dow 1996; Yoshioka et al. 1996), some properties were found only in V2. Of nonoriented color cells, we encountered red-selective cells that displayed secondary responsiveness to white (16/102) but not to other colors individually; these were classified as red selective. Clusters of off-response cells commonly were encountered in V2 (cf. Roe and Ts’o 1995). In addition, more complex color combinations were seen, such as cells with both red and blue preference. In other instances, we observed Type II cells with green and blue on-center/red off-center (n 5 1), blue and yellow on-center response (n 5 2), or red and green off-center response (n 5 3). RECEPTIVE FIELD PROPERTIES.
V1–V2 COLOR CONNECTIVITY IN PRIMATES
2723
FIG. 2. Specificity of color interactions. Correlograms between 4 pairs of V1–V2 nonoriented color cells. Cell pairs with similar color specificities (A and C) have peaked correlograms. Those with different color specificities (B and D) have flat correlograms. A: 2 R1/G2 modified Type II cells. C: both V1 and V2 cells are blue on-center yellow off-center Type II cells. Spike trains collected during stimulation with blue bar oriented at 45°. Correlogram strength is 0.124. Receptive field locations (azimuth, elevation) are indicated. The receptive field sizes are drawn to scale. Scale bar: 1° applies to A–D.
Color-oriented cells also displayed more complex color combinations, such as red/blue, green/red, and red on/green offoriented receptive fields. Consistent with reports of a greater prominence and clustering of color oriented cells in V2 (Roe and Ts’o 1995; Ts’o et al. 1990b), a greater proportion of color cells in V2 (42%, 73/175) than in V1 (25%, 52/199) were oriented. Other receptive field types previously described, such as the color-selective spot cell (Hubel and Livingstone 1987) or cells selective for the direction of color contrast across a color border, were not studied here. NEURAL INTERACTIONS. Interactions between V1 and V2 color cells exhibit a strong dependency on similarity of color selectivity. To illustrate, four examples are shown in Fig. 2. In Fig. 2A, the correlogram between two R1/G2 modified Type II cells, one located in a V1 blob and the second in a V2 thin stripe. The receptive field sizes are drawn to scale and visual locations indicated (azimuth, elevation). Each receptive field was stimulated repeatedly by a red vertically oriented bar sweeping across its receptive field, during which spike trains were collected; stimuli were presented through a single eye only. Figure 2A illustrates a strongly peaked correlogram (strength index 5 0.074, peak 5 0.0158), indicating a strong interaction between these two neurons. In contrast, a Y1 B2 Type II V1 cell and an R1/G2
modified Type II V2 cell and demonstrate a lack of interaction, as indicated by a flat correlogram (strength index 5 0.0092, peak 5 0.001, Fig. 2B). Likewise, V1–V2 cell pairs with similar blue-yellow color preferences (B1 Y2 II V1 and B1 Y2 II V2) show peaked correlations (strength 5 0.124, peak 5 0.0259, Fig. 2C), whereas those with different color preferences (R1 Type IV V1, B1 Y2 mod Type II V2) exhibit little interaction (strength 5 0.015, peak 5 0.0018, Fig. 2D). As can be seen, strong correlations between nonoriented color cells were observed even when receptive fields lacked overlap. Figure 3 quantifies this finding for nonoriented color cell pairs (n 5 80). Correlograms first were rated for strength of interaction (see METHODS) from 0 to 3, where 0 indicates flat correlograms and 3 indicates strong peaks. Each cell pair was then classified as similar (n 5 52) or different (n 5 28) in color selectivity. Cell pairs with red-green color selectivity (any pairing of R1 G2, G1 R2, R1, G1) were considered similar as were those with blue-yellow selectivity (any pairing of B1 Y2, Y1 B2, B, Y); cell pairs of differing color selectivity (e.g., R1 G2 and B1 Y2) were considered different. Indeed, some color cell pairs of opposing polarity (e.g., R1 G2 and G1 R2) exhibited highly correlated interactions (8 cell pairs with peak index 2 or 3). As shown in Fig. 3, strongest inter-
2724
A. W. ROE AND D. Y. TS’O
actions occurred between cells with similar color selectivities. 71% of cell pairs with matching colors (n 5 52) exhibited peak strengths of 2 or 3, and 68% of color nonmatched cell pairs (n 5 28) exhibited 0 –1 peak strengths. The difference in these two distributions was highly significant [x2 (0.995) 5 18.41, df 5 3], indicating that color similarity and peak size are strongly related parameters. Because receptive field separation is also a determinant of interaction strength between cortical cells (see following text) (cf. Nowak et al. 1995; Ts’o et al. 1986), we further examined a subset of color cell pairs the receptive fields of which were of a similar distance apart. Figure 3B illustrates interaction strengths only for cell pairs with receptive fields within 0.5° of each other (n 5 27). Again, for this population, similar color specificity predicted strong correlations and different color specificity predicted weak correlations [x2 (0.995) 5 16.26, df 5 3]. This is bolstered further by examining the entire nonoriented color cell pair population (Fig. 3C, n 5 80). Because electrode targeting was guided by optical images, our sample population was not evenly distributed across visual separations. However, at well sampled visual separations (between 0 and 1° and between 2 and 3°), a wide range of peak strengths was found. Cell pairs with strong correlations were as likely to occur with small (,1° separation) as with large (.2° separations) receptive field separations. In fact, strong correlations occur even when receptive field separations are 2–3° distant (e.g., Fig. 2A, see following text). Thus for nonoriented color cell pairs, receptive field separation is not a primary determinant of neural interaction for V1/V2 color cells. Receptive field overlap NONORIENTED COLOR V1/NONORIENTED COLOR V2 CELL PAIRS.
FIG. 3. Specificity of color interactions. A: all nonoriented color cell pairs (n 5 80). Color-matched cell pairs (n, n 5 52) tend to have strong correlations (peak strength 2 or 3). Color nonmatched cell pairs (▫, n 5 28) have weak correlations (peak strength 1 or 2). See text for details. Number of color-matched (black) and color nonmatched (white) nonoriented V1–V2 cell pairs when rated for correlogram peak strength (0 –3). Cell pairs with similar color selectivities tend to have strong interactions (strength 2 or 3) and those with different color selectivities have weak interactions (strength 0 or 1). B: as a control for influence of receptive field separation, only nonoriented color cell pairs with receptive field separations ,0.5° (n 5 27) were examined. Again, those with weakest peaks had different color selectivities, and those with strong peaks had similar color selectivities. C: scatterplot of receptive field separation to peak size for entire population of nonoriented color selective cell pairs (n 5 80). ●, cell pairs with similar color selectivities; E, those with different color selectivities.
We also examined receptive field overlap (defined as the larger of the relative proportion of receptive field area in common) and center-to-center receptive field distance as other possible determinants of interaction strength. For nonoriented color cell pairs, neither receptive field separation nor receptive field overlap correlated with interaction strength (data not shown). Both of the color-matched cell pairs shown in Fig. 2, A and C, had an interaction strength of 3; however, the receptive fields in Fig. 2C are overlapped (20%), whereas those of Fig. 2A are not overlapped and, in fact, are .2.0° apart in visual space. Thus nonoriented color cells do not require receptive field overlap for functional interaction and, in fact, can interact over appreciable visual cortical distances. NONORIENTED COLOR V1/ORIENTED COLOR V2 CELL PAIRS. Like nonoriented color cell pairs, similar color preference was a strong predictor of strong interactions between color-selective nonoriented V1 and oriented V2 cells (n 5 30 pairs). In this population, of the seven cell pairs with strong peak strengths (peak size 3), six had similar color specificity. However, in contrast to the nonoriented color system, oriented cells in V2 exhibit a strong dependency on spatial overlap (Fig. 4). Of 22 (of 30) cell pairs that were considered color matched, 85% (11/13) of those with nonoverlapping receptive fields had peak strengths of 0 or 1; 77% (7/9) of those with overlapping fields had peaks of 2 or 3. This distribution is significantly different [x2 (0.95) 5 9.2, df 5 3] and suggests that nonoriented V1 cells that participate in orientation selectivity in V2 act only locally, whereas those that are involved in
V1–V2 COLOR CONNECTIVITY IN PRIMATES
2725
correlation (peak index 3). The latency of this peak is 5 ms, indicating a feedforward interaction from V1 to V2. Correlograms with positive peak positions ($3 ms) was found in 80% of oriented V1/nonoriented V2 cell pairs (black bars, n 5 5, Fig. 6C). The distribution of latencies is significantly different from either the color nonoriented/oriented cell pairs [Fig. 6C, white bars, x2 (0.95) 5 6.0, df 5 2] or the color nonoriented/nonoriented cell pairs [Fig. 6C, gray bars, x2 (0.995) 5 14.1, df 5 2]. These interactions are also dissimilar from the overall V1/V2 interactions the peaks of which are commonly centered on zero (n 5 273, mean 5 0.44 ms) (cf. Nowak et al. 1999; unpublished data). Although our sample is small, these data do suggest a feedforward transmission of oriented color information to distant regions of similar color selectivity in V2. The relationship between color-matched and color-nonmatched cell pairs is quite different. Unlike the color-matched FIG. 4. Dependency on receptive field overlap: V1 color nonoriented and V2 color oriented cell pairs. To distinguish dependence on color specificity from receptive field overlap, only color-matched cells pairs (n 5 22) were included in this analysis. Strong interactions (peak 2 or 3) were observed in cell pairs with receptive field overlap (n 5 9); weak or absent interactions (peak 0 or 1) were seen in nonoverlapping cell pairs (n 5 13). This distribution is significantly different [x2 (0.995) 5 0.0036, df 5 3].
the propagation of nonoriented color information have a more spatially extensive influence. Interestingly, there is no spatial dependency for inputs to broadband oriented cells in V2. Color inputs from V1 are as likely to interact with V2 oriented broadband cells when they are spatially distant as when they share receptive field overlap (Fig. 5A, n 5 20, x2 5 1.7, df 5 3). Similarly for nonoriented broadband inputs from V1, no significant differences were found between overlapping and nonoverlapping interactions (Fig. 5B, n 5 10, x2 5 0.73, df 5 3). This finding suggests a possible distinction in the convergence of V1 inputs to the color orientation versus the broadband orientation system in V2 (see DISCUSSION). Interactions between color-matched oriented V1 and nonoriented V2 cell pairs (broadband, n 5 6; color, n 5 10) were seen most often in cell pairs with nonoverlapping receptive fields (Fig. 6A). Of these cell pairs, all those with overlapping receptive fields (n 5 5) had peak indices of 0, and 65% of those with nonoverlapping receptive fields (n 5 11) had peak indices of 2 or 3. The significant dependency on lack of overlap [x2 (0.975) 5 5.7, df 5 1] suggests an interaction between oriented cells in V1 with distant color-matched nonoriented cells in V2. To examine whether this interaction is a feed-forward or feed-back interaction, we considered the peak position of the cross-correlogram. A positive peak position would indicate a greater probability of V2 spikes following V1 spikes, thus suggesting a feed-forward interaction. Similarly, a negative peak position would suggest a feed-back interaction. Peaks centered on zero would indicate primarily a common source of input. One example is illustrated in Fig. 6B. A red-selective V1 cell with a 90° orientation selectivity was recorded in a V1 blob; a second color cell (R1 G2 Type II) cell was recorded in a V2 thin stripe. Although the receptive fields are quite distant (2.5° apart), their interaction showed a strongly peaked ORIENTED V1/NONORIENTED V2 CELL PAIRS.
FIG. 5. Lack of dependency on receptive field overlap for nonoriented interactions with broadband oriented V2 cells. A: color nonoriented V1 cells are as equally likely to interact with overlapping (n 5 8) as nonoverlapping (n 5 12) broadband oriented cells. B: nonoriented broadband V1 cells and oriented broadband V2 cells. There is no significant difference between overlapping (n 5 6) and nonoverlapping (n 5 4) cell pairs.
2726
A. W. ROE AND D. Y. TS’O
interactions examined above, interactions between the color and broadband system (which we will refer to as color-nonmatched) exhibit a strong dependency on receptive field over-
FIG. 7. Dependency on receptive field overlap for color-nonmatched cell pairs (BB V1-color V2, n 5 16; color V1-BB V2, n 5 2).
lap. Indeed, color-nonmatched oriented V1 and nonoriented V2 cell pairs (BB oriented V1-color nonoriented V2, n 5 16; color oriented V1-BB nonoriented V2, n 5 2) exhibited strong interactions only when receptive fields overlapped [Fig. 7; x 2 (0.95) 5 4.4, df 5 1]. These differences in spatial interactions with respect to color-matching may reflect differences in the relationships between boundaries and perceived surface properties. DISCUSSION
Summary Previous studies in primates have indicated selective anatomic connectivity between the blobs in V1 and thin stripes in V2, structures containing a predominance of color-selective cells (Livingstone and Hubel 1984). However, no previous study has examined the connectivity patterns of different types of color cells. In this study, we have examined the functional interactions between color-selective cells in V1 and V2 using cross-correlation of simultaneously recorded spike trains. Although these correlations do not afford us the ability to determine the precise circuitry underlying the interactions between cell pairs, we can at least identify which types of interactions commonly occur and which do not. Using this method, we find V1 and V2 cells interact with a high degree of specificity, with respect to color selectivity, with FIG. 6. Interactions between oriented V1 and nonoriented V2 cells. A: lack of dependency on receptive field overlap for color-matched cell pairs (broadband, n 5 6; color, n 5 10). B: illustration of feedforward interaction between color-matched oriented V1 cell and nonoriented V2 cell. C: latency of correlogram peaks (for color cell pairs with peak size 3) for nonoriented/oriented cell pairs (n 5 7, ▫), nonoriented/nonoriented cells pairs (n 5 26, u), oriented/ nonoriented cell pairs (n 5 5, n, one broadband oriented/nonoriented cell pair included). Latencies for oriented/nonoriented cell pairs are significantly different from either nonoriented/oriented cell pairs [x2 (0.95) 5 6.0, df 5 2] or nonoriented/nonoriented cell pairs [x2 (0.995) 5 14.1, df 5 2].
V1–V2 COLOR CONNECTIVITY IN PRIMATES
FIG. 8. Summary figures. A, top: nonoriented V1–V2 cell pairs do not have dependency on receptive field overlap. Middle: nonoriented V1 and oriented V2 cells only interact when receptive fields are overlapped. Bottom: oriented V1 and nonoriented V2 cells interact only when receptive fields do not overlap. B: schematic view of possible anatomic relationships between color cells in V1 and V2. Nonoriented color cells in V1 blobs have large expansive arbors that contact nonoriented color cells in multiple thin stripes in V2, but only oriented color cells in single nearby thin stripes. Oriented color cells in V1 contact nonoriented V2 color cells only in distant thin stripes.
respect to the extent of orientation tuning, if any, and with respect to spatial overlap. Figure 8 summarizes the major types of V1–V2 interactions studied in this paper and their dependencies. Color cell pairs examined in this paper demonstrated a strong dependency on color-matching. Nonoriented color cell pairs are dependant primarily on color-matching and independent of receptive field overlap (Fig. 8A, top). Nonoriented V1 and oriented V2 cell pairs interact only when receptive fields exhibit spatial overlap (Fig. 8A, middle). In contrast, oriented V1 and nonoriented V2 cells interact when they are spatially distant and do not interact when overlapped (Fig. 8A, bottom). We will discuss functional and spatial specificity of V1–V2 interactions, followed by possible anatomic bases of these specific interactions, and conclude with a discussion on the relevance of these findings to color vision. Thus our findings, while confirming the view that the extent of functional and anatomic segregations is not total nor complete within V1 and V2 (e.g., for review, see Merigan and Maunsell 1993), nevertheless support the notion of a remarkably high degree of functional segregation overall. Discrepancies or uncertainties as to the extent of segregation often can be attributed to variability in cytochrome oxidase staining, which should only serve as one, imperfect, factor in such analyses. Functional and spatial specificity In V1, interactions among color blob cells exhibit a strong dependency on color matching; both common input and mono-
2727
synaptic interactions were observed (Ts’o and Gilbert 1988). Although color preferences in V2 have been shown to be more varied than those in V1 (see RESULTS) (Roe and Ts’o 1995; Ts’o et al. 1991; Yoshioka et al. 1996), we find interactions between V1 and V2 cells are also strongly color matched and are most commonly found between either red-green selective cell pairs or between blue-yellow selective cell pairs. Injections into thin stripes result in preferential labeling in V1 blobs spanning regions ;3 mm in extent (Livingstone and Hubel 1984, Figs. 25, 26a, 28, and 30). Our finding that some cell pairs interact only when their receptive fields overlap and others interact despite large spatial separation suggests that convergence/divergence factors are cell type specific. That is, different functional cell types are likely to participate in different size networks. Some types, such as nonoriented color cells, have far-reaching interactions, whereas others, such as color-oriented cells, are more restricted in their spatial interactions. At least two possibilities underlie this finding. One possibility is, for example, that single nonoriented color cells project to both nonoriented and oriented V2 color cells; however, although contacts with nonoriented cells are made by both nearby and far-reaching parts of the arbor, those with oriented cells are made only by nearby portions of the arbor (Fig. 8B). Alternatively, there could be separate nonoriented color cell populations, some with large arbors that contact nonoriented cells in V2; others with restricted arbors contacting oriented cells in V2. We found no evidence for different types of nonoriented color cells in V1. However, single axon arbor reconstructions (Rockland and Virga 1990) suggest the presence of at least two arbor types projecting from V1 to V2, one that terminates in one or two 200-mm-size clusters separated by 500 –1,000 mm and another that is much larger (#3 mm in extent) and more diffuse in termination pattern; it is not known in which V2 stripes these arbors terminate. These arbor types could provide the anatomic substrate for both focal innervation of individual stripes, of subcompartments within stripes (e.g., nonoriented versus oriented color regions of a thin stripe), and focal innervation of multiple (thin) stripes. Sources of common input, feedforward, and feedback interactions The fact that a majority of V1–V2 correlograms are centered on zero suggests that coincidence of firing is driven by common inputs (Bullier et al. 1992; Nelson et al. 1992; Roe and Ts’o 1997). However, the width of V1–V2 correlograms also suggest the presence of both feedforward (positive latencies) and feedback (negative latencies) interactions (discussed below). Possible sources of common input include the thalamus, V1, V2, or feedback from other cortical areas. It is unlikely that these specific interactions are due to thalamic input, either geniculate or pulvinar in origin. The possibility that common drive arises from topographically appropriate LGN (lateral geniculate nucleus) color inputs to V1 and subsequently to V2 is inconsistent with peaks centered on zero, as this would result in peaks with positive shifts. Furthermore, such inputs would not result in differences in connectional specificity seen here. Neither are divergent inputs from the LGN to V1 and V2 likely to provide significant direct common drive. Direct inputs from the LGN to V2 are quite
2728
A. W. ROE AND D. Y. TS’O
sparse (arising almost exclusively from the S layers and interlaminar zones) and cells projecting to both V1 and V2 virtually nonexistent (Bullier and Kennedy 1983; Kennedy and Bullier 1985). Thus the LGN is an unlikely source of common input to V1 and V2. The pulvinar is also known to provide some anatomic inputs to V1 and V2 in the macaque. After topographically corresponding injections of different tracers into V1 and V2, ;10% of all pulvinar neurons labeled (both PL and PL-PI of the lateral inferior pulvinar) were double-labeled (Bullier and Kennedy 1985, Table 6). Pulvinar inputs to V2 project preferentially to the thin and thick cytochrome oxidase stripes (Curcio and Harting 1978; Levitt et al. 1995; Ogren and Hendrickson 1977); however, it is not known whether they project to (e.g., color specific) substripe compartments within V2. Moreover, not only are pulvinar inputs to V1 diffuse and terminate primarily in layer 1 (Ogren and Hendrickson 1977), but the degree of their topographic precision is uncertain (cf. Kennedy and Bullier 1985; Perkel et al. 1986). Finally, lesions of the pulvinar do not lead to deficits of sensory processing per se but rather to deficits involving saliency and attentional modulation (Robinson and Cowie 1997). Thus for reasons of anatomic specificity, robustness, and functionality, pulvinar inputs are unlikely to be the primary contributor to correlation between V1 and V2 activity observed in this study. Finally, feedback projections from other cortical areas beyond V2 also are thought to be poor in topographic precision and more diffuse in nature, making them a less likely distinguishing source of common input (e.g., Salin and Bullier 1995; Shipp and Zeki 1989). In conclusion, we believe that neurons within V1 and V2 are likely to be the most dominant sources of common input observed between V1 and V2 color cells. These inputs could act directly or indirectly; however, because cross-correlation is known to be poor at detecting polysynaptic interactions (for review, see Fetz et al. 1991), it is likely that the interactions observed in this study are due to direct interactions. One candidate for direct common input would be the superficial layer pyramidal cells located in cytochrome oxidase blobs. Cells in V1 blobs not only have locally specific connectivity (Livingstone and Hubel 1984; Ts’o and Gilbert 1988) but also exhibit specific projections to thin stripes in V2 (Livingstone and Hubel 1984; Rockland and Virga 1990). Given the fact that extrinsically-projecting pyramidal cells are known to give off local collaterals, it is quite likely that single blob cells have terminations both in nearby blobs as well as in V2 thin stripes. These neurons are thus well positioned to give rise to common input to nonoriented V1/nonoriented V2 interactions as well as nonoriented V1/oriented V2 interactions. In a similar fashion, neurons in V2 thin stripes also could give rise to V1–V2 coincidence via a feedback projection and a local collateral.
spatial precision would not be necessary (Morgan and Aiba 1985). In contrast, spatial overlap is apparently crucial for the interaction between nonoriented V1 cells and oriented V2 cells. Such emphasis on spatial precision may underlie the encoding of color contours via the convergence of nonoriented V1 inputs, similar to the way in which nonoriented thalamic inputs are thought to converge onto V1 cells to generate orientation selectivity (Chapman et al. 1991; Hubel and Wiesel 1962; Reid and Alonso 1995; Toyama et al. 1977a,b). Interestingly, similarity in orientation selectivity is not a predictor of interaction between color oriented V1–V2 cell pairs (unpublished data), suggesting that orientation tuning of color oriented cells in V2 is not propagated from V1 but is generated de novo in V2. The surprising finding that color-oriented cells in V1 interact only with nonoverlapping nonoriented V2 cells suggests yet a different functional role. These distant interactions between orientation-selective V1 cells and nonoriented V2 cells may play a role in color and brightness induction from object boundaries or from other types of inducing lines (e.g., see Ejima and Takahashi 1988; McIlhagga and Mullen 1996; Rossi et al. 1996). For example, in the Craik-Cornsweet illusion, as a result of an intervening local border contrast, two distant regions of equal color/luminance appear different in color/ luminance. The feed-forward interaction between oriented V1 cells and nonoverlapping V2 color cells may be a pathway by which border percepts are propagated to distant regions of color or brightness. In conclusion, the specific color interactions described in this paper suggest multiple color pathways between V1 and V2, each with its specific spatial specificities. Interactions between some V1/V2 color cell pairs (nonoriented/nonoriented color cell interactions) occurred over large spatial extents, suggesting a role for these connections in perception of surface brightness/color properties. Other interactions observed suggested a dedicated processing pathway for color contour perception (nonoriented/oriented color cell interactions) and color border induction effects (oriented/nonoriented color cell interactions). The progressive elaboration in receptive field properties of the cells of V1 and V2, and the concomitant increase in the variety of possible interconnections and interactions between these cells then may form the neuronal basis for the wide variety of perceptual abilities and phenomena that we experience in our visual world. We thank M. Shadlen for constructive comments on this manuscript and L. Hinderstein and C. LoRusso for excellent technical support. This work was supported by National Eye Institute Grants EY-06347 and EY-08240 and by the McKnight and Whitaker Foundations. Address for reprint requests: A. W. Roe, Section in Neurobiology, Yale University School of Medicine, 333 Cedar St., SHM I-412, New Haven, CT 06510. Received 23 December 1998; accepted in final form 17 June 1999.
Color Vision The marked differences in spatial dependence of the three types of interactions suggests differences in their functional roles in color vision. The fact that spatially distant nonoriented color cells are strongly correlated suggests a possible role for these interactions in the propagation of fill-in of color as a surface property. Not only would color-matching be important for the “coloring in” of a bounded surface, but a high degree of
REFERENCES BAIZER, J. S., ROBINSON, D. L., AND DOW, B. M. Visual responses of area 18 neurons in awake, behaving monkey. J. Neurophysiol. 40: 1024 –1037, 1977. BAUER, R., BROSCH, M., AND ECKHORN, R. Different rules of spatial summation from beyond the receptive field for spike rates and oscillation amplitudes in cat visual cortex. Brain Res. 669: 291–297, 1995. BLASDEL, G. G. Differential imaging of ocular dominance and orientation selectivity in monkey striate cortex. J. Neurosci. 12: 3115–3138, 1992a.
V1–V2 COLOR CONNECTIVITY IN PRIMATES BLASDEL G. G. Orientation selectivity, preference, and continuity in monkey striate cortex. J. Neurosci. 12: 3139 –3161, 1992b. BROSCH, M., BAUER, R., AND ECKHORN, R. Synchronous high-frequency oscillations in cat area 18. Eur. J. Neurosci. 7: 86 –95, 1995. BROSCH, M., BAUER, R., AND ECKHORN, R. Stimulus-dependent modulations of correlated high-frequency oscillations in cat visual cortex. Cereb. Cortex. 7: 70 –76, 1997. BULLIER, J. AND KENNEDY, H. Projection of the lateral geniculate nucleus onto cortical area V2 in the Macaque monkey. Exp. Brain Res. 53: 168 –172, 1983. BULLIER, J., MUNK, M.H.J., AND NOWAK, L. G. Synchronization of neuronal firing in areas V1 and V2 of the monkey. Soc. Neurosci. Abstr. 18: 11, 1992. BURKHALTER, A. AND VAN ESSEN, D. C. Processing of color, form and disparity information in visual areas VP and V2 of ventral extrastriate cortex in the macaque monkey. J. Neurosci. 6: 2327–2351, 1986. CHAPMAN, B., ZAHS, K. R., AND STRYKER, M. P. Relation of cortical cell orientation selectivity to alignment of receptive fields of the geniculocortical afferents that arborize within a single orientation column in ferret visual cortex. J. Neurosci. 11: 1347–1358, 1991. CURCIO, C. A. AND HARTING, J. K. Organization of pulvinar afferents to area 18 in the squirrel monkey: evidence for stripes. Brain Res. 143: 155–161, 1978. DAW, N. W. Goldfish retina: organization for simultaneous color contrast. Science 158: 942–944, 1967. DEYOE, E. A. AND VAN ESSEN, D. C. Segregation of efferent connections and receptive field properties in visual area V2 of the macaque. Nature 317: 58 – 61, 1985. DEYOE, E. A. AND VAN ESSEN, D. C. Concurrent processing streams in monkey visual cortex. Trends Neurosci. 11: 219 –226, 1988. EJIMA, Y. AND TAKAHASHI, S. Illusory contours induced by isoluminant chromatic patterns. Vision Res. 28: 1367–1377, 1988. FELLEMAN, D. J., XIAO, Y. AND MCCLENDON, E. Modular organization of occipito-temporal pathways: cortical connections between visual area 4 and visual area 2 and posterior inferotemporal ventral area in Macaque monkeys. J. Neurosci. 17: 3185–3200, 1997. FETZ, E., TOYAMA, K., AND SMITH, W. Synaptic interactions between cortical neurons. In: Cerebral Cortex, edited by A. Peters. New York: Plenum, 1991, vol. 9, p. 1– 47. FRIEN, A., ECKHORN, R., BAUER, R., WOELBERN, T., AND KEHR, H. Stimulusspecific fast oscillations at zero phase between visual areas V1 and V2 of awake monkey. Neuroreport. 5: 2273–2277, 1994. FROSTIG, R. D., LIEKE, E. E., TS’O, D. Y., AND GRINVALD, A. M. Cortical functional architecture and local coupling between neuronal activity and the microcirculation revealed by in vivo high-resolution optical imaging of intrinsic signals. Proc. Natl. Acad. Sci. USA 87: 6082– 6086, 1990. GEGENFURTNER, K. R., KIPER, D. C., AND FENSTEMAKER, S. B. Processing of color, form, and motion in macaque area V2. Vis. Neurosci. 13: 161–172, 1996. GEGENFURTNER, K. R., KIPER, D. C., AND LEVITT, J. B. Functional properties of neurons in macaque area V3. J. Neurophysiol. 77: 1906 –1923, 1997. GIRARD, P. AND BULLIER, J. Visual activity in area V2 during reversible inactivation of area 17 in the macaque monkey. J. Neurophysiol. 62: 1287–1302, 1989. GOURAS, P. AND KRUGER, J. Responses of cells in foveal visual cortex of the monkey to pure color contrast. J. Neurophysiol. 42: 850 – 860, 1979. GRINVALD, A., FROSTIG, R. D., LIEKE, E., AND HILDESHEIM, R. Optical imaging of neuronal activity. Physiol. Rev. 68: 1285–1365, 1988. GRINVALD, A., LIEKE, E., FROSTIG, R. D., GILBERT, C. D., AND WIESEL, T. N. Functional architecture of cortex revealed by optical imaging of intrinsic signals. Nature 324: 361–364, 1986. HORTON, J. Cytochrome oxidase patches: a new cytoarchitectonic feature of monkey visual cortex. Philos. Trans. Royal Soc. Lond. 304: 199 –253, 1984. HUBEL, D. H. AND LIVINGSTONE, M. S. Segregation of form, color, and stereopsis in primate area 18. J. Neurosci. 7: 3378 –3415, 1987. HUBEL, D. H. AND WIESEL, T. N. Receptive fields, binocular interaction, and functional architecture in the cat’s visual cortex. J. Physiol. (Lond.) 160: 106 –154, 1962. KENNEDY, H. AND BULLIER, J. A double-labelling investigation of the afferent connectivity to cortical areas V1 and V2 of the macaque monkey. J. Neurosci. 5: 2815–2830, 1985. LANDISMAN, C. E., ROE, A. W., AND TS’O, D. Y. The relationship of receptive field coverage to functional modules in primate V1. Soc. Neurosci. Abstr. 20: 1477, 1994. LENNIE, P., KRAUSKOPF, J. AND SCLAR, G. Chromatic mechanisms in striate cortex of macaque. J. Neurosci. 10: 649 – 669, 1990.
2729
LEVENTHAL, A. G., THOMPSON, K. G., LIU, D., ZHOU, Y., AND AULT, S. J. Concomitant sensitivity to orientation, direction, and color of cells in layers 2, 3, and 4 of monkey striate cortex. J. Neurosci. 15: 1808 –1818, 1995. LEVITT, J. B., KIPER, D. C., AND MOVSHON, J. A. Receptive fields and functional architecture of macaque V2. J. Neurophysiol. 71: 2517–2542, 1994. LEVITT, J. B., YOSHIOKA, T. AND LUND, J. S. Connections between the pulvinar complex and cytochrome oxidase-defined compartments in visual area V2 of macaque monkey. Exp. Brain Res. 104: 419 – 430, 1995. LIVINGSTONE, M. S. AND HUBEL, D. H. Anatomy and physiology of a color system in the primate visual cortex. J. Neurosci. 4: 309 –356, 1984. LIVINGSTONE, M. S. AND HUBEL, D. H. Connections between layer 4B of area 17 and the thick cytochrome oxidase stripes of area 18 in the squirrel monkey. J Neurosci. 7: 3371–3377, 1987a. LIVINGSTONE, M. S. AND HUBEL, D. H. Psychophysical evidence for separate channels for the perception of form, color, and movement, and depth. J. Neurosci. 7: 3416 –3468, 1987b. MALACH, R., TOOTELL, R.B.H., AND MALONEK, D. Relationship between orientation domains, cytochrome oxidase stripes, and intrinsic horizontal connections in squirrel monkey area V2. Cereb. Cortex. 4: 151–165, 1994. MCILHAGGA, W. H. AND MULLEN, K. T. Contour integration with color and luminance contrast. Vision Res. 36: 1265–1279, 1996. MERIGAN, W. H. AND MAUNSELL, J.H.R. How parallel are the visual pathways? Annu. Rev. Neurosci. 16: 369 – 402, 1993. MIGNARD, M. AND MALPELI, J. G. Paths of information flow through visual cortex. Science 251: 1249 –1251, 1991. MORGAN, M. J. AND AIBA, T. S. Positional acuity with chromatic stimuli. Vision Res. 25: 689 – 695, 1985. NELSON, J. I., SALIN, P. A., MUNK, H. J., ARZI, M., AND BULLIER, J. Spatial and temporal coherence in cortico-cortical connections: a cross correlation study in areas 17 and 18 in the cat. Vis. Neurosci. 9: 21–37, 1992. NOWAK, L. G., MUNK, M. H. J., JAMES, A. C., GIRARD, P., AND BULLIER, J. Cross-correlation study of the temporal interactions between areas V1 and V2 of the Macaque monkey. J. Neurophysiol. 81: 1057–1074, 1999. NOWAK, L. G., MUNK, M.H.J., NELSON, J. I., JAMES, A. C., AND BULLIER, J. Structural basis of cortical synchronization. I. Three types of interhemispheric coupling. J. Neurophysiol. 74: 2379 –2400, 1995. OGREN, M. P. AND HENDRICKSON, A. E. The distribution of pulvinar terminals in visual areas 17 and 18 of the monkey. Brain Res. 137: 343–350, 1977. PERKEL, D. H., GERSTEIN, G. L. AND MOORE, G. P. Neuronal spike trains and stochastic point processes. I. Simultaneous spike train. Biophys. J. 7: 419 – 440, 1966. PERKEL, D. J., BULLIER, J., AND KENNEDY, H. Topography of the afferent connectivity of area 17 in the Macaque monkey: a double-labelling study. J. Comp. Neurol. 253: 374 – 402, 1986. REID, R. C. AND ALONSO, J. M. Specificity of monosynaptic connections from thalamus to visual cortex. Nature 378: 281–284, 1995. ROBINSON, D. L. AND COWIE, R. J. The primate pulvinar: structural, functional, and behavioral components of visual salience. In: The Thalamus, edited by D. McCormick. New York: Elsevier, 1997, p. 53–92. ROCKLAND, K. S. AND VIRGA, A. Orgnization of individual cortical axons projecting from area V1 (area 17) to V2 (area 18) in the macaque monkey. Vis. Neurosci. 4: 11–28, 1990. ROE, A. W. AND TS’O, D. Y. Functional connectivity between V1 and V2 in the primate. Soc. Neurosci. Abstr. 18: 11, 1992. ROE, A. W. AND TS’O, D. Y. Visual field representation within primate V2 and its relationship to the functionally distinct stripes. Invest. Opthalmol. Vis. Res. 34: 812, 1993a. ROE, A. W. AND TS’O, D. Y. Visual representation and functional compartments within single V2 stripes. Soc Neurosci Abstr. 19: 1499, 1993b. ROE, A, W. AND TS’O, D. Y. Relationships between topographic maps in V1 and V2 revealed by optical imaging with spot stimuli. Soc. Neurosci. Abstr. 20: 840, 1994. ROE, A. W. AND TS’O, D. Y. Visual topography in primate V2: multiple representation across functional stripes. J. Neurosci. 15: 3689 –3715, 1995. ROE, A. W. AND TS’O, D. Y. The functional architecture of primate V2. In: Cerebral Cortex, edited by K. S. Rockland, J. H. Kaas, and A. Peters. New York: Plenum, 1997, p. 295–333. ROSSI, A. F., RITTENHOUSE, C. D., AND PARADISO, M. A. The representation of brightness in primary visual cortex. Science 273: 1104 –1107, 1996. SALIN, P. A. AND BULLIER, J. Corticocortical connections in the visual system: structure and function. Physiol. Rev. 75: 107–154, 1995. SALIN, P. A., GIRARD, P., KENNEDY, H., AND BULLIER, J. Visuotopic organization of corticocortical connections in the visual system of the cat. J. Comp. Neurol. 320: 415– 434, 1992.
2730
A. W. ROE AND D. Y. TS’O
SHIPP, S. AND ZEKI, S. The organization of connections between areas V5 and V2 in macaque monkey visual cortex. Eur. J. Neurosci. 1: 333–354, 1989. TANAKA, K. Organization of geniculate inputs to visual cortical cells in the cat. Vision Res. 25: 357–364, 1985. TOOTELL, R.B.H., SILVERMAN, M. S., HAMILTONM S, L., DE VALOIS, R. L., AND SWITKES, E. Functional anatomy of Macaque striate cortex. III. Color. J. Neurosci. 8: 1569 –1593, 1988. TOOTELL, R.B.H. AND HAMILTON, S. L. Functional anatomy of the second visual area (V2) in the Macaque. J. Neurosci. 9: 2620 –2644, 1989. TOYAMA, K., KIMURA, M., SHIDA, T., AND TAKEDA, T. Convergence of retinal input onto visual cortical cells. II. A study of the cells disynaptically excited from the lateral geniculate body. Brain Res. 137: 207–220, 1977a. TOYAMA, K., KIMURA, M., SHIDA, T., AND TAKEDA, T. Convergence of retinal input onto visual cortical cells. II. A study of the cells monosynaptically excited from the lateral geniculate body. Brain Res. 137: 221–231, 1977b. TS’O, D. Y., FROSTIG, R. D., LIEKE, E. E., AND GRINVALD, A. Functional organization of primate visual cortex revealed by high resolution optical imaging. Science 249: 417– 420, 1990a. TS’O, D. Y. AND GILBERT, C. D. The organization of chromatic and spatial interactions in the primate striate cortex. J. Neurosci. 8: 1712–1727, 1988. TS’O, D. Y., GILBERT, C. D., FROSTIG, R. D., GRINVALD, A., AND WIESEL, T. N. Functional architecture of visual area 18 of macaque monkey. Soc. Neurosci. Abstr. 15: 161, 1989.
TS’O, D. Y., GILBERT, C. D., AND WIESEL, T. N. Relationships between horizontal interactions and functional architecture in the cat striate cortex as revealed by cross-correlation analysis. J. Neurosci. 6: 1160 –1170, 1986. TS’O, D. Y., GILBERT, C. D. AND WIESEL, T. N. Functional architecture of color and disparity in visual area 2 of macaque monkey. Soc. Neurosci. Abstr. 16: 293, 1990b. TS’O, D. Y., GILBERT, C. D., AND WIESEL, T. N. Orientation selectivity of and interactions between color and disparity subcompartments in area V2 of Macaque monkey. Soc. Neurosci. Abstr. 17: 1089, 1991. VAUTIN, R. G. AND DOW, B. M. Color cell groups in foveal striate cortex of the behaving macaque. J. Neurophysiol. 54: 273–292, 1985. WIESEL, T. N. AND HUBEL, D. H. Spatial and chromatic interactions in the lateral geniculate body of the rhesus monkey. J. Neurophysiol. 29: 1115– 1156, 1966. WONG-RILEY, M.T.T., HEVNER, R. F., CUTLAN, R., EARNEST, M., EGAN, R., FROST, J., AND NGUYEN, T. Cytochrome oxidase in the human visual cortex: distribution in the developing and the adult brain. Vis. Neurosci. 10: 41–58, 1993. YOSHIOKA, T., DOW, B. M., AND VAUTIN, R. G. Neuronal mechanisms of color categorization in areas V1, V2, and V4 of macaque monkey visual cortex. Behav. Brain Res. 76: 51–70, 1996. YOSHIOKA, T. AND DOW, B. M. Color, orientation, and cytochrome oxidase reactivity in areas V1, V2, and V4 of macaque monkey visual cortex. Behav. Brain Res. 76: 71– 88, 1996.