STEPHEN B. MILNE, H. ALEX BROWN, and WALTER A. SHAW. 8.1. PREPARATION ...... Friedman P, Haimovitz R, Markman O, Roberts MF, Shinizky M. 1996.
CHAPTER 8
Standardization and Quantification of Lysophosphatidic Acid Compounds by Normal-Phase and Reversed-Phase Chromatography–Tandem Mass Spectrometry JEFF D. MOORE, SHENGRONG LI, DAVID S. MYERS, STEPHEN B. MILNE, H. ALEX BROWN, and WALTER A. SHAW
8.1. PREPARATION AND HANDLING OF LYSOPHOSPHATIDIC ACID (LPA) COMPOUNDS The ability to perform quantitative measurement of LPA compounds by liquid chromatography–tandem quadrupole mass spectrometry (LC/MS/MS) requires the availability of standard materials of confirmed structure and known concentration and purity. Preparation, storage, and handling of LPA compounds or working solutions are also of concern. The assay of standard materials prior to use is important in assuring accurate quantitative results, while proper usage techniques will provide repeatable performance over time. Proton (1H) nuclear magnetic resonance (NMR) and phosphorus (31P) NMR of LPA standard compounds is a means of structural confirmation. Assay of standard solutions by high-performance liquid chromatography with evaporative light scattering detection (HPLC/ELSD) and LC/MS/MS scanning for the negatively charged precursors of 153 Da allows determination of purity for nonphospholipid and phospholipid contaminants, respectively. Standards of LPA compounds are available in different physical states. Saturated compounds are typically provided as weighable powders. Unsaturated compounds are generally provided as solutions in solvent at a reported concentration. Moisture in powders and solutions of unsaturated compounds is of
Lysophospholipid Receptors: Signaling and Biochemistry, First Edition. Edited by Jerold Chun, Timothy Hla, Sara Spiegel, and Wouter Moolenaar. © 2013 John Wiley & Sons, Inc. Published 2013 by John Wiley & Sons, Inc.
137
138
STANDARDIZATION AND QUANTIFICATION OF LPA COMPOUNDS
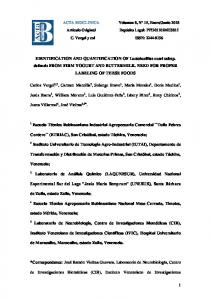
concern for final purity and affects final solution concentration. Stock solution concentrations greater than ∼0.5 mg/mL can be measured with a colorimetric phosphorus assay or using the 31P NMR method conditions with suitable internal standard described herein. The solubility of LPA molecules is sometimes problematic. The phosphate head group and increased polarity of the LPA molecule require solvent solutions that contain 2–5% water by volume. LPA solutions of >10 mg/mL can be prepared in chloroform : methanol : water mixtures ranging in composition from 80:20:2 to 65:35:8 (v/v/v). Less concentrated solutions more suitable for mass spectrometry in the range of 0.1–1.0 μg/ mL can be prepared in methanol alone. Our typical practice is to make concentrated stocks in chloroform : methanol : water mixtures followed by dilution into methanol for concentrations below 0.1 mg/mL. The cationic counterion of the phosphate head group also affects solubility. Sodium and ammonium salt forms appear to be reasonably more soluble than calcium. Calcium promotes aggregation through bridging of phosphatidic acids. Compounds with less than 1000 ppm of calcium are readily dissolved. Upon careful analysis and preparation of LPA standard solutions, care should be taken in handling and storage to maintain the desired purity and stability needed. Use of polypropylene and other plastic labware is not recommended for measurement and sample extraction procedures. An understanding of the chemical resistance for pipette tips and other nonglass labware is essential to prevent contamination of lipid solutions. Our laboratory uses glass only containers, tubes, and pipettes when working with stock solutions containing chloroform or other highly nonpolar solvents. Most polypropylene materials have a higher resistance to alcohols, dilute acids and bases, and aqueous solutions. Measurement and dilution of working solutions using these materials should always follow an evaluation of introduction of signal interference or artifacts into the material and analytical instrumentation utilized. Reagent blanks utilizing the exact solvents, pipettes, and containers as standards and samples should always be part of an analysis. Our laboratory store solids and solutions of LPA compounds at −16 to 24°C in sealed screw-cap bottles of USP/pharmaceutical grade I amber glass. This practice minimizes evaporation of solvents, hydrolysis of esters, oxidation of double bonds in storage, and UV exposure in the laboratory. For compounds that are utilized routinely, it is best to package working solutions or solids in sealable ampoules. Solutions of 13:0 LPA and 17:1 LPA at 10 μg/mL in degassed HPLC grade methanol were flame sealed into amber Fiolax™ (Schott, Elmsworth, NY) ampoules. These solutions were stable for >24 months stored at −16 to 24°C. When storing, or especially extracting cyclic LPA (cLPA) compounds, one should avoid using acidic conditions whenever possible. Acidic ring opening of cLPA species will yield LPA compounds with the fatty acid on either the sn-1 or sn-2 position (Fig. 8.1). LPA compounds of biological interest include the esters, ethers, cyclic phosphate esters, and cyclic phosphate ethers. A select few of these compounds
1
H AND
139
22.86
1.9e7
O O
H O O
1.6e7 Intensity (cps)
P NMR CHARACTERIZATION
31
O–
P
H O
OH
HO
O
O
P
HO
OH
O–
O
19.31
1.2e7 8.0e6 4.0e6 0.0
5
10
15
20 25 30 35 Time (minutes)
40
45
50
Figure 8.1. LC/MS extraction ion chromatogram of LPAs formed following acidic ring opening of cyclic LPA. LPAs with fatty acids on the sn-1 or sn-2 position can be formed when samples are extracted in the presence of acid.
pertinent to LPA lipidomic pursuits are commercially available. Table 8.1 lists the compounds used. Representative compounds of the LPA–esters, cLPA– esters, LPA–ethers, and cyclic–LPA ethers were assayed by 1H and 31P NMR for interpretive structural analysis. These compounds were also used in normalphase LC/MS/MS and reversed-phase ultra performance liquid chromatography (UPLC)/MS/MS techniques. 8.2. 1H AND
31
P NMR CHARACTERIZATION
Proton NMR samples were prepared by dissolving lipids in CDCl3 : CD3OD : D2O (80:20:2 v/v) at 5 mg/mL. Tetramethylsilane (TMS, 0.05% v/v) was used as internal standard, and TMS peak was calibrated as δ 0.00 ppm. The spectra were recorded with Bruker Avance III 400 MHz system with 5-mm PABBO probe and 24 place autosampler at 310K. The following spectra conditions were used in proton NMR analysis: one pulse with 13.6-µs pulse width (30 degree flip angle), 4-second acquisition time, and 1-second cycling delay. Phosphorus-31 NMR spectra were measured in cholate buffer solution. To make 20 mL of cholate buffer solution, 72 mg of ethylenediaminetetraacetic acid (EDTA) disodium salt and 1.72 g of sodium cholate were dissolved in 18 mL deionized water and 2 mL deuterium oxide. The solution was adjusted to pH 7.8 with 30% sodium deuteroxide solution. Lipids were dissolved in the
140
Ester–LPA compounds 1-Hexanoyl-2-hydroxy-sn-glycero-3-phosphate (ammonium salt) 1-Tridecanoyl-2-hydroxy-sn-glycero-3-phosphate (ammonium salt) 1-Myristoyl-2-hydroxy-sn-glycero-3-phosphate (sodium salt) 1-Hexadecanoyl-sn-glycero-3-phosphate (sodium salt) 1-(10Z-heptadecenoyl)-sn-glycero-3-phosphate (ammonium salt) 1-Heptadecanoyl-2-hydroxy-sn-glycero-3-phosphate (sodium salt) 1-(9Z-octadecenoyl)-sn-glycero-3-phosphate (sodium salt) 1-Octadecanoyl-sn-glycero-3-phosphate (sodium salt) 1-Arachidonoyl-2-hydroxy-sn-glycero-3-phosphate (ammonium salt) Ether–LPA compounds 1-O-octadecyl-2-hydroxy-sn-glycero-3-phosphate (ammonium salt) 1-(9Z-octadecenyl)-2-hydroxy-sn-glycero-3-phosphate (ammonium salt) Cyclic–LPA compounds 1-Palmitoyl-sn-glycero-2,3-cyclic-phosphate (ammonium salt) 1-Heptadecanoyl-glycero-2,3-cyclic-phosphate (ammonium salt) 1-Oleoyl-sn-glycero-2,3-cyclic-phosphate (ammonium salt) Ether cyclic–LPA compounds 1-O-hexadecyl-sn-glycero-2,3-cyclic-phosphate (ammonium salt) 1-O-(9Z-octadecenyl)-sn-glycero-2,3-cyclic-phosphate (ammonium salt)
Name
TABLE 8.1. Lysophosphatidic Acid (LPA) Standard Materials
C9H22NO7P C16H36NO7P C17H34O7PNa C19H38NaO7P C20H42NO7P C20H40NaO7P C21H40NaO7P C21H42NaO7P C23H42NO7P C21H48NO6P C21H46NO6P C19H40NO6P C20H42NO6P C21H42NO6P C19H42NO5P C21H44NO5P
C18 LPA C18:1 LPA 16:0 cLPA 17:0 cLPA 18:1 cLPA C16 cLPA C18:1 cLPA
Formula
06:0 LPA 13:0 LPA 14:0 LPA 16:0 LPA 17:1 LPA 17:0 LPA 18:1 LPA 18:0 LPA 20:4 LPA
Abbreviation
395.51 421.55
409.50 423.52 435.54
441.58 439.57
287.25 385.43 404.41 432.46 439.52 446.49 458.50 460.52 475.56
MW
395.28 421.30
409.26 423.28 435.28
441.32 439.31
287.11 385.22 404.41 432.23 439.27 446.24 458.24 460.26 475.27
Exact Mass
LC/MS/MS of LPA Compounds
141
buffer at ∼5 mg/mL, and spectra were recorded with Bruker Avance III 400 MHz system with 5-mm PABBO probe and 24 place autosampler at 310K within 12 hours after the samples were prepared. Triphenylphosphine (TPP, 5 mg) was added as an internal standard and TPP peak was calibrated as δ −17.80 ppm. The spectra conditions used for 31P NMR analysis was conducted using a 13.7-µs pulse width (30 degree flip angle) with Waltz16 composite pulse proton decoupling, 1-second acquisition time, and 3-second cycling delay.
8.3. LC/MS/MS OF LPA COMPOUNDS 8.3.1. Reversed-Phase UPLC/MS/MS All solvents used were HPLC grade purchased from EMD Chemicals (Gibbstown, NJ). Chemicals and reagents were ACS grade or higher. All LPA compounds were synthesized and characterized to be >99% pure by Avanti Polar Lipids (Alabaster, AL). Each compound was initially prepared as a stock solution in methanol at ∼100 μM in amber screw-cap bottles and stored at −16 to 24°C. Each was evaluated by infusing a 0.1 μM, 98.5:1.5:0.08 (v/v/v) methanol : acetic acid : triethylamine solution at 20 μL/min into an AB Sciex (Foster City, CA) 5500 QTrap mass spectrometry system. The declustering potential (DP), collision energy (CE), and collision exit potential (CXP) were optimized for the [M − H]− m/z and major fragments of each using the compound optimization routine of the Analyst™ 1.5.1 software over a mass range of 60–475 u. A common entrance potential setting of −10 was used for all compounds. Curtain gas (CUR) was set at 20.00. The CAD was set to medium with a source nebulization temperature of 50°C. Gas 1 and Gas 2 were set to 20 and 0, respectively. Ion spray voltage was set to −4500 V. A working mixed solution was prepared in methanol to contain 5 μM of each biologically relevant LPA compound. A separate 1 μM methanol solution of 13:0 LPA, 17:0 LPA, 17:1 LPA, and 17:0 cLPA was prepared as an internal standard mixture. The 5 μM standard mixture was serially diluted in methanol to obtain a concentration range of 5000–19 nM for each sample. The 1 μM internal standard solution was diluted 1:10 into each dilution of the standard curve. One microliter of each dilution was injected onto a Waters (Millford, MA) Acquity UPLC system with an Acquity UPLC® 50 mm × 1.2 mm i.d., 1.7-µm BEH-C18 column. A 1 mL/min gradient of 100% 70:28.5:1.5:0.08 (v/v/v/v) methanol : water, acetic acid : triethylamine to 100% 98.5:1.5:0.08 (v/v/v) methanol : acetic acid : triethylamine over 4 minutes and held for 1 minute. The pumps were immediately switched back to 100% 70:28.5:1.5:0.08 (v/v/v/v) methanol : water, acetic acid : triethylamine and equilibrated for 2 minutes prior to the next injection. The column was maintained at 50°C throughout the run. Initial condition’s pressure was nominally 11,000 psi. All sample dilutions were maintained at 15°C in the autosampler compartment with injection performed with a 10-μL injection loop prefill routine with methanol. The column flow was
142
STANDARDIZATION AND QUANTIFICATION OF LPA COMPOUNDS
directly attached to the AB Sciex 5500 QTrap source held at a nebulization temperature of 500°C. The gases were increased to settings of 50 for both gases 1 and 2. The detector was programmed selectively for each compound in the standard and internal standard mixtures according to the DP, CE, and CXP settings derived from the flow infusion optimization routine. The [M − H]− m/z was used as the Q1 ion and its predominant fragment as the Q2 ion in a multiple reaction monitoring (MRM) technique. Each compound was assayed using a scheduled MRM protocol provided by the Analyst 1.5.1 software, whereby the retention time of each compound activates the respective MRMs within a 30-second window. All MRMs were collected with a target scan rate of 1 second. This allowed >10 scans across ion peaks of 0.04–0.07 minutes at half peak height. Each ion peak from the standard and internal standard mixtures were integrated using AB Sciex MultiQuant™ 2.0.2 software respective to compound. Both sn-1 and sn-2 positional isomers of LPA esters were integrated together for calibration as total LPA molecular species. A linear LPA analyte/internal standard response curve with 1/x weighting was generated for each. The internal standard utilized in the response curve of each LPA was chosen by molecular similarity. The 13:0 LPA was used for LPAs containing less than 16 carbons. The 17:0 LPA was used for saturated LPA esters and cLPA ethers. The 17:1 LPA was used for unsaturated LPA ester and cLPA ethers. The 17:0 cLPA was used for cLPA esters.
8.3.2. Normal-Phase LC/MS/LIT After solvent evaporation, the resulting lipid film is dissolved in 100 μL of isopropanol (IPA) : hexane : 100 mM NH4CO2H(aq) 58:40:2 (mobile phase A). For our examples, we utilized an Applied Biosystems/MDS SCIEX 4000 QTRAP hybrid triple quadrupole/linear ion trap mass spectrometer (Applied Biosystems, Foster City, CA). Coupled to this instrument was a Shimadzu (Shimadzu Scientific Instruments, Inc., Columbia, MD) HPLC system consisting of an SCL 10 AVP controller, two LC 10 ADVP pumps, and a CTC HTC PAL autosampler (Leap Technologies, Carrboro, NC). All samples were separated on a Phenomenex (Phenomenex, Torrance, CA) Luna Silica column (2 × 250 mm, 5-µm particle size) using a 20-μL sample injection. Lipids were separated using a binary gradient program consisting of IPA : hexane : 100 mM NH4CO2H(aq) 58:40:2 (mobile phase A) and IPA : hexane : 100 mM NH4CO2H(aq) 50:40:10 (mobile phase B). The following LC gradient was used: 0–5 minutes, B = 50%; 5–30 minutes, B = 50–100%; 30–40 minutes, B = 100%; 40–41 minutes, B = 100–50%; and 41–50 minutes, B = 50%. The mobile phase was delivered at a flow rate of 0.3 mL/min. The MS spectra were acquired in negative instrument mode using a turbo spray source operated at 450°C with an ion voltage of −3500 V, and nitrogen as curtain and nebulizer gas. The CUR was 30 L/h, and ion source gases 1 and 2 were both 50 L/h. The DP was −110 V, and the CE was −5 V. Scan type: EMS, unit resolution for Q1; scan
LC/MS/MS of LPA Compounds
143
rate: 1000 amu/s; scan range from m/z 350 to 1200, with the ion trap set for dynamic fill time. Normal-phase LC/MS allows for quantification of LPA amid complex mixtures that contain many other lipid classes as well. Picomolar levels can accurately be reported. The lipidomic workflow for integration of peaks and construction of standard curves for glycerophospholipids in general has been previously described (1–3), and the analysis for LPA is essentially similar. When quantifying individual LPA species, the selection of available internal standards should be made based on the acyl chain length and number of double bonds of the species of interest. Shorter-chain species with fewer double bonds appear to ionize more readily, and so response curves for polyunsaturated fatty acid (PUFA) species will be considerably different from saturated ones. The saturated and monounsaturated species display relatively similar instrument responses, while 20:4 LPA shows more evidence of asymptotic behavior at the highest standard addition assayed (Fig. 8.2). Furthermore, 16:0
1.00 0.75 0.50 0.25 0.00
0
25
50
75
18:0
1.25
pk area vs. 17:1
pk area vs. odd stds
1.25
1.00 0.75 0.50 0.25 0.00
100 125 150 175 200
0
25
50
ng addition
0.75 0.50 0.25 0.00
0
25
50
75
100 125 150 175 200
ng addition
20:4
0.75
pk area vs. 17:1
pk area vs. 17:1
1.00
100 125 150 175 200
ng addition
18:1
1.25
75
0.50
0.25
0.00
0
25
50
75
100 125 150 175 200
ng addition
Figure 8.2. Standard curves for four different LPA species conducted in a solvent background using second-order polynomial fits. The 16:0, 18:0, and 18:1 curves have relatively similar shapes. The 20:4 LPA curve shows more asymptotic behavior at the highest standard addition used (179 ng), and the instrument response for a given standard addition is lower than for the other species tested. Two odd carbon standards (13:0, 17:1) were used for normalization. For the 16:0 LPA curve, an arithmetic mean of the two odd carbon standards was used for this purpose, while for the other fits, only the 17:1 species was employed. Error bars indicate standard error (n = 3−6 replicates).
144
STANDARDIZATION AND QUANTIFICATION OF LPA COMPOUNDS
the 20:4 LPA response is lower than for the other non-PUFA species tested; that is, for a given multiple of the integrated peak area relative to the standards, there is more 20:4 present compared with other species tested. 8.4. DISCUSSION A summation of LPA 1H and 31P NMR results for LPA compounds are provided in Tables 8.2–8.4. In the proton NMR spectra, the formation of cyclic phosphate structure shifts sn-2 proton on glycerol backbone to down field by ∼0.7 ppm and is well separated from other proton peaks in both LPA and LPA ethers. This characteristic peak can be used to monitor the formation of cyclic phosphate structure by proton NMR. Smaller downfield shifts were also observed for sn-1 protons (∼0.1 ppm) and one of the sn-3 protons (∼0.26 ppm). The saturation difference on the acyl (alkanyl/alkenyl in the case of ether linkage) chain has no effect on the chemical shifts of glycerol protons, and the formation of cyclic phosphate structure does not affect the chemical shifts of the protons on acyl (alkyl/alkenyl) chain either. The ester linkage verse ether linkage in acyl (alkyl/alkenyl) chain in LPAs can be differentiated by the presence of alpha proton peaks (2.35 ppm) on acyl chain and much downfield sn-1 proton peaks in LPAs (with acyl chain). The formation of cyclic phosphate structure shifts 31P NMR peak to downfield by ∼15 ppm in both LPA and LPA ether. This distinct 31P peak for cyclic phosphate species was also well separated from other common phospholipid species (4). This property has been used by monitoring the enzymatic formation of cLPA in a biological system (5). Small chemical shift differences in 31P NMR spectra were also observed for ether linkages as compared with ester linkages and saturated acyl chains as compared with unsaturated acyl chains.
TABLE 8.2. The Proton NMR Peak Assignments of LPA and Cyclic–LPA with 18:1 and 16:0 Acyl Chain LPA (18:1) 1
Glycerol – CH2–OCO– –2CH–O– –3CH2–OP– Acyl chain
cLPA (18:1)
4.14(t, 5.1 Hz) 4.23(m) 3.90(m) 4.60(m) 3.98(m) 4.28(m), 3.98(m) –COCH2–R 2.35(t, 7.6 Hz) 2.35(t, 7.6 Hz) –COCH2CH2– 1.63(m) 1.63(m) CH2– 1.29(m) 1.29(m) –CH3 0.89(t, 6.9) 0.89(t, 6.9) 2.02(m) –CH=CH–CH2– 2.02(m) 5.35(m) –CH=CH–CH2– 5.35(m)
LPA (16:0)
cLPA (16:0)
4.14(t, 5.1 Hz) 4.23(m) 3.95(m) 4.60(m) 3.98(m) 4.28(m), 3.98(m) 2.35(t, 7.6 Hz) 2.35(t, 7.6 Hz) 1.59(m) 1.59(m) 1.26(m) 1.26(m) 0.88(t, 6.9) 0.88(t, 6.9)
Discussion
145
TABLE 8.3. The Proton NMR Peak Assignments of Ether LPA and Ether Cyclic LPA with 18:1 and 16:0 Alkyl Chain Ether LPA (18:1) Glycerol
Alkanyl chain
–1CH2–OCH2–
3.46(m)
–2CH–O– –3CH2–OP–
3.85(m) 3.96(m)
–CH2OCH2CH2 –R –CH2OCH2CH2–R CH2– –CH3
3.46(m) 1.56(m) 1.29(m) 0.88(t, 6.9)
–CH=CH–CH2– –CH=CH–CH2–
2.02(m) 5.35(m)
Ether cLPA (18:1)
Ether LPA (16:0)
Ether cLPA (16:0)
3.51(m), 3.62(m) 4.50(m) 4.22(m), 3.94(m) 3.46(m) 1.56(m) 1.29(m) 0.88 (t, 6.9) 2.02(m) 5.35(m)
3.46(m)
3.51(m), 3.62(m) 4.50(m) 4.22(m), 3.94(m) 3.46(m) 1.55(m) 1.27(m) 0.88 (t, 7.0)
3.85(m) 3.96(m) 3.46(m 1.55(m) 1.27(m) 0.88 (t, 7.0)
TABLE 8.4. Phosphorus-31 NMR Chemical Shifts (ppm) of Representative LPA, Cyclic LPA, and Their Ether Analogs LPA (18:1) 3.26 3.14(minor)a
cLPA (18:1)
LPA (16:0)
cLPA (16:0)
18.31
4.10 4.01(minor)a
18.48
Ether LPA Ether cLPA (18:1) (18:1) 3.05
18.70
a
Minor peaks were from a small amount of 2-LPA caused by acyl chain migration.
A representative MRM chromatogram of the UPLC/MS/MS method is provided in Figure 8.3. Table 8.5 summarizes the reversed-phase chromatographic retention time, MRMs, mass spectrometry settings, and calibration curve results for each LPA standard and internal standard. Optimized CXP settings are not provided but ranged from −5 to −11. The UPLC/MS/MS platform described herein has the potential for fast and accurate analysis of LPA compounds of varying molecular structures in biological samples. While each LPA-type fragments to different quantifiable ions, internal standards of similar chemistry are available for normalization of mass spectrometry detection. Biological samples potentially contain many more LPA compounds than those studied here. It is not feasible to provide a reference material for all to be
146
STANDARDIZATION AND QUANTIFICATION OF LPA COMPOUNDS
Figure 8.3. UPLC/MS/MS chromatogram of 0.3 pmol of each LPA and 0.1 pmol of each internal standard as numbered in Table 8.5. Smaller unlabeled peaks preceding LPA esters are sn-2 positional isomers.
directly assayed from a calibration curve. However, by adding the internal standard(s) to the pre-extracted sample, additional LPA compounds can be measured using a chemically similar calibration curve after verification of extraction recovery. Molecular weights of these LPA compounds range from 269.1 to 457.2 Da for 6:0 LPA to 20:4 LPA. The LPA–esters produce a predominant 153-Da fragment. The 153-Da fragment is common to all glycerophospholipids when assayed in negative ionization mode. Molecular weights of other compounds begin at 424.2 Da for the smallest lysophospholipid compound, 14:0 lysophosphatidylethanolamine (LPE). This 153-Da fragment for LPEs in negative mode however is only in modest abundance generated by higher CEs than the optimized −30 ± 2 setting reported here. Any possible isobaric mass problem with LPEs can be overcome by assaying in positive ionization mode where 153 Da is not produced. The predominant fragment for cLPA esters and cLPA ethers is 79 Da, also problematic as a common negative mode phospholipid fragment. More so as high CEs used in the reported experiments are needed to produce ion abundances necessary for sensitive detection. The major fragments of the cLPA esters correspond to the [M − H]− m/z of their respective acyl chains. The reversed-phase separation of these compounds produce separation according to carbon : double bond
147
Compound
6:0 LPA 13:0 LPA 14:0 LPA 20:4 LPA 17:1 LPA 16:0 LPA 16:0 cLPA 18:1 LPA 18:1 cLPA 17:0 LPA 17:0 cLPA C18:1 LPA C16 cLPA C18:1 cLPA 18:0 LPA C18 LPA
Peak #
1 2 3 4 5 6 7 8 9 10 11 12 13 14 15 16
0.19 0.78 1.13 1.68 1.77 1.94 2.04 2.09 2.18 2.23 2.32 2.36 2.36 2.46 2.47 2.70
Rt (Minutes) 269.1 367.1 381.1 457.2 421.2 409.1 391.1 435.2 417.1 423.2 405.1 421.1 377.1 403.1 437.1 423.1
Q1 (m/z) 153.0 153.0 153.0 153.0 153.0 153.0 255.2 153.0 281.2 153.0 269.2 79.0 79.0 79.0 153.0 79.0
Q2 (m/z)
CE −28 −28 −28 −30 −30 −30 −30 −30 −30 −30 −32 −90 −92 −92 −32 −90
DP −90 −100 −90 −85 −100 −110 −115 −115 −140 −100 −100 −100 −100 −100 −140 −100 LPA LPA LPA LPA LPA
LPA cLPA LPA cLPA
LPA LPA
LPA
ISTD 13:0 – 13:0 17:1 – 17:0 17:0 17:1 17:0 – – 17:1 17:0 17:1 17:0 17:0
TABLE 8.5. Summary of UPLC/MS/MS Conditions and Performance for LPA Compounds
0.36 – 1.09 0.90 – 0.78 1.09 1.50 1.08 – – 1.79 0.86 0.33 0.74 0.57
Slope
−0.01 – −0.05 −0.01 – 0.06 −0.01 −0.06 0.02 – – −0.20 0.10 0.00 0.10 0.06
y-Intercept
0.999 – 0.999 0.999 – 0.999 0.999 0.999 0.999 – – 0.999 0.998 0.998 0.999 0.999
R
148
STANDARDIZATION AND QUANTIFICATION OF LPA COMPOUNDS
(CC : DB) interaction with the C-18 stationary phase, with elution of unsaturated LPAs before their more saturated counterparts of the same carbon number. The complete resolution of CC : DB series removes the necessity of isotope correction for M + 2 isotopes required for normal-phase and flow infusion mass spectrometry quantitative methods. The chromatographic peaks of LPA esters were completely resolved into sn-1 and sn-2 positional isomers as demonstrated in the 31P NMR experiments (Table 8.4). It is of notable interest that isobaric compounds of 17:1 LPA/C18:1 LPA at 421.2 Da and 17:0 LPA/C18 LPA at 423.1 Da are completely resolved by not less than 3 peak widths. This demonstrates a possible solution to the reported problem of coelution of odd chain internal standards with ether–lysophospholipids in the case of LPAs (6). The combination of lower molecular weights for negative mode Q1 ions of LPAs, the scheduled MRM detection technique and chromatographic resolution of molecular species provide selectivity. The described method provides a fast and selective analysis conducive to large numbers of samples with a linear dynamic range of 5–0.02 pmol for each LPA. The signal to noise for 0.02 pmol of each LPA was not less than 12:1. Sensitivity of not less than 9 pg injected on a column was obtained for all of the LPA compounds. Table 8.6 summarizes the normal-phase chromatographic retention times for several common LPA species. The LPA retention times are dependent on carbon number and degree of unsaturation. Using this method, higher carbon number species elute first. cLPA lipids analyzed using this method normally elute between 5 and 6 minutes (Fig. 8.4) and yield MS/MS spectra similar to that of LPA compounds (Fig. 8.5). As mentioned before, great care should be taken to avoid acidic conditions whenever possible when handling cLPA compounds due to potential ring opening. When analyzing either LPA or cLPA lipids, the retention time of an authentic standard should always be determined when using an ion trap of this type. A small amount of CE is required for this instrument, which can lead to the formation of LPA and dehydrated LPA fragments from any glycerophospholipid. LC/MS/MS analysis of these species scanning for the expected daughter ions (Table 8.7) is
TABLE 8.6. Representative Retention Times (Minutes) for Several Common LPA Lipids and Standards in Normal-Phase LC/MS LPA
RT
13:0 16:0 17:1 18:1 18:0 20:4
19.2 17.4 17.4 16.6 16.3 16.6
Discussion
149
5.30
2.5e7 2.2e7
Intensity (cps)
1.8e7 1.4e7 1.0e7 6.0e6 2.0e6 0.0
2
6
10
14
18
22 26 30 Time (minutes)
34
38
42
46
50
Figure 8.4. LC/MS extracted ion chromatogram for 16:0 cyclic LPA.
255.12 O
2.5e7
O
O H
2.0e7
O
P
O
O
391.20
Intensity (cps)
O O
1.5e7 O
O
1.0e7
P HO P
5.0e6
O
O
O
OH O
OH
153.04 97.04 50
100
150
200
250
300
350
400
m/z (amu)
Figure 8.5. MS/MS fragmentation pattern for 16:0 cyclic LPA. In addition to the deprotonated parent ion, daughter ions attributable to fatty acids, dehydrated glycerophosphate, and phosphate are routinely observed.
150
STANDARDIZATION AND QUANTIFICATION OF LPA COMPOUNDS
TABLE 8.7. Expected MS/MS Daughter Ions (in amu) of LPA Molecular Species
12:0 13:0 14:0 15:0 16:1 16:0 17:0 18:2 18:1 18:0 19:0 20:5 20:4 20:3
79 m/z
97 m/z
153 m/z
171 m/z
Fatty Acid
M − H
√ √ √ √ √ √ √ √ √ √ √ √ √ √
√ √ √ √ √ √ √ √ √ √ √ √ √ √
√ √ √ √ √ √ √ √ √ √ √ √ √ √
√ √ √ √ √ √ √ √ √ √ √ √ √ √
199 213 227 241 253 255 269 279 281 283 297 301 303 305
353 367 381 395 407 409 423 433 435 437 451 455 457 459
152.96
9.0e6
O
O P O
OH O
O
Intensity (cps)
7.0e6
O O
P
O HO
H
OH
O
O
5.0e6
O–
227.12 3.0e6
O
HO
O
P
O
P O
HO
OH
50
O P O
O
1.0e6
OH O
381.20
170.96
78.88 96.88 100
OH
150
200
363.04 250
300
350
400
m/z (amu)
Figure 8.6. MS/MS fragmentation pattern of 14:0 LPA. Typical daughter ions include the dehydrated parent ion, fatty acid, glycerol phosphate, dehydrated glycerol phosphate, phosphate, and phosphenate fragments.
References
151
highly recommended. A representative MS/MS scan of 14:0 LPA is shown in Figure 8.6, which contains all of the major peaks routinely observed during LPA fragmentation. The proper characterization, preparation, handling, storage, and use of LPA reference materials provides the means to quantify LPA compounds by either normal-phase or reversed-phase chromatography mass spectrometry methods. Both provide selective, concentration-dependent responses in picomole sensitivities. Either would be suitable for measurement of LPAs from biological extracts upon optimization of extraction techniques for recovery and response calibration using appropriate internal standard compounds. ACKNOWLEDGMENTS This work was supported in part by a large-scale consortium LIPID MAPS grant from the National Institutes of Health U54 GM069338. REFERENCES 1. Ivanova PT, Milne SB, Byrne MO, Xiang Y, Brown HA. 2007. Glycerophospholipid identification and quantitation by electrospray ionization mass spectrometry. Methods Enzymol 432:21–57. 2. Ivanova PT, Milne SB, Myers DS, Brown HA. 2009. Lipidomics: a mass spectrometry based systems level analysis of cellular lipids. Curr Opin Chem Biol 13:526–531. 3. Myers DS, Ivanova PT, Milne SB, Brown HA. 2011. Quantitative analysis of glycerophospholipids by LC-MS: acquisition, data handling, and interpretation. Biochim Biophys Acta 1811:748–757. 4. Lanier KL, Moore JD, Smith D, Li S, Davis B, Shaw WA. 2008. Quantitative phospholipid analysis of soy lecithin and krill lecithin by 31P NMR. http://www.avantilipids.com/images/Analytical/AvantiPhospholipidAnalysisAnalyticalServices.pdf 5. Friedman P, Haimovitz R, Markman O, Roberts MF, Shinizky M. 1996. Conversion of lysophospholipids to cyclic lysophosphatic acid by phospholipase D. J Biol Chem 271:953–957. 6. Bollinger JG, Hiromi I, Sadilek M, Gelb H. 2010. Improved method for the quantitation of lysophospholipids including enol ether species by liquid chromatographytandem mass spectrometry. J Lipid Res 51:440–447.