International Journal of Sports Physiology and Performance, 2015, 10, 921 -926 http://dx.doi.org/10.1123/ijspp.2014-0537 © 2015 Human Kinetics, Inc.
ORIGINAL INVESTIGATION
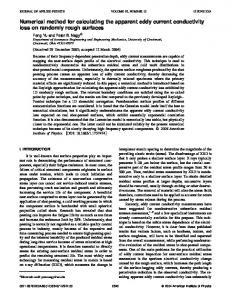
Standardization of the Dmax Method for Calculating the Second Lactate Threshold Samuel Chalmers, Adrian Esterman, Roger Eston, and Kevin Norton Purpose: The purpose of this study was to test the reliability and validity of 2 standardized methods for calculating speed at the second lactate-threshold point (LT2) based on the preexisting Dmax (LTD) and modified Dmax (LTMOD) procedures. Methods: 13 trained male road runners and triathletes completed 2 incremental laboratory running tests to determine LT2, followed by separate time trials (5, 10, 15 km) on an outdoor running track. Two new methods were proposed for calculating the speed at LT2: (1) the single standardized lactate threshold (LTSDs) and (2) the paired standardized lactate threshold (LTSDp) for quantifying changes over time. Results: The LTSDs and LTSDp methods had high relative (ICC ≥ .98) and absolute (CV ≤ 1.9%) reliability in identifying the speed at LT2. The speed at LT2 according to the LTSDs and LTSDp methods had a strong correlation and was not different to the performance speed during the 10- and 15-km time trials (≤2.3%; ρc > 0.8; P > .05). The following natural logbased formula was created to estimate the percentage of LT2 speed (using the LTSDs method) that could be sustained for events ~15–75 min: y = –7.256(ln x) + 157.64, where y = %LT2 speed, x = time-trial performance (s), and ln = natural log. Conclusions: The standardized methods are reliable for determining LT2. The LTSDs and LTSDp methods for calculating the speed at LT2 from a near-maximal incremental test calculated speeds similar to those exhibited in 10- and 15-km running time trials. A prediction equation for estimating the percentage of LT2 that can be sustained for events of ~15–75 min was generated. Keywords: time trial, anaerobic threshold, prediction, running, blood lactate The velocity–blood lactate (BLa) curve may be characterized by the location of a first and second threshold (LT2), as defined previously.1 Cheng et al2 proposed the Dmax method (LTD) to calculate LT2. The LT2 is defined as the maximum perpendicular distance from the straight line between the first and final BLa concentrations during an incremental exercise test to the third-order polynomial curve that represents the BLa kinetics during exercise.2 This point represents the changing trend of the BLa response to exercise.2 However, the LTD method is prone to variability due to the marker’s dependence on the location of the first and last data points from the incremental exercise–BLa curve.3 To remove the influence of the location of the initial data point, Bishop et al4 proposed the modified LTD (LTMOD) method. The LTMOD defines LT2 according to the LTD method, but the straight line is created between the point preceding the first 0.4-mmol/L rise in BLa concentration and the final BLa reading.4 The primary limitations of the preexisting LTD and LTMOD methods are as follows. First, they can be susceptible to “artificial” changes in LT2 that are caused by changes in the BLa-profile response to exercise over time, primarily at the influential initial and final stages of an exhaustive exercise test. Second, the cessation of the incremental exercise test is dependent on the participants achieving an open-ended volitional-fatigue rating.5–7 For example, Figure 1 demonstrates the change in BLa response of a trained field team-sport athlete who completed 2 identical incremental exercise tests before and after an endurance-training intervention. The LTD (Figure 1[A]) and LTMOD (Figure 1[B]) methods indicated that Chalmers, Eston, and Norton are with the Alliance for Research in Exercise, Nutrition, and Activity, and Esterman, the School of Nursing and Midwifery, University of South Australia, Adelaide, Australia. Address author correspondence to Samuel Chalmers at
[email protected].
the speed at LT2 decreased even though there was a reduced BLa response to exercise at every workload, suggesting that the athlete experienced an improvement in aerobic performance. This example demonstrates the potential influence of 2 dissimilar final BLa values for the calculation of LT2. Running economy, maximal oxygen uptake (V˙ O2max), and fractional utilization of V˙ O2max are key determinants of endurance performance.8 The speed at lactate threshold integrates all 3 of these variables,8 so the location of LT2 according to both LTD4,9,10 and LTMOD4 is highly correlated with endurance performance. However, no 1 measure of LT2 is suitable for predicting individual performance during all endurance events. The LTD has been used to indicate the velocity/power that can be maintained during endurance time trials of ~60 minutes.1,4 The LTMOD appears to represent a performance power that can be sustained during endurance events of shorter duration (≤30 min).11 To our knowledge, no studies have provided a formula based on the LTD/ LTMOD to predict endurance time-trial performance over a range of durations, rather than an isolated fixed duration. The current study investigates performance prediction across a range of endurance distances. In this study, we proposed 2 new standardized procedures based on the LTD2 and LTMOD4 methods for determining LT2 from a near-maximal-intensity incremental exercise test: a single standardized LT2 (LTSDs) and the paired standardized LT2 (LTSDp). The primary aim of the current study was to determine the reliability, and performance validity of the LTSDs and LTSDp methods for calculating the running speed at LT2. The secondary aim was to examine the relationship between the speed at LTSDs and LTSDp and performance in 3 running time trials of different duration. We hypothesized that the LTSDs and LTSDp methods would be reliable (ICC ≥ .9) and have a correlation of ρc ≥ .7 with 3 time-trial distances (5, 10, and 15 km). 921
922
Chalmers et al
Methods
Figure 1 — The blood lactate concentration (BLa) response to an incremental exercise test of a team-sport athlete before and after a brief endurance-training intervention. Each panel illustrates the calculated preintervention and postintervention LT2 values using different methodological approaches to the same participant data. Panel A shows the LT2 values based on the LTD methodology where all data points have been included. Panel B used the LTMOD procedure that required the identification of the point preceding the first BLa rise of ≥0.4 mmol/L higher than the previous work rate for the first point of analysis. Panel C is based on the LTSDp procedure where up to 2 stages before the first 0.4-mmol/L rise are used to establish the initial point of analysis, and the final BLa levels for prepost test comparisons must be within ≤1 mmol/L. It is clear that panels A and B show LT2 values decreasing after the intervention, whereas Panel C shows an increase in LT2.
Fourteen trained male triathletes and road runners volunteered for the study (age 37.2 ± 8.5 y, height 1.82 ± 0.06 m, mass 78.35 ± 8.77 kg, body-mass index 23.7 ± 2.12 kg/m2). Thirteen participants completed the laboratory testing sessions, and 12 participants finished the field time-trial sessions. Two runners withdrew from the study due to illness or personal reasons. Participants reported regular training sessions (≥3 aerobic-based endurance sessions per week) and competition in local aerobic-endurance events. They were instructed to continue their routine training commitments. The University of South Australia human ethics committee approved the study protocols, and all participants provided written informed consent. An a priori 2-sided sample-size calculation demonstrated that 11 participants were required to achieve 80% power at the α = .05 level. During the first 9 days each participant completed 2 exhaustive incremental exercise tests under the same environmental conditions (18°C and 50% relative humidity). The laboratory environmental conditions were chosen to reflect mean outdoor environmental conditions. This was followed by 3 field-based time trials on an outdoor gravel running track within 15 days. Laboratory sessions were separated by at least 24 hours, and time-trial sessions were separated by at least 48 hours. Participants completed their laboratory sessions at the same time of day and each time-trial session at the same time of day to control for any diurnal variation in performance. Body mass was measured using electronic scales (±0.05 g, FV150KA1, A&D Co Ltd, Japan), and height was measured using the stretch-stature technique (SECA stadiometer, Germany).12 An incremental running test was used to determine the speed (km/h) at LT2, which involved participants completing 240-second incremental running stages on a calibrated treadmill (TMX425CP, Trackmaster, Full Vision Inc, Newton, KS, USA). The treadmill was set with no incline for the test. The aim of the initial running speed was to elicit a rating of perceived exertion (RPE) of 11 (“light”) on the Borg 6 to 20 RPE scale.13 After 210 seconds of running, participants straddled the treadmill for 30 seconds while a fingertip BLa sample and RPE were collected. The finger of each participant was cleaned and dried before a lancet device was used to obtain a fingertip sample of blood by a trained researcher. The Lactate Pro analyzer (Arkray, Kyoto, Japan) required a 5-μL sample to determine BLa concentration. The same researcher obtained the blood sample for every participant. Bentley et al14 concluded that 180-second workloads provide the most reliable and valid measure of endurance performance. Hence, prescribing 210-second workloads allowed participants to maintain at least 180 seconds of exercise if there were any unexpected delays in obtaining the range of variables during the straddle period. The conditions of finishing the test were participants reporting an RPE of ≥18 and providing feedback that they could not complete another workload due to exhaustion. Participants were instructed that they could freely stop running if they reached exhaustion during a workload. The incremental test only ceased at an exhaustive effort for the analytical purposes of further data modeling. The future application of the LTSDs and LTSDp methods does not necessitate an exhaustive effort. Data were not analyzed for incomplete workloads. Participants completed the second incremental test using the same workload increments as the first incremental test. Exercising heart rate was monitored continuously using 10-second-interval recordings on an RS400 Polar Monitor (Polar Electro Oy, Kempele, Finland). Gas exchange was measured using online respiratory-gas analysis via a breath-by-breath automatic gas-exchange system (Cortex Matalyzer 3B, Biophysik GmbH, Leipzig, Germany).
IJSPP Vol. 10, No. 7, 2015
Standardization of the Dmax Method
Blood lactate concentration (mmol/L) during the incremental test was plotted against running speed (km/h), and a third-order polynomial curve was constructed in a custom software program to determine LT2 according to the LTSDs and LTSDp methods. A straight line was established between 2 points on the curve, and the LT2 was determined as the point on the polynomial curve forming the greatest perpendicular distance to the generated straight line (Figure 1 and 2). Participants completed 5-, 10-, and 15-km outdoor running time trials in a randomized order on separate occasions. The distance
923
of the gravel track was 1 km, with the participants required to complete a 180° turn at the end of each lap. The running track was measured by use of a calibrated handheld trundle wheel (Invicta Plastics Limited, Leicester, England) and had no overall elevation gain. The ambient temperature, relative humidity, and wind speed at the beginning of each participant trial averaged 16.7°C ± 4.7°C (range 9.3–26.2°C), 59.8% ± 22.6% (range 27.0–97.0%), and 11.3 ± 4.2 km/h (range 0.0–16.7 km/h).15 The participants were instructed to complete the trials as fast as possible and encouraged to mimic competitive events; thus, the use of handheld pace-monitoring
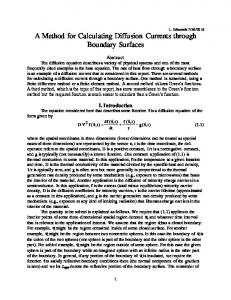
Figure 2 — The procedure for operating and analyzing an incremental exercise test for the determination of LT2 in accordance with the LTSDs and LTSDp methods. Abbreviations: BLa, blood lactate; LTSDp, paired standardized lactate threshold; LTSDs, single standardized lactate threshold; RPE, rating of perceived exertion. IJSPP Vol. 10, No. 7, 2015
924
Chalmers et al
devices was permitted and water consumption was ad libitum. Time was measured using a handheld stopwatch at each 1-km interval. The participants individually completed the time trials. Mean and standard deviation (SD) were calculated for all performance and physiological variables collected during the laboratory and field sessions. Relative reliability was calculated using intraclass correlation coefficients (ICC) and 95% confidence intervals (CI) (90% CIs for typical error [TE]) through an absolute agreement 2-way mixed model). Typical error was determined using the spreadsheet of Hopkins,16 expressed as a coefficient of variation (CV, %).16 The smallest worthwhile change (SWC) was determined by multiplying the between-subjects SD by 0.2 for each round of laboratory testing.17 Test sensitivity was calculated by dividing the mean SWC from the 2 laboratory tests by the TE of each respective method. The Lin concordance correlation coefficient (ρc) was used to compare time-trial performance and LT2 results. The prediction of time-trial results was calculated by assuming that each participant completed each trial distance at a mean speed equating to the laboratory-tested LT2 speed. The percentage prediction error for each LT2 method in relation to time-trial performance was calculated by dividing the mean prediction error (s) by the mean trial completion time (s). A positive (+) and negative (–) prediction indicated a faster and slower time, respectively, than the actual performance time. One-way repeated-measures ANOVA assessed the laboratory-based predicted (based on the mean prediction from 2 tests) and actual time-trial completion time. Post hoc analysis using paired t tests with a Holm-Bonferroni adjustment was used to protect against type I error.18 A Shapiro-Wilk test confirmed that data were normally distributed before the application of ANOVAs. The GreenhouseGeisser correction factor was applied where sphericity assumptions were violated to reduce the risk of type I error. The formula for estimating the speed at LT2 for time trials was created by a natural log-function line of best fit between time-trial times for all distances versus the mean percentage of LT2 speed according to the LTSDs method. Statistical significance was set at P < .05 for the analyses that did not require a Holm-Bonferroni adjustment. Microsoft Excel 2010 and IBM SPSS statistics 19 were used to analyze data.
Results The primary aim of the study was to assess the reliability of the LTSDs and LTSDp methods for calculating the speed at LT2. Table 1 demonstrates the ICC, TE, and CV for the 2 methods. In relation to the LT calculation methods (ie, LTMOD) that require the identification of an initial 0.4-mmol/L rise in BLa, the associated workload occurred at a different stage between the laboratory test–retests in 7 participants.
The comparison of laboratory and field-testing was completed on the 12 participants who finished all testing sessions. The mean running speed and completion time during the 5-, 10-, and 15-km time trials were 14.8 ± 1.5 km/h and 1223.9 ± 108.3 seconds, 14.1 ± 1.6 km/h and 2581.8 ± 267.4 seconds, and 13.7 ± 1.3 km/h and 3971.3 ± 355.9 seconds, respectively. The mean prediction errors of the LTSDs method for the 5-, 10-, and 15-km events were –5.6% (P = .005 actual time; ρc = 0.681 [0.41–0.95]), –0.1% (P = .929 actual time; ρc = 0.852 [0.69–1.02]), and +2.3% (P = .096 actual time; ρc = 0.845 [0.67–1.02]), respectively. The mean prediction errors of the LTSDp method for the 5-, 10-, and 15-km events were –6.3% (P = .003 actual time; ρc = 0.646 [0.36–0.93]), –0.8% (P = .612 actual time; ρc = 0.846 [0.67–1.02]), and +1.7% (P = .235 actual time; ρc = 0.850 [0.68–1.02]), respectively. A natural logbased formula was created to estimate the percentage of LT2 speed (using the LTSDs method) that could be sustained for events ~15 to 75 minutes: y = –7.256 (ln x) + 157.64, where y = %LT2 speed, x = time-trial performance [s], and ln = natural log.
Discussion The primary aim of the study was to determine the reliability and validity of the LTSDs and LTSDp methods for determining LT2 from a near-maximal incremental exercise test. The LTSDs method was designed for single tests, whereas the LTSDp is appropriate for quantifying changes in LT2 over time. The LTSDs and LTSDp methods were demonstrated to have a high relative (ICC ≥ .98) and absolute (CV of ≤1.9%) reliability in identifying the speed at LT2. These results compare favorably to Zhou and Weston19 (ICC .90) and Morton et al20 (CV 3.8%, ICC .90) for determining V˙ O2 and power output, respectively, at LTD after exhaustive incremental exercise. The current study demonstrates that LT2 can be reliably determined during a near-maximal incremental test that contains a standardized endpoint of a BLa concentration of ≥8 mmol/L or RPE of 18. The starting analysis points of the LTSDs and LTSDp methods were standardized to ≤2 workloads before the first 0.4-mmol/L rise in BLa concentration, removing the influence of excessive lowintensity workloads on the determination of LT2. A large number of low-intensity workloads will “artificially” shift LT2 to the left (lower value). This was the basis for the development of the LTMOD method.4 However, the LTMOD method can be prone to artificial changes to LT2 if the initial 0.4-mmol/L rise in BLa does not occur at the same stage in 2 paired tests, as was the case for 7 participants in the current study. Therefore, to address the limitation of an artificial change due to the location of the initial points of analysis in paired tests and improve the reliability of quantifying change over time, the initial point of analysis for the LTSDp method is standardized to the same workload between tests.
Table 1 The Reliability of Measuring Speed at LT2 (N = 13) LT2 Speed (km/h), Mean ±SD LT2 marker
ICC (95%CI)
TE (km/h) (90%CI)
CV (%) (90%CI)
14.12 ± 1.41
.98 (.94–.99)
0.27 (0.20–0.41)
14.07 ± 1.38
.99 (.96–1.00)
0.22 (0.16–0.33)
Test 1
Test 2
LTSDs
14.10 ± 1.28
LTSDp
14.01 ± 1.28
SWC (km/h) Test 1
Test 2
Combined
Sensitivity
1.9 (1.4–2.9)
0.26
0.28
0.26
0.97
1.6 (1.2–2.4)
0.26
0.28
0.26
1.21
Abbreviations: LT2, second lactate threshold; SWC, smallest worthwhile change; ICC, intraclass correlation coefficient; CI, confidence interval; TE, typical error; CV, coefficient of variation; LTSDp, paired standardized lactate threshold; LTSDs, single standardized lactate threshold. IJSPP Vol. 10, No. 7, 2015
Standardization of the Dmax Method
The final analysis point is standardized to either a near-maximal-effort rating (≥RPE 18) or BLa concentration (≥8 mmol/L) for the LTSDs and LTSDp methods. This enabled a clearly defined consistent endpoint while avoiding a theoretical maximal-intensity effort. However, an effort of RPE ≥18 is admittedly near maximal. The presence of a defined endpoint according to a BLa concentration or RPE provides reliable guidelines for practitioners without gas-analysis data to inform the cessation of an incremental test. The final point of analysis in paired tests (LTSDp) must be comparable within ≤1 mmol/L of BLa, avoiding an artificial change in LT2 due to dissimilar final BLa values (Figure 1). A change in dietary intake may modify the BLa response to exercise; however, this might not affect the identification of an individually based LT2 calculation (ie, LTSDs/LTSDp) but rather affect lactate-threshold analysis based on a fixed BLa concentration (eg, the 4-mmol/L method).1,21 Strong correlations (r > .7) have been previously observed between LTD or LTMOD and extended cycling endurance time trials.4,9,11 Indeed, this is similar for other markers of the lactate threshold, which further supports the use of the threshold as a strong indicator of aerobic-based competition performance.14,22 Faude et al22 and Bentley et al14 provide comprehensive reviews of the relation between a range of lactate-threshold markers and endurance performance. A limited number of studies have examined the relationship between the LTD and endurance performance in runners.10 The current study observed similar results for the LTSDs and LTSDp methods (ρc ≥ 0.8 for 10- and 15-km trials). These results support the use of the LTSDs and LTSDp methods as a means of ranking the aerobic-endurance potential of athletes. Correlations by themselves can be misleading,23 and the absolute differences or error of velocity prediction is more important. In comparison with laboratory testing, the outdoor time-trial track was selected because it represents the competition environment (ecological validity). In the current study, the mean LTSDs and LTSDp prediction times were remarkably similar (P > .05; ρc ≥ 0.8) to the mean overground completion time in the 10-km (LTSDs –0.1%; LTSDp –0.8%) and 15-km (LTSDs +2.3%; LTSDp +1.7%) events. Hence, these results provide support for the notion that the speed at LT2 according to the LTSDs and LTSDp methods is similar to race pace during endurance events of ~30 to 75 minutes. The LTMOD method tends to be a more aggressive estimate of LT2 (estimates LT2 at a higher fraction of V˙ O2max) and predicts a performance speed that can be sustained for ~