International Journal of Computer Theory and Engineering, Vol.3, No.1, February, 2011 1793-8201
Statistical Normalization and Back Propagation for Classification T.Jayalakshmi, Dr.A.Santhakumaran
Abstract— The artificial neural network has recently been applied in many areas of medical and medically related fields. It is known as an excellent classifier of nonlinear input and output numerical data. Some major issues are to be considered before using the neural network models, such as the network structure, learning rate parameter, and normalization methods for the input vectors. The proposed research showed various normalization methods used in back propagation neural networks to enhance the reliability of the trained network. The experimental results showed that the performance of the diabetes data classification model using the neural networks was dependent on the normalization methods. Index Terms—Artificial Neural Networks; Back Propagation; Diabetes Mellitus; Normalization.
I. INTRODUCTION Machine learning techniques suiting computer-aided medical diagnosis should have good comprehensibility. It has the transparency of diagnostic knowledge and the explanation ability. Machine learning methods for classification provide inexpensive means to perform diagnosis, prognosis, or detection of certain outcomes in health care research. It includes neural network models as one of the attractive approaches for diagnostic tasks. Increased number of clinical databases, increases manual processing which increases the cost. Most of the medical data sets are non-linear patterns and difficult to classify. Therefore, there is a need to enhance the classification by means of machine learning methods. Artificial neural networks seemed to be one of the best approaches in machine learning methods. ANNs are software constructs designed to mimic the way the human brain learns. The neural network can imitate the process of human’s behavior and solve nonlinear matters, which has made it widely used in calculating and predicting complicated system, and achieved a non linearity mapped effect, which the conventional calculating way could not do. The nerve cell, which is the base of neural network, has the function of processing information [19]. Neural networks extensively used in medical applications such as image/signal processing [17], pattern and statistical classifiers [14] and for
Manuscript received December 20, 2009. T.Jayalakshmi is with the CMS College of Science and Commerce, Coimbatore, India (Phone: 9976268841; e-mail: jayas20@ rediffmail.com). A.Santhakumaran., is with Salem Sowdeswari College, Salem, India. (e-mail:
[email protected]).
modeling the dynamic nature of biological systems [13]. Some of the systems employing neural networks are developed for decision support purposes in diagnosis and patient management [13] [1]. The use of neural networks for diabetic classification has also attracted the interest of the medical informatics community because of their ability to model the nonlinear nature. Gradient based methods are one of the most widely used error minimization methods used to train back propagation networks. Back propagation algorithm is a classical domain dependent technique for supervised training. It works by measuring the output error calculating the gradient of this error, and adjusting the ANN weights and biases in the descending gradient direction. Back propagation is the most commonly used and the simplest feed forward algorithm used for classification. Diabetes is disease in which the body does not properly produce insulin. It is one of the most common chronic disease, which can lead to serious long term complications. Type I diabetes, the disease is caused by the failure of pancreas, to produce sufficient insulin, and type II the body is resistant to the insulin it makes, which leads to an uncontrolled increase of blood glucose unless the patient uses insulin or drug. The blood glucose level that is elevated for a long period can result in metabolic complications such as kidney failure, blindness, and an increased chance of heart attacks. To prevent or postpone such complications strict control over the diabetic blood glucose level is needed [7]. Number of computer-based system is available to diagnose the diabetes. The goal of this study is to propose various statistical normalization procedures to improve the classification accuracy. The experimental results showed that the performance of the diabetes classification model using the neural networks was dependent on the normalization methods. The best normalization method in the back propagation neural network model was suggested in this study. The data set prepared using normalization; enhance the learning capability of the network with minimum error. The Pima Indian Diabetes data set is taken for this study. This paper organized as follows: Section II briefs about the background study, Section III describes about Artificial neural networks, Section IV deals about diabetes mellitus, Section V gives the methodology of the proposed system, and Section VI concludes the paper.
II. BACKGROUND STUDY Siti Farhanah Bt Jaafar and Darmawati Mohd Ali [26] proposes a network with eight inputs and four inputs and the results obtained are compared in terms of error. The highest 89
International Journal of Computer Theory and Engineering, Vol.3, No.1, February, 2011 1793-8201
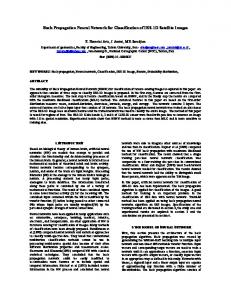
distributed processor made up of simple processing units, which has a natural propensity for storing experiential knowledge and making it available for use. It is very sophisticated modeling technique capable of modeling extremely complex functions. They consist of simple multiple processors called neurodes (units) and unidirectional communication channels called connections. These connections may be arranged to excite or inhibit and to propagate backward or forward between units. Units commonly arranged in layers, like biological counterparts. The units have input layers, intermediate or hidden layers and output layers. The response of a neural network to any set of inputs is determined not only by its network structure but also by the strength of its connections, which may be modified individually. These modifications are based on the difference between observed and expected output for a given set of inputs. The figure shows the architecture of feed forward neural network (Figure.1).
performance is obtained when the network consists of eight inputs with three hidden layers with 15, 14, 14, 1 neurons respectively. Amit Gupta and Monica Lam [2] investigate the generalization power of a modified back propagation training algorithm such as weight decay. The effect of the weight decay method with missing values can be applied for different data sets such as EPS data set, ECHO data set, IRIS data set etc. The missing values can be reconstructed using standard back propagation, iterative multiple regression, replace by average and replace by zero. The weight decay method achieves significant improvement over the standard back propagation method. Fulufhelo V.Nelwamondo, Shakir Mohamed and Tshilidzi Marwala [8] discuss the expectation maximization algorithm and the auto associative neural network and genetic algorithm combination. The results show that for some variables EM algorithm is able to produce better accuracy while for the other variables the neural network and GA system is better. The findings shows that the methods used are highly problem dependent. Colleen M.Ennett, Monique Frize, C.Robin Walker [4] investigates the impact of ANN performance when predicting neonatal mortality of increasing the number of cases with missing values in the data sets. They proposes three approaches such as delete all the values, Replace with mean, and Replace with normal to predict Canadian neonatal Intensive care unit network’s database. The experimental results were very promising. Junita Mohamad-saleh and Brain [ 12] proposes the Principle Component Analysis method for elimination of correlated information in data. It has been applied to the Electrical Capacitance Tomography data, which contains highly correlated due to overlapping sensing areas. It can boost the generalization capability of a MLP, the PCA technique also reduces the network training time due to the reduction in the input space dimensionality. The findings suggest that PCA data processing method useful for improving the performance of MLP systems, particularly in solving complex problems. Pasi Luukka [21] presented a new approach using a similarity based Yu’s norms for the detection of erythemato squamous diseases, diabetes, breast cancer, lung cancer and lymphography. The domain contains records of patients with known diagnosis. The results are very promising when using Yu’s norms for the diagnosis of patients taking into consideration the error rate. The use of this preprocessing method enhanced the result over 30%. Stavros J.Perantonis and Vassilis Virvilis [27] proposed a method for constructing salient features from a set of features that are given as input to a feed forward neural network used for supervised learning. The method exhibits some similarity to principle component analysis, but also takes into account supervised character of the learning task. It provides a significant increase in generalization ability with considerable reduction in the number of required input features.
Figure 1.
Multi Layer Feed Forward Network
Neural networks thus learn like biological counterparts. After repeated presentations of data, learned algorithms minimize the average error [23].
IV. DIABETES MELLITUS Diabetes mellitus is the most common endocrine disease. The disease is characterized by metabolic abnormalities and by long-term complications involving the eyes, kidneys, nerves, and blood vessels. The diagnosis of symptomatic diabetes is not difficult. When a patient presents with signs and symptoms attributable to an osmotic diuresis and is found to have hyperglycemia essentially all physicians agree that diabetes is present. The two major types of diabetes are Type I diabetes and Type II diabetes. Type I diabetes usually diagnosed in children and young adults, and was previously known as juvenile diabetes [22] [26]. Type I diabetes mellitus (IDDM) patients do not produce insulin due to the destruction of the beta cells of the pancreas. Therefore, therapy consists of the exogenous administration of insulin. Type II diabetes is the most common form of diabetes. Type II diabetes mellitus (NIDDM) patients do produce insulin endogenously but the effect and secretion of this insulin are reduced compared to healthy subjects [6]. Currently cure does not exist for the diabetes, then only option is to take care of the health of people affected, maintained their glucose levels in the blood to the nearest possible normal values [9].
III. FEED FORWARD NEURAL NETWORKS Neural networks are used to solve problems in which the complete formulation is unknown i.e. no casual model or mathematical representations exist. It is a massively parallel 90
International Journal of Computer Theory and Engineering, Vol.3, No.1, February, 2011 1793-8201
the stopping criterion. V. METHODOLOGY The system explains the statistical normalization procedures used in back propagation neural networks. The proposed research showed various normalization methods used to enhance the reliability of the trained network. Some techniques prove the real influence of these network. A. Data Set The problem that has been chosen for this research is to classify the Type II diabetic data using Levenberg Marquardt back propagation algorithm. To investigate the performance of the proposed neural-based method, the classifier was applied to PIMA INDIAN DIABETES dataset and has been collected from UCI machine learning repository [4]. The data set is a two-class problem either positive or negative for diabetes disease. The data set is different to classify because of the high noise level. It contains 768 data samples. Each sample consists of personal data and the results of medical examination. The individual attributes are • Number of times pregnant • Plasma glucose concentration • Diastolic blood pressure(mmHg) • Triceps skin fold thickness(mm) • 2-hour serum insulin(mu U/ms) • Body mass index(weight in kg/(height in m)) 2 • Diabetes pedigrees function • Age(years) The above dataset 268 patients are having diabetes, which can be interpreted as “1” and the remaining patients are not having diabetes and can be interpreted as “0”. The network topology used for this study is 8-8-8-1. i.e. one input layer, two hidden layers and one output layer with eight input nodes, eight hidden nodes and one output node. B. Network Architecture Back propagation algorithm is the most commonly used algorithm and it is the simple feed forward artificial neural networks. The algorithm adjusts network weights by error propagation from the output to the input. During the training the network minimizes the error by estimating the weights. The minimization procedure can be performed using the gradient-descent approaches, in which the set of weight vectors consisting of weights is adjusted by the learning parameters. The network parameters such as learning rate, momentum constant, training error and number of epochs can be considered as 0.9, 0.9, 1e-008 and 100 respectively. Before training the weights are initialized to random values. The reason to initialize weights with small values is to prevent saturation. To evaluate the performance of the network the entire sample was randomly divided into training and test sample. The model is tested using the standard rule of 80/20, where 80% of the samples are used for training and 20% is used for testing. In this classification method, training process is considered to be successful when the MSE reaches the value 1e-008. On the other hand the training process fails to converge when it reaches the maximum training time before reaching the desired MSE. The training time of an algorithm is defined as the number of epochs required to meet
C. Normalization Procedures Neural network training could be made more efficient by performing certain preprocessing steps on the network inputs and targets. Network input processing functions transforms inputs into better form for the network use. The normalization process for the raw inputs has great effect on preparing the data to be suitable for the training. Without this normalization, training the neural networks would have been very slow. There are many types of data normalization. It can be used to scale the data in the same range of values for each input feature in order to minimize bias within the neural network for one feature to another. Data normalization can also speed up training time by starting the training process for each feature within the same scale. It is especially useful for modeling application where the inputs are generally on widely different scales. Different techniques can use different rules such as max rule, min rule, sum rule, product rule and so on. Some of the techniques are discussed in this paper. 1) Statistical or Z-Score Normalization: This technique uses the mean and standard deviation for each feature across a set of training data to normalize each input feature vector. The mean and standard deviation are computed for each feature. The transformation is given in the equation
x' =
( xi − μ i ) σi
This produces data where each feature has a zero mean and a unit variance. Normalization technique is applied to all the feature vectors in the data set first; creating a new training set and then training is commenced. Once the means and standard deviations are computed for each feature over a set of training data, they must be retained and used as weights in the final system design. It is a preprocessing layer in the neural network structure. Otherwise, the performance of the neural network will vary significantly because it was trained on a different data representation than the un normalized data. The advantage of this statistical norm is that it reduces the effects of outliers in the data. 2) Min-Max Normalization: This method rescales the features or outputs from one range of values to a new range of values. More often, the features are rescaled to lie within a range of 0 to 1 or from -1 to 1. The rescaling is often accomplished by using a linear interpretation formula such as
x' = ( x max − x min ) ×
(x
i
− x min )
(x max − x min )
+ x min
where ( xmax − xmin ) = 0. when ( xmax − xmin ) = 0 for a feature, it indicates a constant value for that feature in the data. When a feature value is found in the data with a constant value, it should be removed because it does not provide any information to the neural network. When the min-max normalization is applied, each feature will lie within the new range of values will remain the same. Min-max normalization has the advantage of preserving exactly all relationships in the data. 3) Median Normalization: 91
International Journal of Computer Theory and Engineering, Vol.3, No.1, February, 2011 1793-8201
The median method normalizes each sample by the median of raw inputs for all the inputs in the sample. It is a useful normalization to use when there is a need to compute the ratio between two hybridized samples. Median is not influenced by the magnitude of extreme deviations. It can be more useful when performing the distribution.
xi median(ai )
e x − e−x e x + e −x
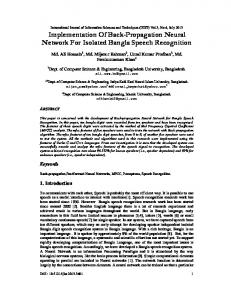
The comparison of various statistical normalization methods are shown in the figure (Figure.2). The figure shows the accuracy of statistical column normalization gives better results compared to other methods.
Mean and Standard Deviation normalization Another approach for scaling network inputs and targets is to normalize the mean and standard deviation of the training set. This function normalizes the inputs and targets so that they will have zero mean and unity standard deviation. The normalized inputs and targets are returned will have zero means and unity standard deviation. When this method is used to preprocess the training set data, then the trained network is used with new inputs, and the new inputs can be preprocess with the means and standard deviations that were computed for the training set using original data set. It can be calculated as
y ' = ( xi − x mean ) ×
Normalization Accuracy
Accuracy
74
Accura cy
72 70 68 66 64 62 Mea n a nd Sta nda rd Dev ia tio n
Sig mo id
Z-Sco re
60
Methods
y std + y mean x std
Figure 2.
5) Statistical Column Normalization: The statistical column normalization method normalizes each sample with a column normalization value. Calculate the normalization of each column by normalizing the columns to a length of one. Calculate each sample by dividing the normalized column attribute and multiplied by a small bias value.
x' =
NORMALIZATION ACCURACY
Media n
x' =
TABLE I.
Sta tistica l Co lumn
4) Sigmoid Normalization: The sigmoid normalization function is used to scale the samples in the range of 0 and 1 or -1 to +1. There are several types of non-linear sigmoid functions available. Out of that, tan sigmoid function is a good choice to speed up the normalization process. If the parameters to be estimated from noisy data the sigmoid normalization, method is used.
Min-Ma x
x' =
Comparison of Accuracy
VI. CONCLUSION This paper demonstrates the various statistical normalization techniques used in feed forward back propagation neural networks. It enhances the reliability of the trained network. The experimental results showed that the performance of the diabetes data classification model using the neural networks was dependent on the normalization methods.
xi − n(c a ) × 0 .1 n (c a )
D. Experimental results The system has been implemented to study the statistical normalization methods for improving the back propagation network. The simulations have been carried out using MATLAB. Various networks were developed and tested with random initial weights. The network is trained ten times and the performance goal is achieved at different epochs. The experimental results can be assessed by taking the average of ten runs and measured in terms of classification accuracy (Table.1). It shows that the accuracy was improved when statistical column normalization method is used.
REFERENCES [1] [2] [3]
[4] [5]
92
Ambrosiadou, V., Gogou, G., Pappas, C., and Maglaveras, N., Decision support for insulin regime prescription based on a neural network approach, Medical Informatics,1996, pp.23–34. Amit Gupts and Monica Lam (1998), The Weight Decay backpropagation for generalizations with missing values, Annals of Operations Research, Science publishers, pp.165-187. G. Arulampalam and A Bouzerdoum, Application of shunting Inhibitory Artificial Neural Networks to Medical Diagnosis, Seventh Australian and New Zealand Intelligent Information Systems Conference,18-21 November 2001, pp.89 – 94. Colleen M Ennett, Monique Frize, C.Robin Walker, Influence of Missing Values on Aritificial Neural Network Performance, Proceedings of Medinfo, 2001, pp.449-453. DeClaris, N., and Su, M. C., A neural network based approach to knowledge acquisition and expert systems, IEEE Systems Man and Cybernetics Proc. Pp.645–650, 1991.
International Journal of Computer Theory and Engineering, Vol.3, No.1, February, 2011 1793-8201 [6]
[7] [8] [9] [10]
[11] [12]
[13] [14]
[15]
[16] [17] [18] [19]
[20] [21] [22]
[23] [24]
[25]
[26]
Edgar Teufel1, Marco Kletting1, Werner G.Teich2, Hans-Jorg Pfleiderer1, and Cristina Tarin-Sauer3, Modelling the Glucose Metabolism with Backpropagation Through Time Trained Elman Nets, IEEE 13th Workshop on Neural Networks for Signal Processing, NNSP'03, 17-19 Sept. 2003, pp.789 - 798 Eng Khaled Eskaf, Prof.Dr.Osama ,Badawi , Prof.Dr.Tim Ritchings, Predicting blood Glucose Levels in Diabetics using feature Extraction and Artificial Neural Networks. Fuluf helo V Nelwamondo, Shakir Mohammed and Tshilidzi Mawala, Missing Data: A comparison of neural network and expectation maximization techniques, Current Science, Vol 93, No 11, 2007. Humberto M.Fonseca; Victor H.Ortiz, Agustin LCabrera., Stochastic Neural Networks Applied to Dynamic Glucose Model for Diabetic Patients, 1st ICEEE, 2004, pp.522 - 525 Igor Aizenberg, Claudio Moraga, Multilayer Feedforward Neural Network Based on Multi-Valued neurons (MLMVN) and a back propagation learning algorithm, Soft Computing, 20 April 2006, pp.169-183. Jain.A.K, J.Mao and K.M.Mohuddin (1996), Artificial Neural Networks: A Tutorial, IEEE Computer, Vol.29,No.3,PP.31-44. Junita Mohammad-saleh, Brain S.Hoyle, Improved Neural Network performance using Principle Component Analysis on Matlab, Int. journal of the computer, the internet and management, Vol.16, No 2, 2008, pp.1-8. Lakatos,G., Carson, E. R., and Benyo, Z., Artificial neural network approach to diabetic management, Proceedings of the Annual International Conference of the IEEE, EMBS, pp.1010–1011, 1992. Maglaveras, N., Stamkopoulos, T., Pappas, C., and Strintzis M., An adaptive back-propagation neural network for real-time ischemia episodes detection. Development and performance analysis using the European ST-T database, IEEE Trans. Biomed. Engng. pp.805–813, 1998. Md.Monirul Islam, Md.Shahjahan, and K.Murase, Exploring Constructive Algorithms with Stopping Criteria to Produce Accurate and Diverse Individual Neural Networks in an Ensemble, IEEE International Conference on Systems, Man, and Cybernetics, Vol. 3, 7-10 Oct. 2001 pp.1526 – 1531. Md.Shahjahan1,M.A.H.Akhand2, and K.Murase1, A Pruning Algorithm for Training Neural Network Ensembles, SICE 2003 Annual Conference ,Vol. 1, 2003, pp.628 – 633. Miller,A. S., Blott,B. H., and Hames, T. K., Review of neural network applications in medical imaging and signal processing, Med. Biol. Eng. Comput. 1992, pp.449–464. M.Nawi1, R.S. Ransing and M.R. Ransing, An Improved Conjugate Gradient Based learning Algorithm for Back Propagation Neural Networks, International journal of Computational Intelligence, 2008. Ping Zuo,Yingchun Li, Jie Ma SiLiang Ma, Analysis of Noninvasive Measurement of Human Blood Glucose with ANN-NIR Spectroscopy, International Conference on Neural Networks and Brain, ICNN&B '05. Volume 3, 13-15 Oct. 2005, pp. 1350 – 1353. P.K.Sharpe and R.J.Solly, Dealing with Missing Values in Neural Network based Diagnostic Systems, Neural Computing and Applications, Springer-Verlag London Ltd, 1995, pp.73-77. Pasi Luuka (2007), Similarity classifier using similarity measure derived form Yu’s norms in classification of medical data sets, Elsevier, Computer in Biology and Medicine, pp.1133-1140. Rajeeb Dey and Vaibhav Bajpai, Gagan Gandhi and Barnali Dey, Application of Artificial Neural Network (ANN) technique for Diagnosing Diabetes Mellitus, IEEE Region 10 Colloquium and the 3rd ICIIS, Dec 2008, PID 155. Richard B.North, J.Paul Mcnamee, Lee wu, and Steven Paintadosi, Artificial neural networks: Application to electrical stimulation of the human nervous system, IEEE 1996. Roelof K Brouwer PEng, PhD, An Integer Recurrent Artificial Neural Network for Classifying Feature Vectors, ESSANN, Proceedings – Eur. Symp on Artificial Neural Networks, April 1999, D-Facto public, pp. 307-312. S.G.Mougiakakou,K.Prountzou,K.S.Nikita , A Real Time Simulation Model of Glucose-Insulin Metabolism for Type 1 Diabetes Patients , 27th Annual Int. Conf. of the Engineering in Medicine and Biology Society, IEEE-EMBS 17-18 Jan. 2006 pp.298 - 301. Siti Farhanah, Bt Jafan and Darmawaty Mohd Ali, Diabetes Mellitus Forecast using Artificial Neural Networks , Asian Conference on sensors and the international conference on new techniques in pharamaceutical and medical research proceedings (IEEE), Sep 2005, pp. 135-138.
93
[27] Stavros J.Perantonis and Vassilis Virvilis (1999), Input Feature Extraction for Multilayered Perceptrons Using Supervised Principle Component Analysis, Neural processing letters, pp.243-252. [28] T.Waschulzik, W.Brauer, T.Castedello, B.Henery, Quality Assured Efficient Engineering of Feedforward Neural Networks with Supervised Learning (QUEEN) Evaluated with the pima Indian Diabetes Database, Proceedings of the IEEE-INNS-ENNS International Joint Conference on Neural Networks, IJCNN, Volume 4, 24-27 July 2000 pp.97 – 102. T.Jayalakshmi received her M.Sc computer science in 1993 from Barathidasan University, Trichy and M.Phil computer science in 1996 Bharathiar University, Coimbatore. She is currently working with Department of computer science, CMS College of Science and Commerce, Coimbatore. Her other research interests include Intelligent systems, Image processing, Network security and machine learning.
Santhakumaran is currently an Associate Professor & Head in the department of statistics, Salem Sowdeswari College, affiliated to Periyar University, Salem, and TamilNadu. He received his PhD in Mathematics-Statistics from the Ramanujam Institute for advanced study in Mathematics, University of Madras. His research interests statistical Quality Control and Stochastic Processes and their applications.