Attributing Meanings to Representations of Data: The Case of Statistical Process Control
Celia Hoyles, Arthur Bakker, Phillip Kent and Richard Noss London Knowledge Lab, Institute of Education, University of London Address:
23 – 29 Emerald Street London WC1N 3QS United Kingdom
Tel: +44 20 7763 2175 (or 2156) Fax: +44 20 7763 2138 Email:
[email protected]
Running head: Statistical Process Control
-1-
Attributing Meanings to Representations of Data: The Case of Statistical Process Control
This article is concerned with the meanings that employees in industry attribute to representations of data and the contingencies of these meanings upon context. Our primary concern is to characterise more precisely how the context of the industrial process is constitutive of the meaning of graphs of data derived from this process. We draw on data from a variety of sources including ethnographic studies of workplaces and reflections on the design of prototype learning activities supplemented by insights obtained from trying out these activities with a range of employees. The core of this article addresses how different groups of employees react to graphs used as part of statistical process control, focussing in particular on the meanings they ascribe to mean, variation, target, specification, trend and scale as depicted in the graphs. Using the notion of boundary crossing we try to characterise a method that helps employees to communicate about graphs and come to data-informed decisions.
PROCESS IMPROVEMENT IN INDUSTRY In workplaces today, mathematical skills must be effectively deployed in pursuit of goals crucial to business success in a globalised economy, such as dealing with constant change and innovation, remaining competitive, and improving work processes. A major finding of the report by Hoyles, Wolf, Molyneux-Hodgson and Kent (2002) on workplace mathematics was that basic numeracy was being displaced as the minimum mathematical competence required in a large and growing number of jobs by an ability to mobilise a much wider range of mathematical concepts through the use of the IT tools as part of working practice. One area where this is apparent is process improvement, a key practice in manufacturing industry, which employs systematic techniques to improve product quality and reduce production costs.
-2-
In one part of our current research project Techno-mathematical Literacies in the Workplace1, we have set out to characterise more precisely what is involved in effective deployment of mathematics in companies following routes of process improvement and particularly those using a technique called statistical process control (SPC). Process improvement programmes are increasingly driving business practice, a trend fuelled by global competition and the ubiquity of IT-based systems that are able to control processes and produce and store data. Process improvement was pioneered in the 1930s in the USA by Deming, widely adopted in Japan in the 1950s, and much more slowly adopted in Western countries (Deming, 1986; Ishikawa, 1990). A currently favoured methodology, Six Sigma (Pyzdek, 2001), is claimed to have delivered enormous profit gains to many companies, with its effectiveness generally attributed to the implementation of a combination of statistical techniques and systems for the management of organisational change (focused on carefully designed training programmes operating at different levels of expertise and need, from the shop-floor through to senior management). Despite their considerable success in some companies, process improvement programmes can be difficult to implement, because it appears that a key condition for their effectiveness is that employees through all levels of the organisation develop a good understanding of the work process in which they are involved (Lapré, Mukherjee, & Van Wassenhove, 2000). Guidelines have been developed as to how employees might gain this work-process understanding, by, for example, carrying out team-based projects in which managers, engineers and shop-floor operators work alongside each other to describe, measure and analyse how the different parts of the process “fit together”2. A major goal of such projects is
1
See the website: http://www.ioe.ac.uk/tlrp/technomaths
2
In Six Sigma, this technique is known as DMAIC: Define, Measure, Analyse, Implement, Control.
-3-
to agree variables that are key to improving performance, systematically to collect data on these variables and then to display these data on what is termed in statistical process control, as a control chart (also referred to as an SPC chart; an example, Figure 1, is discussed later). In this article we focus on how employees read these control charts, how they attribute meaning to the data displayed in these charts and what are the contingencies of these meanings upon context. We draw on material derived from different phases of our research: From the first, ethnographic phase of our research, we report reactions to the control charts displayed in situ in workplaces as expressed by different groups of employees; and from the second - design - phase, we describe how employees engaged with the learning opportunities we designed around SPC charts as a window on their thinking.
SOME INTRODUCTORY REMARKS ON THE MEANING OF GRAPHS Much has been written about the complexity of meaning in mathematics from philosophical and educational points of view (e.g., Kilpatrick, Hoyles, & Skovsmose, 2005). Nonetheless, Howson (2005) argues that out of all the complexity within the context of mathematics education, “... one must distinguish between two different aspects of meaning, namely, those relating to relevance and personal significance (e.g., „What is the point of this for me?‟) and those referring to the objective sense intended (i.e., signification and referents).” (p. 18, his emphasis). Managing these twin aspects in the context of associating “meaning” with mathematical objects and concepts has been at the heart of much discussion. Cobb, Yackel and Wood (1992), for example, focused on the role of symbols as constitutive of meaning rather than mirrors or representations of reality. Noss and Hoyles (1996) introduced the idea of situated abstraction to describe how mathematical knowledge-in-use is intimately connected to the practices of working cultures and how employees situate the abstractions
-4-
they use by “webbing” together meanings through contextual references. Such references are rich in narrative detail and crucially, dependent on the mediating role of the technology employed: but in mathematical and statistical modelling they are often regarded as “situational noise” to be suppressed. The meaning of graphs as a particular kind of mathematical artefact has been the subject of a considerable literature, much of which is drawn together in Roth (2004). He reports how in science the process of describing a situation from a graph is often characterised as inference suggesting that “meaning is something can be got out of graphs (one infers from)” (p. 76, his emphasis). Through a detailed analysis of an interview with an expert scientist, Roth argues to the contrary that graphs “do not just refer to entities but are closely related to the experiences where these entities are part of practical activity” (p. 79) and only against a practical experience of the background of the graph will the “meaning of signs exist” (p. 89). Our own previous research supports this view and has illustrated how this meaning can be reconstructed by professionals with experience of generating graphs related to their practice. For example in a study of paediatric nurses, we noted that when nurses were asked to interpret a chart of a patient‟s (baby‟s) blood pressure, they tended to superimpose on the charts a holistic narrative of what the baby might have been doing at the time of the readings, explaining certain fluctuations in blood pressure data by reference to anxiety or activity. We argued that in the context of nursing, such “explaining away of variation” that was not the outcome of a medical condition, was precisely what was required and expected in order that attention could be focused on what really mattered – variation from any individual‟s baseline data caused by illness (Noss, Pozzi, & Hoyles, 1999). However, while it might be conjectured that meaning can be “imposed” on a graph by an expert with adequate background knowledge, we know little about those who are less expert or who are not involved in the actual constitution of the data. -5-
In looking at our evidence on SPC, we are particularly concerned to understand how graphs might play a communicative role for the development of shared meanings for groups of employees who have, to some extent, a common workplace experience. In our research, we approach this issue of communication by investigating the role of symbolic artefacts from work situations, such as graphs, as potential boundary objects (Star & Griesemer, 1989). A boundary object is an artefact that helps the coordination of different perspectives of several communities of practice. Boundary objects must be flexible enough that different social worlds can use them effectively but robust enough to maintain a common identity among those worlds.3 We will see that symbolic boundary objects play a rather special role in the communication across boundaries, since they demand that special attention be paid to the ways in which communication is mediated by the technology in which the symbols live. In general, boundary crossing occurs if these objects do indeed facilitate communication between different activity systems, by making explicit the knowledge and assumptions mobilised in the interpretation of the object (see Kent, Noss, Guile, Hoyles & Bakker, in press). For the purpose of our research we mainly think of shop-floor operators, managers and ourselves as part of different communities with different agendas, experiences and formal knowledge.
RESEARCH METHODS The data presented in this article are drawn from a research project, Techno-mathematical Literacies in the Workplace, in which we are working in four different industry sectors
3
A classic example is Wenger‟s (1998) medical claim processing form that clients fill in and send to the
insurance company where it is processed through a sequence of departments, entailing communication across boundaries between “communities of practice”.
-6-
(packaging, pharmaceuticals manufacturing, automotive manufacturing and financial services4). Although we interview people operating on a wide range of levels, from operators to senior managers, our focus is on employees at the intermediate level (most commonly, first-level managers) – the mathematical knowledge actually required at this level has hitherto not attracted much attention in workplace research. The notion of Techno-mathematical Literacies (TmL) has developed out of our previous research on mathematics in workplaces (e.g., Hoyles et al., 2002) and seeks to characterise the functional mathematical knowledge grounded in the context of modern workplaces and mediated by available technology. The research is divided broadly into two phases: the ethnographic phase and the design phase. The main objective of the first phase is to characterise work-based activity around mathematical artefacts and tools, and of the second phase, it is to design learning opportunities around the use of these artefacts in order to engage in dialogue about meanings that might be communicated. Ethnographic phase. The first phase of the research has involved extended visits to a range of workplaces in each sector, during which we have conducted interviews with employees ranging from senior management to machine operators. Given the sites of the research presented in this article, in manufacturing and packaging industries, it is appropriate to use here the terminology of “shop-floor” employees (e.g., operators and senior operators), firstlevel managers (e.g., team leaders, supervisors), engineers and senior managers. We have also undertaken work-shadowing and observations, particularly focused on mathematical artefacts that arise from the use of IT in generating computer displays or printouts used to communicate information to employees and to customers. We describe our method in this phase as ethnographic, by which we mean that we spend many hours in workplaces,
4
We have not observed any application of statistical ideas in the financial services sector, hence this sector does
not feature in this paper. -7-
observing and talking with people there. We do not, however, attempt the kind of engagement that is typical of ethnography amongst professional anthropologists, typically involving immersion in the community over periods of months or years. For the research project as a whole we have carried out case studies in ten companies. Given the focus here on statistical process control, Table 1 only provides an overview of the case studies in which SPC has played a role.
TABLE 1 Research methods used in companies in which we have studied the use of SPC. (“2 researcher days” refers either to one researcher spending two days in one company or two researchers spending one day together.) Labelex
Filmic
Pharmacap
Classic Motors
Sector
Packaging
Packaging
Pharmaceuticals
Automotive
Case studies
10 res. days
7 res. days
7 res. days
13 res. days
Number of interviewees
8
10
10
12
Feedback meeting in the company
No
Yes
Yes (& discussion of research report)
Yes
SPC training observed
No
No (no SPC training in company)
1 x 4 hrs
2 x 6 hrs Questionnaire and post interviews
We have focused our workplace observations on situations where different meanings of what we see as mathematical-symbolic artefacts such as tables, charts and graphs become apparent in dialogues or actions. Such situations bring into view the explicit problem-solving and communication strategies of employees around these artefacts, and thus illuminate the TmL that might underlie these strategies, as well as the issues to be looked for in subsequent observations or subsequent interviews. We conduct interviews with a range of employees (usually during their work but sometimes removed from it while still within the workplace) around the mathematical artefact to investigate the extent to which it serves a communicative -8-
role as a boundary object between different communities. Following each site visit, we construct detailed reports, including transcripts, of all our interactions. Triangulation is a key concern for our research (cf., Hammersley & Atkinson, 1995). In collecting data, we continuously seek different views of the same workplace episode through the perspectives of employees including operators, supervisory managers, process engineers and process improvement specialists, stock controllers and schedulers, maintenance engineers, and senior managers. In analysing data, we triangulate interpretations of the data sources (audio transcripts, photographs, artefacts in the form of paper documentation) amongst the project team. We further triangulate our findings by presenting them in feedback meetings to the companies in which the research was carried out, and by appealing to experts in the particular industrial sector that the data come from, for example by using validation meetings in which we invite sector experts to comment on the project‟s findings and their broader generality and validity. This process of validation has frequently gone through several iterations requiring further revision of our interpretations. As part of this second phase, we have also observed SPC training courses in a pharmaceutical manufacturing plant and an automotive factory. Design phase. The second phase of our research involves devising ways to develop TmL, through design experiments. Design experiments are characterised by design cycles of preparing, designing, testing and revision (Brown, 1992; Cobb, Confrey, diSessa, Lehrer, & Schauble, 2003). In diSessa and Cobb‟s (2004, p. 80) words, “Design experiments are iterative, situated, and theory based attempts simultaneously to understand and improve educational processes.” For us, an important aspect of the design experiment methodology is its role as a window on how different communities of employees make sense of the mathematical features of an artefact and as a way to negotiate joint meanings across boundaries. Thus our intention in these experiments is not so much to transmit mathematical -9-
knowledge to operators or managers but rather to design what we call learning opportunities (to distinguish what we do from training as commonly interpreted) which are intended to stimulate boundary-crossing activities involving different groups of participants and ourselves. The learning opportunities are designed to create opportunities for participants to recontextualise (in the sense of Van Oers, 1998) mathematical ideas in real problem situations that we have observed on the shop-floor. We value the meanings employees express (even if they could be judged as statistically incorrect) since unpacking the sources of these meanings, which arise from a mixture of statistical knowledge, context and experience, is an important element of communication between groups at work and ourselves. Because we are not experts in any of the industry sectors, and because contextual meanings are so important, our learning opportunities are always co-designed with experts in the particular companies in which we work (these are variously process engineers, technical managers, etc.).
TABLE 2 Training courses that have included the learning opportunities presented here (we have carried out a design experiment in Classic Motors that we do not report here) Centre of Excellence for Packaging
Institute of Packaging
Sector
Packaging
Packaging
Participants
3 first-level managers from several companies who attended the SPC part
11 managers of different levels and companies
Hours
4 hr of which 1.5 hr on SPC
2 hr of which 20 min SPC
It is worth mentioning that conducting iterative design experiments in the way we had hoped in the workplace turned out to be a major challenge. In the commercial environment, companies are hesitant to allow employees to leave the shop-floor, and even if they can move to another room in the building they may be called away to deal with emergencies. In this case, the first course started with fifteen participants of whom only three remained until the
- 10 -
end. Thus we have been forced to draw on a rather eclectic set of material available, which in the case of the discussion of reactions to the learning opportunities is mainly derived from data gathered during a course given to a group of first-level managers, all from manufacturing but from a range of different companies. As it transpires this diverse background proved most illuminating. In the remainder of this article, we summarise results of the ethnographic phase and describe the design and preliminary evaluation of several learning opportunities around process improvement in the packaging industry, particularly involving SPC. We would like to stress that at the time of writing, we have gained more insight from the results of the ethnographic phase than from carrying out the design phase. Since the analysis in this article focuses on charts used in statistical process control (SPC), we first need to discuss in more detail the nature of SPC in theory and in practice.
STATISTICAL PROCESS CONTROL (SPC) IN THEORY In this section we summarise the core theory of control charts, based on a reading of a selection of statistics and management texts. The first element of the theory is that in any manufacturing process, variation is a fact of life. For instance, a bottle of milk labelled 1 litre always contains just a little more or less than exactly 1 litre of milk. The key insight is that control of a process is about predictable variation, not the absence of variation: A phenomenon will be said to be controlled when, through the use of past experience, we can predict, at least within limits, how the phenomenon may be expected to vary in the future. Here it is understood that prediction within limits means that we can state, at least approximately, the probability that the observed phenomenon will fall within the given limits. (Pyzdek, 1991, p. 101, quoting Shewhart‟s definition of control).
- 11 -
Deming (1986) used the terms common causes for random causes of variation within a system, and special causes for sources of variation that are not part of this constant system. The basic rule for SPC is that “variation from common cause systems should be left to chance, but special causes of variation should be identified and eliminated.” (Pyzdek, 1991, p. 102). One of the most commonly used tools for monitoring and investigating process variation is the control chart. To illustrate a few points about control charts, we use part of a real control chart produced in a company making adhesive labels (see Figure 1). Figure 1 shows a reconstruction of a real control chart of the output of adhesive labels on large rolls in metres per week.
FIGURE 1 Control chart of production of adhesive labels on large rolls; output is measured in metres per week
This example shows the five different elements typically present in any control chart: 1. Target: the target production usually defined by the company senior management, here set at 66,500 metres per week. 2. Mean: the actual mean of the KPI (key performance indicator) values over a period of time, here 63,000 m (although we do not know how many weeks in this case). - 12 -
3. The data points connected by a line represent the actual values of the KPI for each time interval in that time period. 4. Upper and lower control limits defined as the target value plus or minus 3 standard deviations of the actual data (usually these are calculated from a long run of historical data – and not from the data points on the chart itself). The idea is that in the presence of only random variation (common causes) about 99.7% of the actual values should fall within those limits. Hence, if a data point is outside those control limits, it is likely to be due to a special cause. 5. Upper and lower specifications: those limits may be based on customer requirements, regulations or machine capacity. For a stable process the control limits should be tighter around the mean than the specifications, as anything produced outside the specifications will normally be unusable waste.
Caulcutt (1995) describes the standard procedure for the generation of a control chart as follows: (a) obtain data; (b) put the data into subgroups5; calculate the mean and range of each subgroup; (c) calculate the overall mean ( X ) and mean range ( R ); (d) estimate the process standard deviation using R / d n ( d n is one of Hartley‟s constants, dependent on the sample size); (e) calculate values for the control lines on a mean chart and a range chart, using X , R , or the estimate R / d n ; (f) plot the group means onto the mean chart and the group ranges onto the range chart;
5
The decision of sampling frequency and grouping of samples is yet another subtle feature of SPC; we do not
discuss this.
- 13 -
(g) if the control charts indicate that the process was stable (in control) then these charts, or other charts of a more appropriate type based on the same estimates, can be used to monitor future production; (h) if the control charts indicate that the process was unstable (out of control) then the assignable causes [special causes] should be sought and corrective action taken. This whole procedure should then be repeated.
The theory of SPC offers rules of thumb for whether there is a special cause or not. In Figure 2, we show an extended version of the control chart from Figure 1, where from around week 27 onwards there appears to be an upward trend in the mean value. One of the SPC rules of thumb is that if there are eight consecutive data points above (or below) the mean there is probably a special cause, that is a “non-random” effect (such an occurrence has a probability of (1/2)8 = 1/256 ~ 0.39%). Similar rules of thumb for signals of special causes are six points in a row going up (or down), or cyclic patterns. The key idea behind each rule is that the chance of its occurrence is considered too small to be caused by (random) common causes. If the cause of a non-conforming point (one outside the control limits, e.g., week 42) is known, it should be written on the control chart.
- 14 -
FIGURE 2 The full control chart from the Labelex packaging factory; output in metres per week
Typically, on the shop-floor it is the task of a first-level manager (e.g., the team leader) to read the charts to ensure that the mean is close to the target, that data points stay well within the control limits, and that special cause variation is interpreted and acted upon. This might seem relatively straightforward, yet Alwan and Roberts (1995) report that many problems have been observed in how SPC charts are used in practice: In a sample of 235 „expert‟ control chart applications in training materials for SPC and in other sources for which we would expect considerable sophistication, we found that over 85% of control charts displayed misplaced control limits... The results of this systematic empirical study are consistent with what we have often observed in plant visits, where we have found that untrained users (the majority, in our experience) apply control charts procedures mechanically (often via computer software) and either interpret them incorrectly or pay no attention to them. (Alwan & Roberts, 1995, p. 270)
Caulcutt (1995) also reported considerable evidence of frustration and failure with control charts. For instance, he highlights the subtleties involved in the frequency of sampling of data, and how correct choices depend on appreciating the possible different time-scales of random and special-cause variation. This corpus of evidence points to tensions and differences between SPC as represented in textbooks and SPC as applied and reasoned about in practice. Our intent is to give a more coherent voice to the different actors reading these charts, and a description of the meanings derived and inferences drawn from them.
STATISTICAL PROCESS CONTROL IN PRACTICE In this section, we present some findings from the ethnographic research phase, and describe the operation of SPC in the practice of process improvement, giving voice to the managers, - 15 -
team-leaders and operators who are using the control charts. What follows is first a brief characterisation of SPC use in the four companies in which we carried out case studies on SPC. Labelex, a packaging company making labels, has a strong SPC implementation that is headed by professional process engineers and based on a process improvement programme used across several sites of this multinational company. The understanding of SPC by local shop-floor employees is generally considered problematic. Filmic, a packaging company making cling film, introduced SPC and trained employees in the mid-1980s. There is a legacy of using SPC but no active use for many years. This multinational company is currently initiating steps to re-introduce SPC, but there is resistance among operators and team leaders because they often do not see the point of collecting and plotting data. We heard from some at least one source that some employees feel that it is they who are being controlled rather than the process. In Pharmacap, a pharmaceutical company, SPC is being introduced as part of a lean Six Sigma programme (George, Rowlands, Prices, & Maxey, 2005). Comprehensive training of professional staff has been carried out (we observed one course), but SPC knowledge amongst operators and technicians is currently rather limited (although, to a certain extent it is assumed by managers). There is a strong culture of outsourcing technical expertise to specialist teams. Classic Motors is the most developed case that we have observed; SPC had been implemented successfully in critical areas – areas of car production that need to be monitored carefully because of potential risk or customer complaints involved. Filling in control charts and adding contextual information to non-conforming points and knowing reaction plans all
- 16 -
seemed to be part of the shop-floor culture. SPC training was extensive in the late 1990s and is now only offered when enough employees express interest. Across these companies, we note a range of difficulties related to reading SPC charts (see also Hoyles & Noss, in press). Many employees, even at Classic Motors, confused specification and controls limits. For example, they did not realise that specifications were set by senior managers, customers or regulations, while control limits were based on historical data and were therefore artefacts of statistical data analysis. On the crucial issue of dealing with variation, engineers and company trainers reported that operators – if they responded to control charts – tended to react too quickly to data points that were not very close to the target values. They might, for instance, adjust settings, which sometimes only degraded the situation – managers frequently called this “tampering” or “looking for shadows”. As a process engineer told us, the operators were often “responding to one isolated point and if I could give them the mindset that one isolated point isn‟t necessarily everything, that would be helpful.” In short, employees often reacted to common cause variation as if it was variation produced by a special cause. Conversely, if one point is outside the control limits this might be due to measurement error (a special cause) while the process itself is perfectly stable. In both cases, changing the settings will degrade the production process. Our own view, supported by the literature, is that the situation is not always straightforward to distinguish causes. Indeed, as Caulcutt (1995) points out, the distinction between common cause and special cause is not always clear: One can validly view common causes as special causes that are too expensive or time-consuming to fix. We also heard that operators frequently did not respond to trends in the data, as illustrated in the following incident, recounted to us by a manager at one of the pharmaceutical companies, Pharmacap:
- 17 -
We had a very expensive example where an operator didn‟t spot a trend. We have 40 positions for capsule filling, and for 4 hours one of those positions was creeping more and more out of control. After 4 hours and 10 minutes the damn thing fell apart, which cost £8,000 and took the machine out of service for 24 hours. So that is an example where an operator was not looking at the statistical data accurately enough. It was overfilling, and there was a reason for it. The reason was that the thing was coming loose; it was sitting high and getting overdose – and we could use the data to show that there was a trend.
The manager asserted that the operator should have spotted the trend, but the supervisor of that production area told us that operators tend to print out the charts and hand them to their superiors without looking at them. In our observations of companies, the situation at Pharmacap is quite typical: Senior managers expect their employees to do things on the basis of the charts, yet employees (operators, first-level managers) and senior managers offer contrary views about these expectations – so clearly communication of goals and practices is problematic. A key finding of the ethnographic study is that data from IT systems were often communicated through graphs or charts. Our ethnography also suggests that such communication is generally assumed by senior managers to be unproblematic, although we have observed that this is not the case in practice. The charts create an illusion of objectivity: If data have been collected and represented in a methodical way, the result is that many managers think that the data speak for themselves (see Roth, 2003, for a discussion of transparency of graphs in the context of scientific work; see also Noss et al., 2005). Yet in many cases it was claimed that the charts were misunderstood and in the worst cases, they functioned only as “expensive wallpaper”, as several employees called them, ignored by shop-floor operators and first-level managers alike.
- 18 -
We note that we are unable to deduce from our case studies whether charts were ignored because they did not communicate anything of importance, because they were not understood or whether there are other cultural issues about their role in the workplace decision-making (e.g., “it is not my business”). In fact, over time we have become convinced that it might be not be possible to separate these communicative, epistemological and cultural aspects. We noted dissatisfaction in some companies with SPC training; for example, a manager (M1) from one company, Labelex, asserted that training in SPC was generally disappointing in its effect: M1: You would like to think having done six days‟ training and gone into some detail on this that a few weeks time, a few months time, the quality is going to improve, that people will just get on and do it. It doesn‟t happen.
What is it that M1 expected his shop-floor colleagues to do? Were they in fact doing something but not in a way that was effective? If so, what was missing? Was there no change in their working practice as a result of the training? The results from our ethnographic work led us to investigate specifically how SPC charts are read and in particular the meanings articulated of the concepts of mean, variation, target, specifications, trend and scale. In considering control charts, however, we endeavoured not to ignore tool mediation, which we conjectured might play a crucial role in the meanings expressed by employees. In the vast majority of companies, IT tools automatically produce the charts from the data input, and in the modern workplace, workers tend not to enter the data but merely see the representations of the data set. SPC software also suppresses steps in the construction process: As one manager told us, “software does certain things without users knowing”. For example, arbitrary scales are used and changed, control limits magically inserted with no indication of their dependency on the standard deviation of historical data, and outliers are sometimes automatically (and invisibly) removed in the calculation of the - 19 -
mean. We do need to point out that at least some of this “invisibility” depends on a user‟s knowledge of statistics and the software. As one programmer told us, the SPC software only did things automatically if it was up set to do so, although of course these options were unlikely to be known by users who simply deployed the software according to the default settings. We now turn to a description of some learning opportunities we co-designed with company employees, and a report of employees‟ responses to these activities.
THE LEARNING OPPORTUNITIES This section summarises findings from the design phase in which we have developed learning opportunities for SPC. These learning opportunities have two major aims. The first is that through engagement with the activities, we open windows on the participants‟ meanings of SPC charts. Second, we intend that through discussion and experimentation, participants will negotiate new meanings that are shaped by, and come to reshape their appreciation of the work process, which might in turn influence their practice on the shop-floor. We focus on the first of these in the remainder of this article. In order to achieve both of these aims, we designed the activities according to two guidelines. First, each learning opportunity was based around a symbolic artefact from the workplace that could be used as a potential boundary object, in this case an SPC chart, over which problematic communication of meaning had been identified from the ethnographic phase of the research. Thus, the problems and situations presented to participants were authentic in the sense that they had been observed to be of genuine concern to employees. In other words, each learning opportunity provided opportunities to debate “real” issues from the workplace;
- 20 -
for example, the relative efficiency of different work shifts, or the range of actions that might be implied given certain data, represented in a specific way. Second, each learning opportunity involved negotiating the meaning of problematic elements of an SPC chart by opening the black box of the often-invisible tool mediation, where possible using real data from the workplace, amended as necessary to ensure confidentiality of the data source. A third design principle through which we plan to facilitate boundary crossing is to adopt a constructionist approach to the learning opportunities, that is encouraging the building of things externally with appropriate tools, as a means of building conceptual ideas so that these external signs are available for inspection and change (Harel & Papert, 1991; Noss & Hoyles, 1996). We now briefly describe the learning opportunities we designed around SPC in the packaging sector.
Learning Opportunity 1: Discussing Real Control Charts The first learning opportunity comprised discussion of a range of graphs collected in the workplace, including the SPC charts shown in Figures 1 and 2. Participants were invited to share their interpretations of what the data might mean and what actions they might take if such data displays were evident in their factories.
Learning Opportunity 2: Comparing the Performance of Shifts The second learning opportunity involves participants constructing a control chart using data collected from one of our research sites. The software used was TinkerPlots (Konold & Miller, 2005), which, in contrast to SPC software, does not offer any ready-made graphs but requires the user to structure unorganised icons representing the data by separating, ordering or stacking them, thus allowing them to build their own charts to analyse data. TinkerPlots - 21 -
requires little a priori statistical knowledge and calculations can be opened up or black-boxed at will. For example, in order to make the control chart such as that in Figure 3, participants have to pay attention to each step of construction (different orders are possible): First, order the icons vertically according to the relevant variable (here “gauge” - thickness), then order them according to the time variable in the horizontal direction (which gives a scatterplot), then connect the points, insert reference lines for the target and finally use the software to calculate the mean and control limits, and insert these into the plot. At first participants would simply be encouraged to experiment with the control chart: To plot the points over different time intervals, change the scales, calculate and insert lines for the mean and the control limits, draw in target and specification lines and discuss the variation evident in the graphs and how far they judged it be acceptable. They would then be offered two activities: The first to explore the consequences on the mean and control limits of introducing outlier points, and the second to separate the data into work shifts to discuss comparative performance. Figure 3 illustrates a control chart that might be constructed where the data concerned the gauge of plastic film, with a target gauge of 14.7 microns, during two consecutive shifts with the second shift starting after 240 min. The data set plots one measurement every 5 min.
- 22 -
3gaugeSPCdemo
15.3
gauge (micron)
15.1
14.9
14.70
14.7
14.5
14.3 0
50
100
150
200
250
300
350
400
450
500
tim e (m inutes)
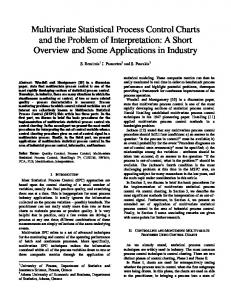
FIGURE 3 A control chart constructed in TinkerPlots on comparing gauge data of two work shifts. The second shift, making plastic film, started after 240 min. A “horizontal reference line” is here set at the target value of 14.7 micron.
Learning Opportunity 3: Spotting Trends in Control Charts The third learning opportunity involved discussion of data within an SPC chart made in TinkerPlots, in which there was an upward trend at the end of the plot. An important characteristic of using SPC effectively is to spot patterns or trends in data. As we previously pointed out, a trend such as eight points above the mean usually serves to indicate a change in the process and generally requires action. Our aim was that the participants would be able to explore this rule, and thus render it less opaque. Participants were presented with data concerning the weight of tablets in a pharmaceutical manufacturing process, with a target weight of 150 mg, upper control limit of 153 mg and lower control limit 147 mg. They were asked to make an SPC chart of the data, write down their observations, and discuss what action they would take. Figure 4 shows an SPC chart of the data produced in TinkerPlots as produced by two participants.
- 23 -
tabletSPC150mg
152,5 152 151,5
weight (mg)
151 150,5
150
150,00
149,5 149 148,5 148
147,5 0
5
10
15
20
25
30
35
40
45
50
pill_num ber
FIGURE 4 Plot of data from a pharmaceutical tablet-making process made by two participants
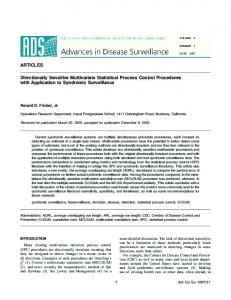
Inspired by the Pharmacap story on not spotting a trend, we developed two TinkerPlots process simulations to provide a richer experience of processes, based on the context of 25gram packets of drug tablets. The first was designed to give participants a feel for what randomness within an “in control” process looks like; for instance, every so often, a data point would be just outside the control limits (roughly 1 out of 300). The second simulation was designed to address the question of “when to stop a process” (see Figure 5). Data points were plotted slowly in succession, and participants were invited to say “stop!” when they thought the process behind the simulation was out of control and to explain why they thought so.
- 24 -
Process7
27 26,5
pack_weight (gram)
26
25,90
25,5 25
25,00
24,5 24,10
24
packSlider = 50,0
23,5 23 0
a
10
20
30
40
50
60
70
80
90
100
0
pack_num ber pack_number
packSlider
20
40
60
80
100
Process7
27 26,5
pack_weight (gram)
26
25,90
25,5 25
25,00
24,5 24,10
24 23,5 23 0
10
20
30
40
50
60
70
80
90
100
pack_num ber
b
pack_number
packSlider
FIGURE 5 TinkerPlots simulation of a process just before (a) and after (b) a trend became apparent. The process is simulated with a play button and slider.
ATTRIBUTING MEANINGS TO CONTROL CHARTS We used these learning opportunities with two small groups of 3 and 11 employees from different packaging companies (see Table 2). In the following discussion, we bring together participants‟ responses to the learning opportunities firstly as windows on what particular aspects of the chart meant to them, that is its display of mean and limits, target and specifications, scale and trend, and secondly to assist us in developing our theoretical stance as well as further revisions in the design of the activities. We organise our remarks under headings derived from the embedded mathematical topics as we see them, although it will
- 25 -
become clear that this mathematical classification is not necessarily a characteristic of the perspective held by participants.
Specification and Control Limits As we described earlier, specification and control limits originate from different sources – the former from statutory, engineering or customer agreements, the latter arising from statistical analysis of the data. We were interested in how the participants interpreted the limits presented in the control chart (Figure 2), simply asking for reactions to the graph and, in particular, to the limits and the variation in the data. M3 was a manager with an engineering degree who was familiar with SPC in his factory. He did not read the limits in the control chart in accordance with SPC theory and revealed some confusion between the two types of limit. Despite this confusion, his response was meaningful from an industrial perspective: M3: The upper spec limit is, I would think, the upper machinery limit. The upper control limit I would make a guess to say if the kit running at that speed that is probably where you get such variation that the quality goes downhill. So they are probably creating an awful lot of scrap - that is why you put the upper control limit lower than the other limit. I reckon that the upper spec limit would be the name plate of the machine that you are dealing with. As fast as it can run. That is 100%. The upper control limit is then what you can run it at without creating a lot of scrap, because if you run it flat out it doesn‟t like it for too long. Why you‟d have a lower spec limit, I don‟t know. Maybe if you run below, it might not be worth economically running it.
Thus he thought control limits were, like specification limits, something that were positioned on the graph according to some specific factors external to the data, and so could be changed even if the data set remained invariant. Later in the discussion M3 described statutory (lower) - 26 -
limits on packaging that played an important role to the food industry by specifying the allowed variation in the declared weight of a food pack and imposing significant penalties on companies if packs are discovered below these limits. We learned, therefore, that it was essential that a company‟s management would lay emphasis on statutory specification limits whose contravention would directly affect the company‟s continued operation, rather than on statistical control limits, whose contravention may possibly be nothing more than an unusual mathematical phenomenon. Nevertheless, from the point of view of understanding the production process – which is, after all, the ostensible intention of SPC – it was surprising to see how routinely the two kinds of limit, specification and control limits, were confused, even to the extent of the latter being completely ignored. There was also confusion regarding what the control limits were supposed to measure. For example, the control chart of Figure 2 was produced by the company‟s software (Winchart), and the management had decided that by default, outlier points outside the control limits were automatically removed by the system in the calculations of the mean and the control limits. We asked participants whether they thought this should be the case and why. Most could not articulate any good reason why this was done, some thought it would distort the picture of the process (where in fact the omission of a special cause is intended to give a truer picture), while others expressed different views as illustrated in the following: R1: Do you think this is the right thing to do [remove the outlier points]? They say, well that‟s what the software does. M4: The thing is you are not getting the right mean, are you? If that point is not coming right and you ex it out, you are not getting the right readings. R1: Do you think the software was right in taking it out? M3: If you have a bad week, you might want to forget it. What are you trying to trend? If you trend what you are running, what your good output is, forget it. If you are trying to - 27 -
capture how your business is really running over a long time, either way. If it is a one-off occurrence, the actual effect on the mean shouldn‟t be – it depends on how often you recalculate that mean. Is it a ten-week rolling average or a ten-year rolling average. It is just how much of an impact is it going to have. R1: How about you, [M5]? M5: If it is just one in 61 weeks, I [would] probably just take it out. R1: Because it is an exception? M5: Yeah, if there is not an exception every other week.
Thus the participants seemed to want to judge what they would do as a result of noticing outliers as dependent on the context. Paradoxically, this judgement requires both more and less knowledge than when there is no software present. It requires less knowledge in the sense that the software does handle the calculation of elements that are not necessarily relevant (for the particular purpose) and, of course, the software does so without error. On the other hand, more knowledge is required in the sense that observers must understand the output of the program, and to some extent at least, what is going on inside the “black box”. This is an example of a much more general phenomenon that we have seen repeatedly, that the introduction of digital technologies at the same time removes the need for certain kinds of knowledge, and introduces the requirement for new and different knowledge. It is precisely this paradox that has led us to define Techno-mathematical Literacies, as a combination of mathematical and technological knowledge situated in a work context.
Common Cause Variation, the Mean and Target We now turn to the question of the mean and the target, and the managers‟ acknowledgement of variation. From the discussions that arose during the learning opportunities, we formed the
- 28 -
impression that all our participants expected the mean and target to be exactly the same and all wanted to hit the target. They did not allow for any common cause variation. For example: M3: If you have a target there, you want to be shooting for it, I guess. R1: This is an example of a data point outside the lower control limit [Figure 2]. That is when the operators have to write the reason [tension control problems]. There was a rule in this company: If you were outside a limit you had to write down the reason. M3: Why do you set a target then? Because I would like an explanation every time they [the operators] did not hit the target. R1: Every time you are below that line, say? M3: Every time! Yeah. Probably the first thing you did when you came to work. M4: If you have a target to hit, you have got to hit those targets.
To our surprise the managers wanted to know why a data point was not the same as the target, even if it was extremely close to it, well within the control limits: R2: You see that point there [R2 points to one just below the target]? M4: It might not be such a problem, but I‟d still want to know why you are not hitting the target. R2: But would you ask me about that one [R2 points to next point which is just above the target]. M4: Yes. Because we get a target match. If we are over or under that target we have to find out either way. There has got to be reason. They chain the machine up more or they have extra staff on.
Initially, we interpreted this view as deterministic, assuming that the participants had simply demonstrated a lack of understanding of variability. However, on analysing all the interactions, we were forced to rethink their position. For example, the factory in which M3
- 29 -
worked produced packets of potato crisps, so output was a discrete countable number of packets or boxes rather than a continuous measure: M3: With these guys [at Labelex] – there is going to be a long shelf life on adhesive labels I guess, and they may have tons of warehouses space so if they overproduce then there is not a problem to them. But to people working with short shelf life and multiple units, so you could be doing supermarket X for a couple hours, supermarket Y is the next. What happens if you actually overproduce the X order and under-produce for Y? Then you have two unhappy customers. One will say, I don‟t want the product; it is more than I ordered, so that is waste and the other will say, where is my product?
Two other managers similarly emphasised the very short shelf life of the products they dealt with, and how it was a hugely important factor in their context: M4: We only have a life span of two days on sandwiches, five days on ready meals.
Thus in the specific context of producing food with a short shelf-life, and moreover, food that comes in discrete quantities (e.g., a pack of sandwiches rather than a bulk amount) underproduction of any kind is a problem for customers: An order of 10,000 sandwiches has to be 10,000, not 9,998 – counting discrete quantities is straightforward, and the receiving company will want to know why it is being asked to pay for even one or two more items than what is delivered. Overproduction is similarly problematic: Producing too many items may not be a problem for the receiving company, but is certainly an unnecessary waste for the producer. Thus through these discussions around the charts, we found that the learning in these contexts of producing discrete quantities of short-lived packets, common cause variation cannot be regarded as irrelevant to the manufacturing process: All variation has to be acted on and the mean must hit the target. This was contrary to our expectations derived from the theory of SPC and from our ethnography of companies who happened only to manufacture products - 30 -
measured by continuous data, for example, film (gauge), tablet packs (weight) or rolls of adhesive labels (length). This finding suggests that companies have to decide at which point and for which measures engaging in SPC to reduce variation is cost-effective and useful; this will depend on the product manufactured as well as the costs of process improvement.
Variation, Scale and Trend In the third learning opportunity, participants explored, with TinkerPlots software, data from a context derived from a pharmaceutical context, the weight of tablets (Figure 4). By putting the managers in the position of constructing their own charts, we hoped that both they and we could unpack the assumptions they and we made, the rationales for their and our viewpoints, and any interplay between mathematical knowledge and employee expertise. Two participants, M4 and M5, constructed the time series graph and observed that the variation was “too wild”, even though the text stated that the target was 150 milligrams with an upper control limit of 153 mg and a lower control limit of 147 mg: The process was, in fact, in control. We assumed that they looked at the “spikiness” of the graph and not at the scale: Indeed, one of the researchers hinted at the idea of changing the scale, but the managers did not appreciate that the variation was acceptable. Similarly, they did not spot any upward trend after week 42 and steadfastly maintained a perspective on the data quite different from ours. The key point here is that the context of the problem the chart that we had designed to illuminate was alien to the managers. That being the case, they found it difficult to read the graph since, in particular, they had no helpful intuition as to what was acceptable variation: Recall that they believed in their context of producing numbers of food packets that the only acceptable variation was no variation (they were less concerned about the weight of
- 31 -
individual food packets, for which SPC might be more appropriate). Similarly, there are contexts in which “more is better”: Graphs that slope upwards are simply “good” (produce more, sell more or make more profit). So we should not have been surprised at the following interchange with M3, after the trend had been pointed out to him: R1: Do you see any trend in that [Figure 5]? M3: The trend is, it is basically getting better towards the end.
Note that M3 stated that it was “getting better”. But in this context, where capsule weights have to be close to 150 milligrams, it is not appropriate to talk about “getting better towards the end.” The researcher invited M3 to think further and M3 responded: M3: But it is tablets, isn‟t it? So it is not necessarily good. Your yield is going down if you are putting more material in to each tablet.
He was right: More tablets are not necessarily good. But the explanation was not quite right. From a pharmaceutical point of view, there are very strict regulations as to the range of weights which are acceptable. Yield (the good products as a proportion of the raw materials used) is a secondary issue in pharmaceuticals, whereas for M3 in food manufacturing yield is the primary issue. Here again, we see the extreme sensitivity of interpretation to the specificity of interpreter‟s context. Because “seeing the trend” in Figure 5 turned out not to be obvious, we used the two process simulations with the second group of managers to try to sensitise them to shifts in the process. Once again, when shown Figure 5, no one observed the potential trend at the end. Only one (out of 11) manager noted there were more values above the target than below. After going through the simulation of a few random processes and a few with trends (where they had to say “stop” if a trend was observed) these managers did become more focused on trends. When we revisited Figure 5, they first noted that the variation was large (just as the first
- 32 -
group did) and ignored the scale and control limit, but they did notice the trend at the end of the process. It seems that it is fostering an awareness of trends in graphs, in contrast to knowing the SPC rules of thumb such as “eight points above the mean”, that can help people “see” trends, that in turn can serve not simply as a representation of a potential trend, but crucially as a signal for potential action (which, in the Pharmacap example quoted before, was not taken).
Contingencies upon Context The second learning opportunity on the gauge of plastic film provides further illustration of the role of context knowledge. We had expected the seemingly simple observation that the mean of the second work shift was closer to the target, and perhaps that the variation of the second shift was bigger. However, when the participants compared gauge measurements from the two different shifts they would not come to a decision, preferring instead to request contextual information. Was the film sold by length or by weight? This mattered for costs: If it was sold by weight, then slightly high thicknesses did not cost the company much money, but of course customers could complain if this affected the length of the rolls too much. If it was sold by length, then high thicknesses were not good for their yield. In other words, they were mainly concerned about the cost of producing film that was too thick and, contrary to what we had expected; they did not seem to be so concerned with the variation in gauge. In the company from which the data were drawn, we were told that operators were almost only focused on variation, and not on the average – as variation in gauge causes huge problems in “rolling” the film, while the difference in cost of small changes in thickness is not their primary concern.
- 33 -
The participants also asked us to provide more information on other factors they predicted would be relevant, such as waste, and at what speed film of different gauges could be run. Even when we gave a second group much more information, they still asked for more: What was the shift pattern? Were the ambient temperatures the same? Were there differences between months, between day and night shifts? Again, context proved crucial for interpreting the data, and making judgements as to comparative performance. This learning opportunity showed dramatically how the participants needed to situate the abstraction of the graphs in a rich workplace scenario and how they were unwilling to cross the boundary to our more statistical interpretation until this description was in place. SPC charts are designed to make visible aspects of the process, but give few rules for action, apart from rules of thumb that should not be applied blindly. These rules have to be derived in relation to the context. Ideally, technical (SPC) knowledge and context (company) knowledge are integrated, and balanced with adequate understanding of the role of the technology used (e.g., SPC software). It is this type of integrated and mediated knowledge that we call “techno-mathematical” and its general application in context, techno-mathematical “literacies” (TmL).
DISCUSSION Process improvement exercises in companies involve a mixture of management and statistical techniques, and require new knowledge and skills (see Bakker, Hoyles, Kent, & Noss, 2006). In this article we have focused on the theory and practice of statistical process control and, in particular, on the meanings attributed to control charts. So what can we say about the use of SPC and achieving more effective communication of data representations along with decision-making that is informed by reasoning with the charts?
- 34 -
In our ethnographic work, we were struck by the implicit assumption of most managers and employers about the objectivity and unproblematic nature of data representations, despite the fact that it became clear that for the most part, the messages of the data representations in general, or the complexities underlying control charts were not communicated to employees and first-level managers. For example, operators often reacted to individual measurements lying outside control limits where this was not necessary or might even be counterproductive; many employees, even higher-level managers, often confused specification and control limits and did not readily appreciate the differing basis upon which each was derived and tended to ignore scale and to leave trend unnoticed. What is generally not realised, we suggest, is that Techno-mathematical Literacies are required to communicate with control charts; their meanings have to be situated in specific work practices and must take account of the mediation of the tools with which the charts are constructed – tools that render some of the underlying structure invisible. Our approach through engagement in learning opportunities contrasts with standard SPC courses, in which the focus tends to be on standard theory with little recognition of the role of context. In such courses, differences in meanings generated by different employees are largely invisible. Trainers do not generally realise how contingent such meanings are on individuals‟ knowledge and on the community in which individuals work. However, following our ethnographic work, and especially the experiences of managers engaging with our learning opportunities, we can report how the meanings of the objects (e.g., graphs) and relationships (e.g., variation) of SPC theory is situated, negotiated and recontextualised in each individual setting. At a first level, we have seen from the illustrative examples in this article, how the meanings that individuals bring to their interpretation of SPC charts, or the decisions they would take, are heavily contingent – even more than we had expected beforehand – on the specificities of - 35 -
the context that they bring to bear on situations or problems. The role that technology plays here is also substantial. Software packages take actions on data that are generally invisible for employees; for example, taking out outliers in the calculation of the mean. Hence it is not surprising that many employees experience the technology that produces the charts as an almost entirely black box. There is, however, a second level. We might say that the confusion between statistical control limits and statutory specification limits stems from a misunderstanding derived from different activity systems, or that a reluctance to locate a trend that is obscured by scale is similarly a failure to view the statistical context as a part of the reality of the production process. But it might be more useful to recognise that the statistical chart itself is subject to different meanings: Not just the distinctions within SPC theory discussed, for example, by Caulcutt (1995), such as the differences between discrete and continuous manufactured items, but also non-theoretical differences between made-to-order and continuously made products, or between short and long shelf-life merchandise. For example, where we initially (and too hastily) judged our packaging managers as deterministic thinkers who did not appreciate the common cause variation of the process, we came to realise that their object of activity was to produce an exact number of sandwiches or salads for particular supermarkets, and so where we had assumed allowable common cause variation, their activity systems generally did not permit such deviations. Knowing when and how to act depends on knowledge of both SPC theory and the context. SPC theory can help to know that eight points above the mean is likely to occur thanks to a special cause, but if the process were stopped at each instance of such a rule violation (there are many more probability-based rules), the production process would not be very efficient. Context knowledge is therefore crucial in deciding what action to take if a control chart does not show optimal behaviour. In short, companies can only call upon the strength of process - 36 -
improvement theory if it is integrated into the activity systems whereby it takes account of the purpose of work, the existing rules and, what we have identified here, the nature of the data. This requires non-trivial recontextualisation of SPC theory into the concrete work practices or, to phrase it the other way round, enhancement of the current practices with theoretical tools and methods. The theoretical implication is that there are different ontologies of SPC charts, and that these are determined not simply by the context of use, but also by the different relationships between the actors involved: Chart producers (senior management, statisticians) as well as “consumers” (operators) and those in-between (supervisory managers). Some of these relationships are undoubtedly hidden: First, because operators do not meet statistical experts, and second, because of the invisibility that accrues from the technology that we previously referred to. To the extent that the charts enter into the discourse of the workplace (and, as we have seen, they often do so only invisibly) they not only represent aspects of the work process, they echo the different ontologies, different characterisations of the concepts and relationships that exist for individuals or communities. Thus they are part of the constitution of meanings, rather than a reflection of already existing meaning inherent in the statistical relationships. From a boundary-crossing perspective, our learning opportunities expose an epistemological dimension that may not be entirely evident in, for example, Engeström‟s (2001) boundarycrossing approach as a means to change the object of activity. For our participants, the meanings of the familiar (and not so familiar) charts presumably shifted as their knowledge of their underlying constructions developed, and as the relationship of the data to the process was elaborated. A particularly interesting crossing point occurred between us and the participants in the learning opportunities: There are several instances mentioned earlier where we had to enhance our statistical view of the use of control charts with contextual reasons, - 37 -
and where the participants were stimulated to take into consideration mathematical and statistical issues such as scale, trend, control limits and so forth in an effort to communicate more effectively across the boundary. Our key finding, therefore, resonates with Howson‟s (2005) distinction regarding meaning, referred to in our introductory remarks. We have seen how, for example, for the participants the different meanings of the mean (derived from the data) and the target (set by management) was far from simple and, in fact, not distinguished within their practice; how the specific characteristics of graphs in terms of their mathematical structure were often insufficient as a basis for drawing conclusions; how variation can be a much more salient facet of a process than mean, even when, from a mathematical point of view, each have equal importance; and how control limits – derived from a calculation of the standard deviation of the data – are often seen as externally imposed upon the data. From this point of view, our findings also resonate with Roth‟s (2005) who argues that “the understanding of graphs in one [fish] hatchery is deeply integrated in the understanding of the local particulars; the “meaning” of graphs and other mathematical inscriptions exists in their close integration into the work process.” (p. 75) From a mathematical point of view, we could characterise this situatedness of (to us) mathematical relationships as a failure on the part of the employees. But this is to oversimplify the situation. Considering variation from a strictly mathematical point of view in the context of food production simply does not make sense: It surely leads to wastage and financial loss. Conversely, knowing why it might make sense to remove an outlier and the effect this has on, say, the control limits, is partly a piece of strictly mathematical knowledge, a meaning that derives from knowing about the objective meaning of what the symbols represent. So we need to recognise the reciprocal relationship between workplace and
- 38 -
mathematical knowledge, and in particular, the ways in which each might come to shape an understanding of the other.
CONCLUSION We conclude with some observations concerning learning, or more strictly, the sharing of mathematical meaning. From the point of view of workplace learning, it is reasonable to conclude that mathematical knowledge has to be carefully inserted into the practice, that there needs to be awareness on the part of “trainers” of the kinds of meanings that will inhere in learners from their context. This only serves to underline the severe limitations of any “competencies” approach that attempts to list mathematical skills as if they can be unproblematically grafted onto workplace knowledge (and, at worst, discounts workplace knowledge completely). From a cognitive point of view, employees have to situate the abstractions of the work process, yielded by the technology, into the context of their use, as well as into a system of techno-mathematical knowledge: There is knowledge that is mathematical and this knowledge can add to overall understanding of the work process. Data points index specific quantities or parameters at different times, but they are equally simple abstractions with properties deriving from their relationship to each other. Outliers are not just an occurrence on the shop-floor; they are equally a statistical event that is amenable to analysis. Setting up situations that assist in crossing these boundaries between mathematical and experiential communities, leads to twin challenges. The challenge for managers and operators is to web their knowledge of the work process with knowledge of what the graphs represent, and, reciprocally, to infer meanings of the work process from the graphs themselves. On the other hand, we have seen professional training courses in SPC tend to focus entirely on the “textbook theory” of SPC as a statistical phenomenon. It is obvious that this would be of limited value. But now it is appropriate to add a more substantive point of criticism: While
- 39 -
such a course may improve an individual‟s appreciation of statistical techniques, it is hard to see – given the dependence of meanings of control charts on the specificities of the practice – how such an approach would help substantively in drawing SPC into the mainstream of activity within the production process. It is here the special role of symbolic artefacts in facilitating boundary crossing becomes operational. Precisely because graphs are symbolic objects, they can be read mathematically, constituting meanings among the symbols as well as meanings derived from the objects they represent. A final comment. When trying to tease out whether not reading charts at the shop-floor is a cultural or an epistemological issue, it became clear that it was impossible to separate the two. Our boundary-crossing approach addresses both at the same time: The first requirement is that employees look at graphs, not as expensive wallpaper, but as having potentially interesting meaning for themselves. After engaging in our learning opportunities, one manager said: M5: We do use graphs [in our company], but now I would actually LOOK at the chart. Look at the chart and not just as a piece of paper on the wall.
Once the graphs are read, the second requirement is a recognition that meanings of representations of data will be read differently in different communities. But, as our work has shown, this can be motivating. Employees enjoy discussing their different factory contexts and their bearing on the data and the representations. M4: And it was also nice to understand what other companies say about graphs and how it works for them.
Above all, boundary crossing places value on giving voice to employees, an approach much appreciated by the participants in our research:
- 40 -
M5: A lot of workshops you go off and you listen, they tell you what they want and that‟s it. You actually sat and listened to what we were saying and that was nice.
Acknowledgement The Techno-mathematical Literacies in the workplace project is funded by the Teaching and Learning Research Programme [www.tlrp.org], a special programme of the U.K. Economic and Social Research Council, Award Number L139-25-0119.
References Alwan, L. C., & Roberts, H. V. (1995). The problem of misplaced control limits. Applied Statistics, 44, 269-278. Bakker, A., Hoyles, C., Kent, P., & Noss, R. (in press). Improving work processes by making the invisible visible. Journal of Education and Work, 18(4). Brown, A. L. (1992). Design experiments: Theoretical and methodological challenges in creating complex interventions in classroom settings. Journal of the Learning Sciences, 2, 141-178. Caulcutt, R. (1995). The rights and wrongs of control charts. Applied Statistics, 44, 279-288. Cobb, P., Confrey, J., diSessa, A. A., Lehrer, R., & Schauble, L. (2003). Design experiments in educational research. Educational Researcher, 32, 9-13. Cobb, P., Yackel, E., & Wood, T. (1992). A constructivist alternative to the representational view of mind in mathematics education. Journal for Research in Mathematics Education, 23, 2-33. Deming, W. E. (1986). Out of the crisis. Cambridge, MA: MIT Press. diSessa, A. A., & Cobb, P. (2004). Ontological innovation and the role of theory in design experiments. Journal of the Learning Sciences, 13, 77-103. Engeström, Y. (2001). Expansive learning at work: Toward an activity theoretical reconceptualization. Journal of Education and Work, 14, 133-156. George, M.L., Rowlands, D., Prices, M., Maxey, J. (2005). The Lean Six Sigma Pocket Toolbook. New York: McGraw-Hill. - 41 -
Hammersley, M., & Atkinson, P. (1995). Ethnography: Principles in practice (2nd ed.). London: Routledge. Harel, I., & Papert, S. (Eds.). (1991). Constructionism: Ablex Publishing. Hoyles, C., & Noss, R. (in press). The meanings of statistical variation in the context of work. In R. Lesh, E. Hamilton & J. J. Kaput (Eds.), Models and modeling as foundations for the future in mathematics education. Mahwah, NJ: Erlbaum. Hoyles, C., Wolf, A., Molyneux-Hodgson, S., & Kent, P. (2002). Mathematical skills in the workplace. London: Science, Technology and Mathematics Council. Retrieved May 24, 2006, from http://www.ioe.ac.uk/tlrp/technomaths/skills2002/ Howson, G. (2005). "Meaning" in school mathematics. In J. Kilpatrick, C. Hoyles & O. Skovsmose (Eds.), Meaning in mathematics education (pp. 17-38). New York: Springer. Ishikawa, K. (1990). Introduction to quality control (J. H. Loftus, Trans.). Tokyo: 3A Corporation. Kent, P., Noss, R., Guile, D., Hoyles, C., & Bakker, A. (in press). Characterising the use of mathematical knowledge in boundary-crossing situations at work. Mind, Culture, and Activity. Kilpatrick, J., Hoyles, C., & Skovsmose, O. (Eds.). (2005). Meaning in mathematics education. New York: Springer. Konold, C., & Miller, C. (2005). TinkerPlots. Dynamic Data Exploration. Statistics software for middle school curricula. Emeryville, CA: Key Curriculum Press. Lapré, M. A., Mukherjee, A. S., & Van Wassenhove, L. N. (2000). Behind the learning curve: Linking learning activities to waste reduction. Management Science, 46(5), 597-611. Noss, R., Pozzi, S., & Hoyles, C. (1999). Touching epistemologies: Statistics in practice. Educational Studies in Mathematics, 40, 25-51. Noss, R., Bakker, A., Hoyles, C., & Kent, P. (December 16, 2005). Situating graphs as workplace knowledge. Manuscript submitted for publication. Noss, R., & Hoyles, C. (1996). Windows on mathematical meanings: Learning cultures and computers. Dordrecht, the Netherlands: Kluwer Academic Publishers.
- 42 -
Pyzdek, T. (1991). What every manager should know about quality. New York: Marcel Dekker, Inc. Pyzdek, T. (2001). The Six Sigma handbook. New York: McGraw-Hill. Roth, W.-M. (2003). Competent workplace mathematics: How signs become transparent in use. International Journal of Computers for Mathematical Learning, 8, 161-189. Roth, W.-M. (2004). What is the meaning of "meaning"? A case study from graphing. Journal of Mathematical Behavior, 23, 75-92. Roth, W.-M. (2005). Mathematical inscriptions and the reflexive elaboration of understanding: An ethnography of graphing and numeracy in a fish hatchery. Mathematical Thinking and Learning, 7, 75-110. Star, S. L., & Griesemer, J. (1989). Institutional ecology, 'translations,' and boundary objects: Amateurs and professionals in Berkeley's Museum of Vertebrate Zoology, 1907-1939. Social Studies of Science, 19, 387-420. Van Oers, B. (1998). The fallacy of decontextualisation. Mind, Culture, and Activity, 5, 135142. Wenger, R. H. (1998). Communities of practice: Learning, meaning, and identity. New York: Cambridge University Press.
- 43 -