from the analysis, as this causes the apparatus and the power unit as a whole to fail. When an STU heat exchanger works out its service life, the prevailing.
ISSN 0040-6015, Thermal Engineering, 2007, Vol. 54, No. 8, pp. 664–671. © Pleiades Publishing, Inc., 2007. Original Russian Text © K.E. Aronson, Yu.M. Brodov, A.Yu. Ryabchikov, B.E. Murmanskii, 2007, published in Teploenergetika.
Statistical Simulation of Failures of Heat Exchangers in Developing a Comprehensive System for Monitoring the State of Steam-Turbine Units K. E. Aronsona, Yu. M. Brodova, A. Yu. Ryabchikova, and B. E. Murmanskiib a
Ural State Technical University (UGTU-UPI), ul. Mira 19, Yekaterinburg, 620002 Russia b Sverdlovsk Branch of TGK-9, prosp. Lenina 38, Yekaterinburg, 620219 Russia
Abstract—Results from statistical simulation of damages to the tube systems of the condensers and high-pressure heaters used in steam-turbine units are presented. The flow of failures of high-pressure heaters is described, using which their failure rates are estimated, and data are given that allow measures to be recommended on improving the system of maintenance activities for these apparatuses. DOI: 10.1134/S0040601507080113
One of the main approaches for analyzing failures of machines and structural components is based on physical simulation of damages to materials. The scatter in their properties and the variable nature of loads can be taken into account using statistical models. As far as power-generating equipment is concerned, this problem can be solved by setting up a comprehensive state monitoring system, a facility that allows parameters or indicators (reliability indicators included) to be displayed in continuous and clear manner by means of estimating the state directly (e.g., using a metallographic analysis), by using physical (phenomenological) simulation, and by constructing diagnostic or statistical models. One of the possibilities offered by monitoring (these are very few in number, since the physicochemical processes causing the elements of equipment to become worn and aged are complex in nature; in addition, the specific conditions of their operation should be taken into account) consists in statistically simulating the parameters of state. Statistical data can be used first of all to substantiate the parameters of state and the reliability indicators of power equipment. In addition, the change to the strategy of repairing the equipment of thermal power stations (TPSs) in accordance with its state generated the need of using statistical models to solve optimization technical and economic problems, in particular, when the remaining service life of equipment has to be estimated [1–9]. The reliability characteristics of condensers and high-pressure heaters (HPHs) affect the operational reliability and economic efficiency of the entire steam turbine unit (STU); the temperatures of feed water downstream of the HPH and the vacuum in the condenser, which characterize the operation of these apparatuses, are among the main parameters used to work out the technical and economic indicators of a power
unit and determine the margins for the thermal efficiency of a TPS as a whole. One feature specific to the operation of the shelland-tube heat exchangers used in STUs is that partial failures of these apparatuses, caused by damage to one or more tubes in a bundle, are admissible. Quite a number of these tubes may be blanked off as a result of their long-term operation. Those planning the replacement of the heat-transfer tubes used in condensers usually consider that the apparatus reaches it limiting admissible state when 10% of the total number of these tubes have failed [4, 6–8]. These data have been obtained as a result of solving an optimization technical and economic problem, in which the loss due to the less efficient operation of an STU the condenser of which has a reduced heat-transfer surface (some of the tubes have been blanked off) was compared with the costs for restoring the heat-transfer surface (replacement of tubes). The cases of mass-scale (burst) failures, when hundreds of tubes fail simultaneously, were discarded from the analysis, as this causes the apparatus and the power unit as a whole to fail. When an STU heat exchanger works out its service life, the prevailing mode of its failures is gradual as to their accumulation but abrupt and mass-scale as to the way damages manifest themselves [4, 5]. Wishing to estimate the way the nature of failures influences the making of decisions on replacing the tubes, we studied the failure rates of six Type K-15240 condensers of the Khar’kov Turbine Works K-300-23.5 turbines operating at the Refta district power station. Each condenser is equipped with tubes of diameter 28 × 1 mm made of brass and copper–nickel alloys (see table); each apparatus has 19 592 tubes. The condensers had been in operation for 30–35 years; this allowed us to obtain representative data on their failure rates for the entire period of their operation (Fig. 1). The tubes
664
STATISTICAL SIMULATION OF FAILURES OF HEAT EXCHANGERS
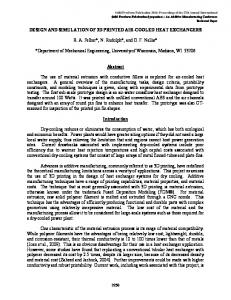
installed in the condensers of turbines Nos. 1–4 are made of brass alloys (part of the bundle used in the condenser of turbine No. 4 is assembled of tubes made of MNZh5-1 material), and the condensers of turbines Nos. 5 and 6 use bundles of tubes made of a copper– nickel alloy (see table).1 We see that the susceptibility of the brass tubes of the condensers of turbines Nos. 2 and 4 to damage has two characteristic periods: with an operating time of less than 195–205 thousand h and with more than this value. The first period saw gradual (random) failures, and the second saw mass-scale damages to tubes (a few hundred tubes were blanked off at once during repairs after hydraulic pressure tests). In Fig. 1a we also find an approximation of the experimental data on the failure rates of the condensers of turbines Nos. 1 and 3 corresponding to mass-scale failure of tubes. The failure rates of the tubes of the condensers of turbines Nos. 5 and 6 (Fig. 1b) are gradual in nature, which, in our opinion, is also determined by random factors. The fact that the failure rates of tubes are different in nature generates the need to use different approaches to simulating condenser failures. The rates of damages to the condensers of turbines Nos. 2, 4, 5, and 6 that occurred during the first period can be described by means of the fracture mechanics model used to predict the reliability indicators for systems having a large number of components of the same type [3]. The statistical model of failures is constructed for a heat exchanger containing a large number of tubes. It is assumed that the blanking of faulty tubes does not affect the operating conditions of the remaining tubes of the heat-transfer surface. Such an assumption is valid for the case when the number of blanked tubes is small (up to 10%) and provided that these are distributed uniformly over the entire surface of the tube bundle. This will cause the velocity of water in the tubes to change only slightly. The critical state of the apparatus occurs when the number of failed tubes reaches the limiting value n∗ = 0.1N, where N is the total number of tubes. Let the probability of failure-free operation of a tube be P0(t) and the number of failed tubes be n(t). In this n PN
case, the probability (t) of the event that not more than n(t) of tubes of the total number N will have failed by the moment of time t can be approximately determined using the Bernoulli scheme [3] n
n
PN (t ) =
∑C
k N[1
– P0 ( t ) ] P0 k
N–k
( t ),
(1)
665
Data on the state of condenser tubes Operat- Num- Fracing ber of tion of Residual time, blanked blanked wall thickthou- tubes, tubes, ness, mm pcs. % sand h
No. of the condenser
Tube material
1
LMsh68-0.1
200
1100
6.0
0.43–0.49
2
LMsh68-0.1
194
304
1.6
0.43–0.46
3
L68
188
1018
5.2
0.25–0.30
4
L68
230
1103
6.0
0.52–0.56
MNZh5-1
0.79–0.84
5
MNZh5-1
173
660
3.4
0.88–0.92
6
MNZh5-1
169
245
1.3
0.75–0.84
The probability P0(t) is estimated proceeding from the fact that, according to the law of large numbers, the sampling frequency of an event in a large series of tests converges to the quantity [1 – P0(t)] n(t)/N = 1 – P0(t). (2) n/N, %
(a) No. 1
8
No. 3
6 4
No. 4
2 No. 2 0 (b)
8 6
No. 5
4
k=1
2
k
where C N = N!/[k!(N – k)!]. 1 It should be pointed out that, according to GOST (State Standard)
9.005-72, the use in STU heat exchangers of tubes made of different materials (brass and copper–nickel alloys) is not permitted; this is confirmed by the fact that the tubes used in the condenser of turbine No. 4 have a high failure rate as compared with that of the condenser of turbine No. 2 for a period of up to 200 000 h; see Fig. 1a. THERMAL ENGINEERING
Vol. 54
No. 8
2007
0 50
No. 6 100
150 200 250 Operating time, thousand h
Fig. 1. Fraction of blanked condenser tubes vs. operating time. (a) Turbines Nos. 1–4, (b) turbines Nos. 5 and 6, — —approximation of experimental data.
666
ARONSON et al.
A 1.0
Cu2O(red) L68
0.25
CuO(black)
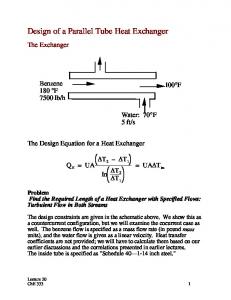
Fig. 2. Structure of the protrusion on a tube’s inner surface.
According to Moivre–Laplace’s central limiting theorem, the distribution function for the random variable n(t) determined by expression (2) can be approximated by the normal distribution [3, 10] ⎧ n ∗ – N [ 1 – P0 ( t ) ] ⎫ - ⎬, F ( t ) ≈ 1 – Φ ⎨ ----------------------------------------------(3) ⎩ N [ 1 – P 0 ( t ) ]P 0 ( t ) ⎭ where Φ is the normalized function of Gauss distribution. The model under consideration is typical for the period of normal operation, which is characterized by random causes of failures; up to 70% of them are due to corrosion of tubes and up to 30% are due to their vibration [4, 11, 12]. In addition, tubes may fail as a result of their being affected by components of the turbine flow path, which can enter into the condenser as a result of last-stage blades tearing off, rolled connections of tubes in tube sheets becoming loose, etc. The probability of failure can be described by an exponential law [10]; therefore, it is advisable that the data in Fig. 1b be approximated by curves of the form n(t)/N = a exp(bt), where a and b are coefficients. After that, we determine the expression for P0(t) from (2) and substitute it in (3). Calculations for the condenser of turbine No. 5 give F(t) = P[n(t) ≥ n∗] ≈ 0.92 for t ≥ 383000 h; that is, the probability that the number of blanked tubes n(t) will exceed the limiting number of tubes n∗ is equal to 92% for an operating time of more than 383000 h. This operating time can be taken as the service life of this condenser. A similar assessment of the service life for the condenser of turbine No. 6 is more than 500000 h. The statistical model (1)–(3) formulated above is valid at constant values of P0 [10]. The probability of tubes failing increases considerably and mass-scale failures of them are observed after the condenser has operated for 200 000 h (see Fig. 1a). A similar phenomenon was also pointed out in [8], in which the failure rate of brass tubes of the K-150-9115 condensers used in the 160-MW power units at the Tbilisi district power station was considered. Mass-scale failures of tubes were recorded after they had been in operation for 70000–75000 h [4, 13]. Such a short service life of these tubes was in all likelihood the result of improperly selected material. It is obvious that the change that occurred in the nature of failures of condensers with tubes made of brass alloys after they had operated for 200 000 h was due to a common cause. Therefore, the statistical model
C
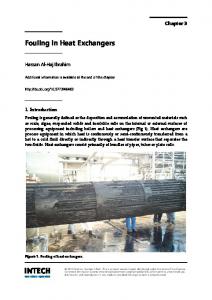
Fig. 3. Damaged part of a tube. C and A denote the cathode and anode sections.
of random failures that was described above cannot be used to predict the state of the apparatus. A further analysis of the susceptibility of condensers to failures could only be carried out based on the results from assessing the state of the metal of which the heat-transfer surface tubes were made. To do so, we examined samples of tubes taken from the condensers of turbines Nos. 1–6 (see table). The tubes were first cut along the generatrix and unfolded into flat pieces, which were then etched in solutions having different corrosiveness to remove the scale deposited on their surfaces. We also prepared microsections, which were cut in the form of rings and pressed into special plastic. Microdamages were also examined using an MMRU-4 microscope furnished with a micrometer attachment (magnification by a factor of 60). A comprehensive analysis of the state the surface of the sample tubes made of brass alloys had (the condensers of turbines Nos. 1–4) have shown them to suffer from uniform corrosion.2 The deposits we found on the outer and inner sides of the samples consisted mainly of brass corrosion products in the form of copper oxides CuO and Cu2O (Fig. 2). The scale we found on the water side consisted of 0.08- to 0.09-mm-thick oxidesalt deposits resulting from the composition of cooling water. We also found numerous protrusions there of various heights and diameters (0.01–0.10 mm), the composition of which was determined by an X-ray phase analysis. The data obtained from the above analysis, as well as the results of studies [14, 15], allow the following explanation to be given to the mechanism by which the protrusions emerge and evolve: (i) a particle sticks to the tube inner surface, which isolates the surface from water (this particle, which may be a suspended piece of peat, sand, bottom silt, etc., can be brought by the flow of circulating water); (ii) being nonuniformly aerated, the isolated part of the tube assumes a more positive (cathode) potential with respect to the main surface of metal, which is more electrically negative (anode) and corrodes more rapidly as a result of the voltaic couple that has appeared; and (iii) the difference between the corrosion rates of the main metal and the isolated cathode part causes a protrusion to emerge on the latter; this protrusion turbulizes the wall layer, leading to additional erosion wear of the tube surface (Fig. 3). 2 O.S. Anisimova
was the person who examined the tube samples.
THERMAL ENGINEERING
Vol. 54
No. 8
2007
STATISTICAL SIMULATION OF FAILURES OF HEAT EXCHANGERS
As regards the tube system used in the condenser of turbine No. 3, in which the mechanism described above manifested itself most strikingly (the greatest number of protrusions was observed there), the residual thickness of the tube wall was minimal and equal to 0.25−0.30 mm (see table). All kinds of local damages were also observed on tube samples: pits, pitting damages, transcrystalline cracking, all revealed at a magnification of 30–60. The characteristic sizes of these damages are as follows: depth, 0.03–0.09 mm; and diameter, 0.08–0.12 mm. The residual thickness the walls of brass tubes had by the time the diagnostic examination was carried out was in the range 0.25–0.56 mm. It is important to note that none of the brass tube samples that were examined had damages (pits or cracks) the characteristic size of which would be commensurable with the residual wall thickness.3 Our calculations have demonstrated that the brass wall capable of withstanding the pressure difference that exists between the water and steam sides in condensers (0.15 MPa) should have a thickness of as small as 0.015-0.020 mm. However, analyzing repairs documents at TPSs we have found that mass-scale tube failures (a few hundred) are observed at a residual wall thickness of 0.4–0.5 mm during starting operations. It can be conjectured that the operations on starting and shutting down a power unit, during which high alternating loads occur in the metal of equipment, lead to deterioration of the rolled connections of tubes in the tube sheets of condensers. In our opinion, it is exactly this factor that is responsible for the mass-scale nature of tube failures. Thus, the phenomenon of condenser tubes exhausting their service life on a mass scale is determined by the following main factors: (i) a considerable degree of damage to the tubes (a small residual thickness of the walls); and (ii) an alternating nature and considerable growth of loads on the condenser tubes, the values of which exceed the bearing capacity (strength) of the tubes. The thinning of the walls of tubes made of brass alloys as a result of their loosing zinc is a gradual (cumulative) process during which damages are accumulated. The parameters that have to be specified to describe this process are the initial and residual (at the moment when the tube state is estimated) thicknesses δ0 and δ of the tube walls [4, 5]. If total thinning of the tube wall occurs as a result of a cumulative process, the degree of damage can be determined as follows: δ 0 – δ ( t )⎞ , ψ ( t ) = c ⎛ -------------------⎝ δ0 ⎠
(4)
3 The
nature of damages we found on the tubes made of MNZh5-1 copper-nickel alloy was the same as that on brass tubes; however, the residual wall thickness was equal to 0.75–0.92 mm. THERMAL ENGINEERING
Vol. 54
No. 8
2007
667
where c is a normalizing factor, the value of which is found from the conditions ψ ( 0 ) = 0;
ψ ( T s. 1 ) = 1,
(5)
where Ts.l is the service life. Given an initial tube wall thickness δ0 equal to 1 mm, the limiting thickness is taken to be δlim ≥ 0.4 mm, which is in line with the data of [8]. Then, the solution of (4) gives c = 1.0/0.6. A point that has to be made for substantiating the limiting wall thickness is that a rolled connection is a strong-and-tight joint made by using a special tool to create pressure that causes elastic and partially plastic deformations to occur in the tube and tube sheet. Once the pressure is released, the stresses that occurred in the tube and tube sheet relax so that the residual pressure that remains in the rolled connection ensures the required strength and tightness of the joint. If we have a rolled joint of metals, which is characterized by a typical combination of strength characteristics [a tube (brass)–a tube sheet (carbon steel)], the residual pressure is determined by the bearing capacity of tubes [16, 17] 2 P res = ------- δ y ln β, 3
(6)
where σy is the yield strength of the tube wall material, MPa, and β = dout/din (where dout and din are the outer and inner diameters of the tube). The residual pressure reduces by a factor of 2.6 as the tube wall thickness decreases from 1 to 0.4 mm. A rolled joint may also become less reliable as a result of a reduction in the residual stresses caused by a change in the structure of the metal of which the joint elements are made [7]. The extent of damage can be represented as a function of tube strength parameters r and load q. Since the function ψ(t) = f(r, q) obeys the rule of the linear summation of damages, expression (4) must satisfy the following condition [3]: ψ ( t ) = f 1 ( r ) f 2 ( q ).
(7)
Given the kind of damage being considered (the total thinning of a wall), the function f1(r), which takes into account the scatter of tube strength properties at the time its state is estimated, can be confined by the scatter in the initial tube wall thickness δ0. Such an assumption becomes more correct as the operating time of the condenser grows and as a considerable number of tubes (3−4%) fail, the strength indicators of which differ considerably from the average values for the tube bundle. Note that the factors causing damages to them are not connected with the overall thinning of tube walls. The tubes generally used in steam-turbine condensers have wall thickness δ0 = 1 mm (the tubes installed in the peripheral rows are sometimes made with δ0 = 2 mm). According to the GOST (State Standard) 21646–2003,
668
ARONSON et al.
the difference ∆δ by which the thickness of the walls of the nonferrous tubes installed in STU heat exchangers may deviate from its rated value must not exceed ±0.1 mm at δ0 = 1 mm. The difference by which the tube wall thickness deviates from its rated value is a random variable that obeys the normal distribution law [18]. The limiting value by which the initial tube wall thickness deviates from its nominal value is within the interval 3σδ [18] 2
(where σ δ is the wall thickness dispersion); this allows us to consider that the wall thickness going beyond the limits 0.9 mm ≤ δ ≤ 1.1 mm is an unlikely event. The method of conditional reliability functions [3] allows us to evaluate the deviations of the degree of damage and tube wall thickness from the rated values when the condenser reaches its limiting state (exhausts its service life). They were found to be ±0.1 and ±0.6 mm, respectively. Thus, if the tube sample taken for examination has an average residual wall thickness δ ≤ 0.46 mm, we can state with a confidence of 99.7% that the extent of damage to the condenser tubes is 90% or more, pointing to the need of replacing the tube bundle. The effect the load q has of the extent of tube damage ψ can be taken into account when estimating both the operational factors and the rate of wall thinning. In this case, from (4) and (7) we have δ ( v c )⎞ 1 ψ = ------- ⎛ 1 – ------------- f ( n , G … ), 0.6 ⎝ δ0 ⎠ 2 s s
(8)
where vc is the rate of corrosion, which depends on the composition and temperature of circulation water, as well as on the contamination of the tube surface (the difference in the quality of the metal of which the condenser tubes are made is taken into account when estimating the scatter of the initial wall thickness); ns is the number of turbine unit startups and shutdowns; and Gs is the flowrate of steam to the condenser, a factor that determines the mechanical and dynamic loads on the tubes during operation. The effect of load on the extent of damage can be estimated only qualitatively. For example, tests carried out under laboratory conditions have shown that the corrosion rate of L68 brass is a factor of 1.4–3.5 higher than that of MNZh5-1 copper–nickel alloy [4]. This is confirmed by the fact that the walls of condenser tubes have different thicknesses. The only way by which the extent of damage can be evaluated is to determine the state of tubes on a periodic basis; it is recommended that these examinations be carried out starting from the operating time at which the number of blanked tubes reaches 3.0–3.5% of the total number of tubes in the apparatus. If the extent of damage ψ ≈ 1, the remaining service life is evaluated using the statistical model (1)−(3). If δ ≤ 0.5 mm, the tubes in the condenser should be replaced; if δ > 0.5 mm, measures on checking (monitoring) their state should be planned.
The results we obtained from the above set of activities on studying the susceptibility of condensers to damages allowed their remaining service life to be predicted. According to our recommendations, replacements of tubes were included in the scope of the soonest overhauls to be carried on the condensers of turbines Nos. 1–4 (the tubes of which are made of brass alloys). It should be noted that mass-scale damages to tubes were observed for 1–2 years from the time the examination was carried out to the time the tube bundles were replaced. At present, the tubes in the condensers of turbines Nos. 1–3 have been replaced. The strategy of repairs to HPHs and, consequently, the methodology used to statistically simulate their failure rates differ considerably from those for condensers. It is assumed that repair of an HPH, including the diagnostics of the coils of its tube system, restores the apparatus service life completely. On the other hand, repairs of a condenser involve the blanking of faulty tubes, whereas the damages (manifested in a reduced wall thickness) in the remaining tubes build up, finally leading to mass-scale failures of the heat-transfer surface tubes. Below we consider the specific features pertinent to the statistical processing of data on the failure rates of HPHs, taking as an illustration 16 power units at the Surgut GRES-1 district power station equipped with K-200-130 and T-180/210-130 turbines manufactured by LMZ. These turbine units comprise the single-leg groups of HPH-5, -6, and -7, the heating surfaces of which are equal to 500, 700, and 775 m2, respectively; the periods of times for which they had been in operation differed from one another. HPH groups were replaced in some of these power units. HPHs will soon be also replaced in some other units, since defects have occurred in their headers, components that determine the service life of these apparatuses [4, 11, 17, 19, 20]. In order to assess failure rates, we analyzed repairs documents; this analysis has shown that the information on the repairs to the HPHs is quite complete.4 The following indicators were generalized: the operating time between repairs, the duration of repairs to HPHs (these two indicators were evaluated for scheduled and emergency repairs), and the number of coils replaced in each apparatus. In accordance with [19], activities regarded as repairs to an HPH are those comprising a set of the following works on removing defects, during which the shell has to be dismantled: (i) repairs to and replacement of coils; (ii) repairs to headers, diaphragms, plugs, and other components of the tube system; 4 We
are grateful to Surgut GRES-1 workers Yu.A. Golitsin and V.Yu. Pichugin for the help they offered us in arranging the collection and analysis of repair documents. We also thank A.S. Rudenko and T.V. Panova, who participated in the processing of data. THERMAL ENGINEERING
Vol. 54
No. 8
2007
(iii) restoration of the shell and housings; and (iv) rectification of leaky membrane seals. Work on rectifying other defects (e.g., ruptures of the feedwater pipeline, impulse and drain lines, and malfunctions of monitoring and measuring instruments and automatic control devices) causing emergency shutdowns of the HPH, but without the need of disassembling it, was not considered as repairs to the HPH proper. Such defects are regarded as those removable during repairs to the entire group of HPHs and are frequently recorded in the repairs documents. Special certificates are drawn in the course of these activities, which are subject to a separate account [20]. A total of 253 repairs to HPHs were carried out for the time the Surgut GRES-1 has been in operation, of which 131 were emergency repairs and 122 were scheduled repairs (Fig. 4). The number of replaced coils increased considerably in the period from 1988 to 1990. In all likelihood, this can be attributed to the increased wear of coils after the apparatuses had been in operation for 20 years and to the fact that they were changed to operate at lower velocities of feed water after retrofitting. The second peak of an increase in failure rates, which fell on 2000–2003, is explained, in our opinion, by the fact that the HPH tube system had worked through its resources (the service life is more than 30 years). The largest fraction of failed coils (of their total quantity in a particular zone or in the entire apparatus), the failures of which were observed in the HPH-5 and -6, was in the condensate cooling zone. In our opinion, this occurred due to the effect of the heating-steam condensate that was discharged into these HPHs from the heaters situated upstream of the feedwater path. The most problematic area we found in this respect in the HPH-7 was in the steam condensation zone (Fig. 5a). The most frequent failures of coils were observed in the HPH-7; this, in all likelihood, is because the steam in this heater has elevated parameters. The obtained information was processed using the parametric methods of reliability theory [21]. Data were subdivided into groups, and histograms belonging to the class of Weibull–Gnedenko’s distributions were constructed based on which we selected the distribution functions, which had the following form [21]: F ( t ) = 1 – exp ( –t /t 0 ). m
(9)
It has been established in the course of finding the function for the density of the distribution of the interval of time to HPH repairs that individual values of the distribution parameters m and t0 have to be selected for each apparatus. Figure 5b illustrates the nonuniformity of the statistical samples for the time to repairs for the HPH-5, -6, and -7. A check of the distributions obtained using Pearson’s goodness measure [10, 21] has shown satisfactory results (the power of this measure was around 0.3). THERMAL ENGINEERING
Vol. 54
No. 8
2007
Number of replaced coils, pcs.
STATISTICAL SIMULATION OF FAILURES OF HEAT EXCHANGERS
669
160 120 80 40 0 1978 1982 1986 1990 1994 1998 2002 Years
No. 7 No. 6 No. 5
Fig. 4. Retrospective of the number of coils replaced per annum.
Fraction, %
(a)
10
No. 5 No. 6 No. 7
(b)
5 0
CC
SC
SC
No. 5 No. 6 No. 7
Fig. 5. Number of the replaced coils of the HPHs at the Surgut GRES-1. Zones: CC—condensate cooler, SC—steam condensation, and SC—steam cooler.
f(t) 0.12 0.08 0.04 0
5
10 15 20 25 30 35 40 45 t, days
Fig. 6. Distribution density of HPH downtime during emergency repairs.
For further analysis, we found the parameters for the interval of time from the preceding repairs to an emergency failure or to a scheduled repair of an HPH. A similar procedure was used to process data on the duration of emergency and planned repairs to HPHs. The results from statistical processing of the HPH downtime during emergency repairs (Fig. 6) were compared with the data of a questionnaire session carried out by the Surgut GRES-1 personnel using the method of expert estimates [11, 12]. It has been found that the duration of emergency repairs to an HPH is around 3 days. The distribution density function f(t) for the downtime during emergency repairs to an HPH obtained from the results of statistical processing has the maximum value also at t = 3 days (see Fig. 6), which
670
ARONSON et al. λ2
λ1
S2
S1
S0 µ1
µ2
Fig. 7. Graph for the flow of HPH repairs.
points to good agreement between the data of statistical analysis and expert estimates. In order to describe the flow of HPH failures, we constructed a graph, in which S0 denotes the operable state; S1, emergency repairs; and S2, scheduled repairs (Fig. 7). Using the formalism of Kholmogorov–Chapman’s equations, we can construct the following system on the basis of this graph [21]: dP 0 ( 0 ) ----------------- = µ 1 ( t )P 1 ( t ) + µ 2 ( t )P 2 ( t ) dt – [ λ 1 ( t ) + λ 2 ( t ) ]P 0 ( t );
⎫ ⎪ ⎪ ⎪ ⎪ dP 1 ( 0 ) ⎬ ----------------- = λ 1 ( t )P 0 ( t ) – µ 1 ( t )P 1 ( t ); ⎪ dt ⎪ ⎪ dP 2 ( 0 ) ----------------- = λ 2 ( t )P 0 ( t ) – µ 2 ( t )P 2 ( t ). ⎪ dt ⎭
(10)
The rates of HPH failures λ and restorations µ were expressed from (10) as a functional time dependence of the form λ 1, 2 ( µ 1, 2 ) = at , b
(11)
where a and b are calculated parameters. System of equations (10) was solved numerically in the Mathcad environment. The results of its solution are shown in Fig. 8. The probability of damages to an HPH (Fig. 8a) is of most interest. This characteristic has the maximum at t ≈ 20 days; i.e., the maximum probability (a)
P(t)
2
0.02 0.01
1
0 (b) 0.02 0
100
200
300 t, days
Fig. 8. Probability of damages to HPHs. (a) Probability of repairs to HPHs, (1) emergency and (2) scheduled; (b) probability of an HPH being in inoperable state.
of an HPH emergency failure occurs in 20–25 days after the HPH was taken from repairs. The probability of HPH failure reduces if it has operated for more than 2 months after repairs. It can be conjectured that the failure rate of an HPH depends in many respects on the quality with which it was repaired. An analysis also allows the guarantee period for HPH repair service to be determined: it is equal to two months. In 35 days after restoration, the probability of scheduled repairs to the HPH becomes higher than that of emergency repairs (see Fig. 8a). The maximum probability of the HPH being in the inoperable state is equal to 0.04 (see Fig. 8b) and occurs in approximately 70 days after the HPH was taken from the last repairs. Hence, in settling matters that arise when a change is made to the policy of repairing STU heat exchangers based on their technical condition, it is necessary and possible to use information available at a TPS, as well as its statistical processing. The results we obtained from an analysis of the repairs documents on turbine condensers have shown that the susceptibility of condenser tubes to damages is characterized by two periods. Damages to condenser tubes that occur during the first period (t ≤ 200000 h) are caused by the combined effect of a number of random factors. The rate of tube failures is rather low, the number of failed tubes does not exceed 3–5% of their total number, and the duration of this period determines the service life of a condenser tube bundle. The second period (t > 200000 h) is characterized by a condenser having worked out its service life and by its tubes being blanked off in large (burstlike) quantities (several tens, or even hundreds, in one repair session). With tube walls becoming thinner throughout the entire bundle, the loss of their working capacity is caused by operations on starting up and shutting down power units, as well as by the fact that rolled joints through which the tubes are connected to the tube sheets become loose under the effect of considerable alternating loads that occur in the condensers. Statistical model (1)–(3) has been proposed for estimating the remaining service life of a condenser during the first period of failures. If we wish to determine the onset of the second period, the state of the tubes has to be estimated. The minimal residual tube wall thickness at which mass-scale failures may occur should be no less than 0.44 mm (with the initial thickness equal to 1 mm). In fact, the limiting state of tubes under the conditions of their total thinning is determined by the residual wall thickness δ ≈ 0.5 mm. A statistical analysis of the failure rates of HPSs allowed us to estimate the parameters characterizing the flow of apparatus failures. A model was proposed, using which we have determined the characteristics of HPR repair services that allow the scope of repairs to be determined and the time of doing them to be scheduled. The highest probability of an HPH failure falls on the 20th–25th day from the date the HPH was taken from THERMAL ENGINEERING
Vol. 54
No. 8
2007
STATISTICAL SIMULATION OF FAILURES OF HEAT EXCHANGERS
the last repair. Obviously, such failures depend in many respects on the quality of repairs. The fraction of such failures is small: around 4% of the total number of HPH repairs. In order to enhance the responsibility of agencies in charge for carrying out repairs to HPHs, it is recommended to establish the guarantee period for HPH repair service equal to 2–2.5 months. There is a need to create a bank of data on various damages to and failures of (corrosion damages, vibration damages, etc.) STU heat-exchange equipment used under different operating conditions. This will make it possible to check and, if necessary, to determine more exactly the possibility of using the proposed statistical models for other types of heat exchangers. REFERENCES 1. A. V. Andryushin and E. Yu. Shnyrov, “Using the Philosophy of Project Management to Develop a System for Arranging Repairs to Power-Generating Equipment,” Teploenergetika, No. 10, 17–21 (2004) [Therm. Eng., (51) No. 10, 788–792 (2004)]. 2. A. V. Andryushin, “Fundamentals for Developing an Automated Control System for Doing Repairs Works” Teploenergetika, No. 10, 53–57 (2001) [Therm. Eng., (48) No. 10, 846–830 (2001)]. 3. V. V. Bolotin, Predicting the Service Life of Machines and Constructions (Mashinostroenie, Moscow, 1984) [in Russian]. 4. Improving the Efficiency and Reliability of the Heat Exchangers of Steam-Turbine Units, a revised and extended 3rd edition, Ed. by Yu. M. Brodov (GOU VPO UGTU-UPI, Yekaterinburg, 2004) [in Russian]. 5. K. E. Aronson, N. N. Akif’eva, Yu. M. Brodov, et al., “The Concept of a Comprehensive System for Monitoring the State of Power Unit Equipment,” Teploenergetika, No. 2, 47–53 (2002) [Therm. Eng., (49) No. 2, 137– 142 (2002)]. 6. V. I. Nikitin, Corrosion Damages to Steam-Turbine Condensers and Determining of the Residuals Life of Their Tube System,” Teploenergetika, No. 11, 41–45 (2001) [Therm. Eng., (48) No. 11, 923–927(2001)]. 7. R. S. Reznikova, E. I. Benenson, and Yu. M. Brodov, “Determination of the Optimum Times for Replacing the Tube Bundles of the Heat Exchangers Used in Turbine Units,” Teploenergetika, No. 2, 37–40 (1985) [Therm. Eng., No. 2 (1985)]. 8. Yu. A. Tsagareli, “Predicting the Service Life of a Condenser Tube Bundle during Operation,” Elektr. Stn., No. 8, 21–26 (1992).
THERMAL ENGINEERING
Vol. 54
No. 8
2007
671
9. G. P. Gladyshev, V. I. Gorin, and V. E. Dobrovil’skii, “Investigating the Reliability of High-Pressure Heaters after They Have Been in Operation for a Long Time,” Teploenergetika, No. 12, 22–27 (1990) [Therm. Eng., No. 12 (1990)]. 10. B. V. Gnedenko, A Course of Probability Theory (Nauka, Moscow, 1998) [in Russian]. 11. Yu. M. Brodov, R. S. Reznikova, G. I. Krasnova, and A. I. Chaika, “An Analysis of the Indicators Characterizing the Reliability of the Heat Exchangers Used in Turbine Units at Thermal Power Stations,” Energomashinostroenie, No. 11, 35–39 (1982). 12. P. N. Plotnikov, Yu. M. Brodov, V. K. Kuptsov, and A. S. Rudenko, “The Reliability of the Heat Exchangers Used in Steam Turbine Units Taking Technological and Operational Factors into Account,” Tyazh. Masninostr., No. 2, 38-40 (2002). 13. K. E. Aronson, S. N. Blinkov, V. I. Brezgin, et al., Heat Exchangers for Power Installations: A Handbook for Higher Schools, Ed. by Yu. M. Brodov (SOKRAT, Yekaterinburg, 2003) [in Russian]. 14. P. A. Akol’zin, Corrosion and Protection of the Metal of Thermal Power Equipment (Energoatomizdat, Moscow, 1982) [in Russian]. 15. Kh. Rachev and S. Stefanova, A Handbook on Corrosion (Mir, Moscow, 1982) [in Russian]. 16. G. P. Tkachenko and V. M. Breger, Fabrication of and Repairs to Shell-and-Tube Heat Exchangers (Nauka, Moscow, 1980) [in Russian]. 17. Maintenance and Repairs of Heat Exchangers for Steam Turbine Units: A Handbook, Ed. by Yu. M. Brodov (GOU VPO UGTU-UPI, Yekaterinburg, 2005) [in Russian]. 18. M. F. Stoletnii and E. D. Klempert, Accuracy of Tubes (Metallurgiya, Moscow, 1975) [in Russian]. 19. TU (Specifications) 34-38-20092-94: High-Pressure Surface-Type Heaters for the Regeneration Systems of Steam Turbines. Specifications for Overhaul (TsKB Energoremont, Moscow, 1994) [in Russian]. 20. A Regulation for Investigating and Accounting Technological Abnormalities in the Operation of Power Systems, Power Stations, Boiler Houses, and Electric and Heating Networks (Energoservis, Moscow, 2001) [in Russian]. 21. B. V. Gnedenko, Yu. K. Belyaev, and A. Yu. Solov’ev, Mathematical Methods in Reliability Theory (Nauka, Moscow, 1965) [in Russian].