M u s c u l o s k e l e t a l I m a g i n g • Te c h n i c a l I n n ov a t i o n Ulbrich et al. Artifact Reduction in MRI
Downloaded from www.ajronline.org by Hauptbibliothek Universitaet on 07/25/14 from IP address 144.200.17.40. Copyright ARRS. For personal use only; all rights reserved
Musculoskeletal Imaging Technical Innovation
STIR Sequence With Increased Receiver Bandwidth of the Inversion Pulse for Reduction of Metallic Artifacts Erika J. Ulbrich1,2 Reto Sutter 1 Ranieri F. Aguiar 3 Mathias Nittka4 Christian W. Pfirrmann1 Ulbrich EJ, Sutter R, Aguiar RF, Nittka M, Pfirrmann CW
Keywords: high bandwidth, metal artifact reduction, MRI, STIR DOI:10.2214/AJR.11.8233 Received November 16, 2011; accepted after revision March 29, 2012. 1 Department of Radiology, Orthopedic University Hospital Balgrist, Zurich, Switzerland. 2
Present address: Department of Radiology, University Hospital, Rämistrasse 100, 8091 Zurich, Switzerland. Address correspondence to E. J. Ulbrich (
[email protected]).
3 Department of Radiology, Universidade Federal de Sao Paulo, Brazil. 4
Siemens AG, Healthcare Sector, Erlangen, Germany.
WEB This is a Web exclusive article. AJR 2012; 199:W735–W742 0361–803X/12/1996–W735 © American Roentgen Ray Society
OBJECTIVE. The purpose of this study was to evaluate a STIR sequence with an optimized inversion pulse that entails use of increased receiver bandwidth for metal artifact reduction. CONCLUSION. Image distortion, artifacts, insufficient fat suppression, and detection of relevant findings improved with the STIR optimized inversion pulse, which was associated with significant artifact reduction.
I
maging of orthopedic hardware with MRI has improved, but artifacts still influence image quality and image interpretation substantially. Areas close to orthopedic hardware are not clearly visible. The diagnosis of prosthesis loosening and infection remains difficult or impossible [1] because of geometric distortion, spatial blurring, and noise. The extent of artifacts depends on the implant size [2] and the material of the prosthesis. The greatest extent of artifacts is caused by ferromagnetic metals (iron, nickel, and cobalt), followed by superparamagnetic metals and paramagnetic metals such as titanium [3–5]. Geometric distortion is caused by local changes in the magnetic field induced by metal objects, the magnetic susceptibility of which is different from that of the surrounding tissue. This phenomenon interferes with imaging gradients for frequency encoding and slice selection. The result is substantial shifting of image pixels in the readout direction [5]. Spatial blurring denotes a loss of image detail (loss of sharpness). This effect can be observed in regions where the aforementioned pixel distortions impair the resolution of the image. Noise is the statistical variation in signal intensity in an image and leads to undesirable background interference and disturbance that affect image quality. Assessment of edema and fluid collections in bone marrow and soft tissues with fluid-sensitive sequences with fat suppression is often impaired by artifacts from the implants. A robust fluid-sensitive sequence that is insensitive to metallic artifacts would be valuable in daily
clinical practice. The STIR sequence is effective for suppression of fat signal and is less dependent than other sequences on homogeneity of the main magnetic field [6]. However, STIR images can show low-signal-intensity banding artifacts and high-signal-intensity areas without proper fat suppression around orthopedic hardware. STIR-based fat suppression applies a slice-selective inversion radiofrequency [2] pulse to each slice approximately 150 milliseconds (a typical value at a field strength of 1.5 T) before application of the excitation radiofrequency pulse of the spin-echo acquisition. Both the inverted and the excited slice profiles are subject to geometric distortion due to local changes of the static magnetic field. If the inversion and the excitation radiofrequency pulses have different bandwidths, they will show different spatial distortion levels. Consequently, the excited slice may no longer be inverted, and moreover, the displaced inversion pulse may suppress signal in other slices. On the images, this effect produces regions of severely changed contrast around metallic hardware that is manifested by either high signal intensity due to partial suppression effects or no inversion or by low signal intensity due to suppression effects. Standard STIR sequences entail use of an inversion radiofrequency pulse with reduced bandwidth. In patients without implants, the bandwidth difference does not cause the aforementioned artifacts, but it is beneficial in terms of reducing the energy deposition in the patient (specific absorption rate). The STIR optimized inversion pulse sequence matches the bandwidth of the inversion radiofrequency pulse to
AJR:199, December 2012 W735
Downloaded from www.ajronline.org by Hauptbibliothek Universitaet on 07/25/14 from IP address 144.200.17.40. Copyright ARRS. For personal use only; all rights reserved
Ulbrich et al.
A
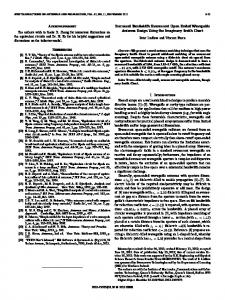
B Fig. 1—68-year-old man after hip arthroplasty. Examples of artifacts. A, Distortion. Rim of prosthesis (arrows) is much better demarcated on STIR optimized inversion pulse image (right) than on STIR image (left). B, Blurring. Loss of image detail of all structures is greater on STIR image (left) than on STIR optimized inversion pulse image (right). C, Noise. Undesirable background interference, especially in air (asterisk), is similar on STIR (left) and STIR optimized inversion pulse (right) images.
C the bandwidth of the excitation radiofrequency pulse, resulting in robust STIR contrast even for strong local magnetic field offsets (Fig. 1). The increased energy deposition of the increasedbandwidth inversion pulse usually has no noticeable effect on the specific absorption rate level. STIR imaging optimized for metal implants usually entails relatively long echo trains to increase the scan time efficiency, so the energy of the inversion pulses plays a minor role compared with that of the large number of refocusing radiofrequency pulses. An MRI STIR sequence has been developed that features an optimized inversion pulse that entails increased receiver bandwidth for reduction of metal artifacts. The STIR optimized inversion pulse sequence matches the bandwidth of the inversion radiofrequency pulse to the bandwidth of the excitation radiofrequency pulse, resulting in robust STIR contrast even for strong local magnetic field offsets. The aim of this study was to evaluate whether use of this sequence reduces artifacts in the presence of strong local susceptibility changes near metal implants. Subjects and Methods Subjects We included 50 patients with metallic implants: 28 with hip implants (mean age, 65.0 years; range, 33.3–84.9 years), eight with knee implants (mean
W736
age, 52.7 years; range 32.8–63.5 years), and 14 with spinal implants (mean age, 59.7 years; range, 38.9– 80.9 years). Patients were included consecutively during the period October 2010 to February 2011. Images of 14 right and 14 left hips were acquired. Twenty-seven patients had undergone total hip arthroplasty, and one patient had undergone implantation of an intramedullary rod in the femur. Five right and three left knees were imaged. Three patients had undergone total knee arthroplasty, one patient had undergone medial hemiarthroplasty, one patient had femoral screws, one patient had undergone femoral corrective osteotomy, and two patients had undergone tibial corrective osteotomy. Of 14 lumbar spines imaged, one included the thoracic spine. Three patients had undergone spinal fusion of two segments, six patients of three segments, three patients of four segments, one patient of six segments, and one patient (thoracolumbar spine) of 13 segments. In many cases the composition of the metallic implants was mostly unknown because the operations had been performed at a hospital other than ours. In 10 of 28 hip arthropathies, the material was known: In eight cases a mixture of titanium and polyethylene was used, and in two cases, cobalt chrome was used. The composition of the material in the knee arthropathies was unknown. In the cases in which the composition of spinal screws was noted, titanium had been used. Before the imaging examination, all patients in this study gave written permission for anonymous
use of their medical data for scientific purposes. The study was submitted to the institutional review board, and a waiver was issued for this study.
MRI Acquisition MRI was performed with a 1.5-T system (Magnetom Avanto, Syngo version MR B17, Siemens Healthcare). All examinations were performed with a standard STIR sequence and a STIR optimized inversion pulse sequence. The two sequences differed only in the bandwidth of the inversion radiofrequency pulse. The STIR optimized inversion pulse sequence had an increased inversion recovery pulse bandwidth of 1.6 kHz, matching the bandwidth of the spin-echo excitation radiofrequency pulse. The two sequences were otherwise set up with identical parameters optimized for implant imaging, particularly with high readout bandwidth and a high bandwidth excitation radiofrequency pulse (1.6 kHz). The frequency-encoding direction was oriented along the long axis of the femur, the knee, and the spine. The following sequences for hip, knee, and spinal MRI were performed. Hip—The parameters for the transverse STIR and STIR optimized inversion pulse sequences for MRI of the hip were as follows: TR/TE, 5010/35; section thickness, 7 mm; voxel size, 0.7 × 0.7 × 0.7; refocusing flip angle, 150°; FOV, 18 × 18 cm; matrix, 256 × 256; number of signals acquired, 2. The excitation bandwidth for the STIR sequence was 0.6 kHz and for the STIR optimized inver-
AJR:199, December 2012
Downloaded from www.ajronline.org by Hauptbibliothek Universitaet on 07/25/14 from IP address 144.200.17.40. Copyright ARRS. For personal use only; all rights reserved
Artifact Reduction in MRI sion pulse was 1.6 kHz. The readout bandwidth was 399 Hz/pixel; echo spacing, 5.88 milliseconds; echo-train length, 17; number of slices, 19; acquisition time, 3.37 milliseconds. Knee—The parameters for the coronal STIR and STIR optimized inversion pulse sequences for MRI of the knee were as follows: TR/TE, 5680/47; section thickness, 3 mm; voxel size, 0.7 × 0.3 × 3; refocusing flip angle, 150°; FOV, 17 × 13.8 cm; matrix, 512 × 256; number of signals acquired, 2. The excitation bandwidth for the STIR sequence was 0.6 kHz and for the STIR optimized inversion pulse was 1.6 kHz. The readout bandwidth was 391 Hz/pixel; echo spacing, 7.88 milliseconds; echotrain length, 17; number of slices, 19; acquisition time, 3.43 milliseconds. Spine—The parameters for the sagittal STIR and STIR optimized inversion pulse sequences for MRI of the spine were as follows: TR/TE, 3800/74; section thickness, 4 mm; voxel size, 1.2 × 1.2 × 4; refocusing flip angle, 150°; FOV, 30 × 30 cm; matrix, 256 × 256; number of signals acquired, 2. The excitation bandwidth for the STIR was 0.6 kHz and for the STIR optimized inversion pulse sequence was 1.6 kHz. The readout band-
width was 383 Hz/pixel; echo spacing, 8.18 milliseconds; echo-train length, 17; number of slices, 12; acquisition time, 3.53 milliseconds.
Qualitative Image Analysis In the qualitative analysis, two fellowship-trained musculoskeletal radiologists independently compared the standard STIR images and the STIR optimized inversion pulse images for metal artifacts (distortion, spatial blurring, noise). Differentiation of defined anatomic structures for each region was scored on a 5-point scale, and the number of clinical findings was noted. In a training session before reading the images, the two observers used nonstudy case material and consensus discussion to determine the 5-point scale. Image review was performed in chronologic order of MRI dates in three reading sessions (hip, knee, spine). The observers were blinded to clinical history and diagnosis. The 5-point scale for distortion artifacts and spatial blurring and noise was as follows: 1, no artifact; 2, hardly visible artifacts; 3, visible artifacts without impairment of diagnostic quality; 4, moderate artifacts with moderate impairment of diagnostic quality; 5, se-
vere artifacts, image not diagnostic. The 5-point scale for anatomic structures was 1, good delineation of anatomic structure; 2, anatomic structure fully visible with slight blurring of borders; 3, anatomic structure fully visible but significant blurring of borders; 4, anatomic structure only partially visible; 5, anatomic structure not visible. The following anatomic details in the hip were reviewed: in the lateral aspect, tendon attachments of gluteus minimus and medius tendon; in the anterior aspect, iliopsoas tendon and hip joint capsule; and in the posterior aspect, the external rotators. In the knee, the medial and lateral collateral ligaments, head of the fibula, menisci, and anterior and posterior cruciate ligaments (in patients who had not undergone total knee arthroplasty) were evaluated. In the spine, the spinal cord, bony borders (posterior wall of the vertebral body), intervertebral disks (segment adjacent to spinal fusion), and intervertebral foramen (segment between screws) were reviewed. Clinically relevant findings recorded for hip were joint effusion, bursitis, bone marrow edema, scar and muscle edema, seroma, psoas irritation, gluteus tendon tears, vastus lateralis transfer, flu-
TABLE 1: Image Quality Scores STIR Artifact
STIR Optimized Inversion Pulse
Observer
Median
25th–75th Percentile
Mean
Median
25th–75th Percentile
Mean
p
1
5
5–5
4.86
3
3–4
3.21
< 0.0001
2
5
5–5
4.86
3
3–4
3.21
< 0.0001
1
4
4–5
4.61
2
2–3
2.36
< 0.0001
2
4
4–5
4.61
2
2–3
2.36
< 0.0001
1
2
2–3
2.36
2
2–2.75
2.21
0.206
2
2
2–3
2.43
2
2–2.75
2.21
0.083
Hip Distortion Blurring Noise Knee Distortion Blurring Noise
1
5
4.25–5
4.75
2
2–2.75
2.25
0.01
2
5
4–5
4.63
2
2–2.75
2.25
0.009
1
2.5
2–4
2.88
2
2–2
1.88
0.038
2
2.5
2–4
2.88
2
2–2
1.88
0.038
1
2
2–2.75
2.38
3
2.25–3
2.88
0.102
2
2
2–2.75
2.38
3
2.25–3
2.88
0.102
Spine Distortion Blurring Noise
1
3
3–3
3.07
2
2–3
2.43
0.21
2
3
3–4
3.43
2
2–3
2.43
0.002
1
2
1–3
2.00
1
1–2
1.36
0.024
2
1.5
1–3
1.86
1
1–2
1.29
0.038
1
1
1–2
1.57
1
1–2
1.43
0.414
2
2
1–2
1.71
2
1–2
1.71
1
Note—Interobserver agreement assessed with Spearman rank correlation coefficient. p < 0.05 denotes statistical significance.
AJR:199, December 2012 W737
Downloaded from www.ajronline.org by Hauptbibliothek Universitaet on 07/25/14 from IP address 144.200.17.40. Copyright ARRS. For personal use only; all rights reserved
Ulbrich et al. id around orthopedic hardware, and joint ganglion. Findings recorded for the knee were joint effusion, bone bruise, insertion cyst of the anterior cruciate ligament, and missing meniscus. Findings for the spine were paraspinal edema, Modic type 1 changes, vertebral fracture, bone marrow edema, paravertebral or extradural seroma, and dural defect.
Quantitative Analysis A third radiologist measured the areas of altered signal intensity caused by the metal (signal void) and the area of insufficient fat suppression at several levels (knee and spine, two levels;
hip, three levels) on images obtained with both sequences at the same table position. The area of signal void size was defined as the area where no anatomic structures could be distinguished, including both low-signal-intensity and high-signalintensity artifacts. In the hip (three levels, measured on transverse images), the following structures were measured: head of the prosthesis at the level of greatest extent, including artifacts at the level of greatest extent; shaft of the prosthesis at the level of the femoral neck, including artifacts at the level of greatest extent; and shaft of prosthesis at the level of the femo-
ral shaft, including artifacts at the level of greatest extent. In the knee (two levels, measured on coronal images), the prosthesis at the level of greatest extent of the femoral condyles and the prosthesis at the level of greatest extent of the tibial shaft were measured. In the spine (two levels, measured on sagittal images), the pedicle screw at the level of greatest extent and the vertical rod at the level of greatest extent were measured. The area of insufficient fat suppression was defined as the area where possible edema in bone or soft tissue would not be detected owing to insufficient fat suppression. The area was measured at the level of greatest extent.
TABLE 2: Distinction of Anatomic Details STIR Structure
STIR Optimized Inversion Pulse
Observer
Median
25th–75th Percentile
Mean
Median
25th–75th Percentile
Mean
p
1
5
5–5
4.82
2
1–3
2.25
< 0.0001
2
5
5–5
4.82
2
1–3
2.25
< 0.0001
1
5
4–5
4.61
1
1–3
1.96
< 0.0001
2
5
4–5
4.61
1
1–3
1.96
< 0.0001 < 0.0001
Hip Gluteus minimus Gluteus medius Anterior neck of prothesis Posterior neck of prosthesis
1
5
5–5
4.79
3
3–3.75
3.14
2
5
5–5
4.79
3
3–4
3.21
< 0.0001
1
5
5–5
4.82
3
2–3.75
3.04
< 0.0001
2
5
5–5
4.79
3
2.25–3.75
3.07
< 0.0001
1
4
2.75–5
3.83
3
1–4.25
2.83
0.084
2
4
2.75–5
3.83
3
1–4.25
2.83
0.084
1
4
3–5
4
2
1–4
2.57
0.023
2
4
3–5
4
2
1–4
2.57
0.023
1
3
2–4
3.29
2
1–3
2.14
0.2
2
3
2–4
3.29
2
1–3
2.14
0.2
1
4
3–3.75
4
1.5
0.75–1.75
1.5
0.18
Knee Medial collateral ligament Lateral collateral ligament Head of fibula Meniscus
2
4
3–3.75
4
1.5
0.75–1.75
1.5
0.18
Anterior cruciate ligament
1
5
3–5
4.33
1
1–2
1.33
0.109
2
5
3–5
4.33
1
1–2
1.33
0.109
Posterior cruciate ligament
1
2
2–5
3
1
1–1
1
0.102
2
2
2–5
3
1
1–1
1
0.102
1
2
1–3.25
2.21
1
1–2
1.64
0.023
2
2
1–3.25
2.21
1
1–1
1.5
0.026
1
1.5
1–3.25
2.07
1
1–2
1.43
0.024
Spine Spinal cord Bony borders Disk Intervertebral foramen
2
1.5
1–3.25
2.14
1
1–2
1.43
0.026
1
2.5
2–3.25
2.79
2
1–2
1.79
0.001
2
3
2–3.25
3
2
1–2
1.79
0.001
1
4
3–4
3.5
2
2–3
2.57
0.004
2
4
3–5
3.71
2.5
2–3.25
2.79
0.004
Note—p < 0.05 denotes statistical significance.
W738
AJR:199, December 2012
Artifact Reduction in MRI
Downloaded from www.ajronline.org by Hauptbibliothek Universitaet on 07/25/14 from IP address 144.200.17.40. Copyright ARRS. For personal use only; all rights reserved
Statistical Analysis A software package (SPSS 17.0 for Microsoft Windows, SPSS) was used for all statistical analysis. Values were expressed as mean, SD, minimum and maximum, median, and 25th and 75th percentiles. The Wilcoxon signed rank test was used to compare the data on the standard STIR and STIR optimized inversion pulse MR images for each observer. A probability for an alpha error p < 0.05 was considered sufficient to reject the null hypothesis of no difference between standard STIR and STIR optimized inversion pulse images. Agreement between the two readers was determined by calculation of kappa values. A kappa value of 0 indicated poor agreement; 0.01–0.20, slight agreement; 0.21–0.40, fair agreement; 0.41–0.60, moderate agreement; 0.61–0.80, good agreement; and 0.81–1.00, excellent agreement.
Results Qualitative Analysis Image quality—Image distortion and image blurring were significantly less pronounced with the STIR optimized inversion pulse sequence for both observers (Table 1 and Fig. 1). For MRI of the hip, the median distortion rating was 5 on the STIR images and 3 on STIR optimized inversion pulse images (both observers, p < 0.0001). For the knee the scores were 5 and 2 (observer 1, p = 0.01; observer 2, p = 0.009). For the spine, the scores were 3 and 2 (observer 1, p = 0.21; observer 2, p = 0.002). Blurring was rated 4 and 2 for the hip (both observers, p < 0.0001), 2.5 and 2 for the knee (p = 0.038), and 2 and 1 for the spine (p = 0.024) by observer 1 and
1.5 and 1 for the spine (p = 0.038) by observer 2. Noise was rated about the same for the hip and the spine in both sequences. At the knee, noise was slightly worse for the STIR optimized inversion pulse than the standard STIR sequence. Noise was rated 2 and 2 for the hip (observer 1, p = 0.206; observer 2, p = 0.083), 2 and 3 for the knee (both observers, p = 0.102), and 1 and 1 for the spine by observer 1 (p = 0.414) and 2 and 2 for the spine by observer 2 (p = 1). Distinction of anatomic details—Anatomic distinction in the hips was significantly improved with the STIR optimized inversion pulse (Table 2). Distinction of the gluteus minimus tendon had a median rating of 5 (anatomic structure not visible) on the STIR images and 2 (anatomic structure fully visible with slight blurring of borders) on the STIR optimized inversion pulse (p < 0.0001). For the gluteus medius tendon, the scores were 5 and 1 (p < 0.0001); anterior femoral neck, 5 and 3 (p < 0.0001); and posterior femoral neck, 5 and 3 (p < 0.0001). There was improvement in distinction of anatomic structures in the knees. The median ratings of distinction of the medial collateral ligament were 4 and 3 (p = 0.084); of the lateral collateral ligament, 4 and 2 (p = 0.023); of the head of the fibula, 3 and 2 (p = 0.2); of the meniscus, 4 and 1.5 (p = 0.18); of the anterior cruciate ligament, 5 and 1 (p = 0.109); and of the posterior cruciate ligament, 2 and 1 (p = 0.102). Improvement in anatomic distinction in the spine was observed mostly at the neural foramen. The median ratings of distinc-
tion of the spinal cord were 2 and 1 (observer 1, p = 0.023; observer 2, p = 0.026); of the bony borders, 1.5 and 1 (observer 1, p = 0.024; observer 2, p = 0.026); of the disks, 2.5 and 2 by observer 1 and 3 and 2 by observer 2) (p = 0.001); and of the neural foramen, 4 and 2 by observer 1 and 4 and 2.5 by observer 2 (p = 0.004). Interobserver agreement—Interobserver agree ment on image quality was excellent for STIR (қ = 0.96) and for STIR optimized inversion pulse (қ = 0.96) imaging of the hips, excellent for STIR (қ = 0.97) and STIR optimized inversion pulse (қ = 1.0) imaging of the knees, and moderate for STIR (қ = 0.50) and good for STIR optimized inversion pulse (қ = 0.69) imaging of the spine. Interobserver agreement for distinction of anatomic details was excellent for STIR (қ = 0.97) and STIR optimized inversion pulse (қ = 0.93) imaging of the hips, excellent for STIR (қ = 1.0) and STIR optimized inversion pulse (қ = 1.0) imaging of the knees, and good for STIR (қ = 0.68) and STIR optimized inversion pulse (қ = 0.62) imaging of the spine. Quantitative Analysis The results of quantitative analysis are shown in Table 3 and Figure 2. The median area of signal void in hips measured 39.35 cm2 on STIR images and 25.3 cm2 on STIR optimized inversion pulse images for the head of the prosthesis, 41.1 and 12.35 cm2 for the neck of the prosthesis, and 4.75 and 3.8 cm2 for the shaft of the prosthesis. The area of signal void in knees measured 56.05 and 33.5 cm2 for the femoral component of the prosthesis and 30.6
TABLE 3: Extent of Artifacts STIR Artifact
STIR Optimized Inversion Pulse
Median
25th–75th Percentile
Mean
Median
25th–75th Percentile
Mean
p
39.35
28.675–62.975
47.979
25.3
17.2–29.7
25.23
< 0.0001 < 0.0001
Hip Head signal void Neck signal void
41.1
35.475–52.7
45.596
12.35
8.925–23.175
17.907
Shaft signal void
4.75
1.975–18.75
13.707
3.8
1.875–6.725
6.536
< 0.0001
Insufficient fat suppression
85.8
0–129
80.05
0
0–0
0.95
< 0.0001
56.05
26.88–91.38
57.53
33.5
9.88–51.25
31.58
0.028
Knee Femoral signal void Tibial signal void
30.6
22.2–50.4
35.63
26.55
9.67–30.23
21.94
0.028
Insufficient fat suppression
17.45
0.825–63.7
34.275
0
0
0
0.018
44.4
21.975–74.868
52.078
30.55
16.85–44.315
36.224
0.001
45.495
31.175–63.175
48.864
29.8
23.45–48.375
38.949
0.001
0
0
0
0
0
0
Spine Pedicle signal void Rod signal void Insufficient fat suppression
1
Note—Ratings by observers 1 and 2. p < 0.05 denotes statistical significance.
AJR:199, December 2012 W739
Downloaded from www.ajronline.org by Hauptbibliothek Universitaet on 07/25/14 from IP address 144.200.17.40. Copyright ARRS. For personal use only; all rights reserved
Ulbrich et al.
A
B
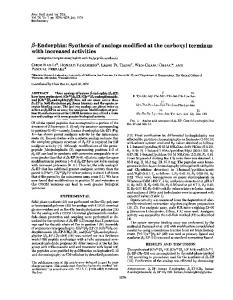
Fig. 2—Extent of artifacts (signal void). A, 59-year-old man after knee arthroplasty. Area of signal void in femoral condyles of knee is much larger (5744 mm2) on STIR image (left) than on STIR optimized inversion pulse image (3242 mm2) (right). B, 76-year-old woman after hip arthroplasty. STIR image (left) shows almost completely insufficient fat suppression. STIR optimized inversion pulse image shows normal fat suppression.
TABLE 4: Clinical Findings No. of Findings Finding
STIR
STIR Optimized Inversion Pulse
Joint effusion
2
12
Gluteus minimus tear
0
9
Hip
Gluteus medius tear
0
10
Vastus lateralis transfer
0
3
Bursitis
4
5
Psoas irritation
0
1
Adverse synovial response with debris around prosthesis
0
2 1
Joint ganglion
1
Scar edema
2
3
Seroma
2
3
Muscle edema Subtotal
5
6
16
55
Knee Effusion
5
5
Bone bruise
1
1
Insertion cyst of anterior cruciate ligament
1
1
Missing meniscus
1
1
Subtotal
8
8
Paraspinal edema
11
11
Modic I changes
4
4
Vertebral fracture
1
1
Bone marrow edema
1
1
Paravertebral seroma
1
1
Extradural seroma
1
1
Spine
Dural defect Subtotal
1
1
20
20
Note—Absolute numbers for the standard STIR and STIR optimized inversion pulse sequences summarized for all hips, all knees, and all spines.
W740
and 26.55 cm2 for the tibial component of the prosthesis. The area of signal void in the spines measured 44.4 and 30.55 cm2 for the pedicles and 45.5 and 29.8 cm2 for the rods. There was no area of insufficient fat suppression on the STIR optimized inversion pulse (0 cm2) images in any region. There were, however, large areas of insufficient fat suppression on the STIR images of the hips (85.8 cm2) and knees (17.45 cm2). In the spine, there was no area of insufficient fat suppression in either sequence. Relevant Clinical Findings Several clinically relevant findings (Table 4 and Fig. 3) (joint effusion, gluteal tendon tear, periprosthetic adverse synovial response with debris, seroma, scar edema) were visible only on images acquired with the STIR optimized inversion pulse. For all hips, both observers noted 55 clinical findings on the STIR optimized inversion pulse images but 16 on the STIR images. There was no improvement in the number of visible clinical findings for the knees or spine (eight in knees, 20 in spines), but in all patients the conspicuity of clinical findings was better with the STIR optimized inversion pulse than with the STIR sequence. Discussion Metal-induced artifacts, such as distortion, signal voids, and pile-up artifacts, often render MRI nondiagnostic. These artifacts exist in both the in-plane and through-slice directions and result from severe static magnetic field inhomogeneities near metal caused by a susceptibility difference between tissue and metal. Among the commonly implanted metal types, titanium has the lowest magnetic susceptibility [7], resulting in much lower artifact levels, than, for example, cobalt-chromium alloys
AJR:199, December 2012
Downloaded from www.ajronline.org by Hauptbibliothek Universitaet on 07/25/14 from IP address 144.200.17.40. Copyright ARRS. For personal use only; all rights reserved
Artifact Reduction in MRI
A
B
Fig. 3—Clinical findings in two patients after hip arthroplasty. A, 58-year-old woman with joint effusion in hip after arthroplasty. Joint effusion (arrows) is not well demarcated on STIR image (left) but is evident on STIR optimized inversion pulse image (right). B, 62-year-old woman with adverse synovial response with debris around prosthesis (arrows) after hip arthroplasty. Synovial response and debris around prosthesis are not well demarcated on STIR image (left) but are evident on STIR optimized inversion pulse image (right).
and stainless steel. Accordingly, we observed less artifact in patients with prostheses of titanium. On the other hand, the knee in Figure 2A has extensive artifacts caused by implants with high susceptibility constants, in this case likely consisting of cobalt-chromium. The presence of a metal device causes an inhomogeneous magnetic environment with altered excitation profiles of the protons in the tissues. The sequela is distortion of isomagnetic lines in the slice-selection gradient profiles with asymmetry and variation in image section-thickness profiles [8, 9]. One way to decrease distortion in the frequency-encoding direction is to use high sampling bandwidth, but at the cost of signal-to-noise ratio. Misregistration artifacts in the vicinity of a metallic implant cause distinctive signal alterations, including signal voids, signal loss, and signal increases, resulting in hypointense and hyperintense artifacts around the implanted metal, especially on images acquired with spin-echo and turbo spin-echo (TSE) sequences. Misregistration artifacts occur both in the frequency encoding and slice-selection directions [4, 5]. Misregistration artifacts are inversely proportional to the frequency-encoding and slice-selection gradient strength [10] and may be reduced by increasing receiver bandwidth and radiofrequency pulse bandwidth. A previous report [11] has described numerous methods of decreasing susceptibility artifacts at 1.5 T. These methods include use of TSE or STIR sequences, orienting the frequency-encoding direction away from the tissue of interest, using lower field strength, increasing readout gradient strength, increasing readout bandwidth, using shorter TE, decreasing FOV and voxel size, using parallel imaging techniques, using view angle tilting [6], and using slice encoding for metal artifact corrections [12].
In the presence of severe susceptibility field distortion due to metal implants, protocols with conventional spectral fat suppression are commonly replaced by STIR protocols to achieve more robust fat suppression. However, STIR images based on the standard TSE sequence still show low-signal-intensity banding artifacts or high-signal-intensity areas without fat suppression. This phenomenon is caused by mismatch of the bandwidths of the inversion radiofrequency pulse and the excitation-refocusing radiofrequency pulses. The inverted slice plane has different local displacement from that of the slice plane being imaged. Matching the excitation bandwidth of the inversion pulse with the bandwidth of the excitation-refocusing pulses removes this effect and thus largely reduces related artifacts. The artifacts related to the field distortion are not removed, but at least the STIR contrast can be maintained in a much larger area of the image. In this study we investigated a new STIR sequence featuring a modified inversion pulse with an optimized bandwidth of the inversion pulse. Use of this sequence leads to substantial reduction in metal artifacts (distinction and blurring) and better delineation of anatomic structures in all three regions studied (hip, knee, spine). In some cases, it leads to a small increase in noise. Moreover, substantially more clinically relevant findings in the hip were made on STIR optimized inversion pulse images than on standard STIR images. Consequently, the STIR optimized inversion pulse sequences may enable reliable MRI evaluation of prosthesis loosening, prosthesis wear, osteolysis, infection, joint effusion, early bone marrow changes, and tendon avulsion. This capability would be advantageous over evaluation with radiography and CT because MRI can depict fluid around prosthesis components. A study by Potter et al. [1] showed
the advantage of MRI with fast spin-echo (a synonym for TSE) sequences in the assessment of periprosthetic soft tissues in patients who had undergone hip arthroplasty. The anatomy might have been better visualized with fast spin-echo sequences than with STIR sequences, but the STIR sequence is more sensitive for fluid and edema. This capability may help in the detection of periprosthetic subtle marrow edema and osteolytic adverse synovial response with debris. Our results show improved fat suppression around orthopedic implants with the STIR optimized inversion pulse sequence, especially in the hip. Thus this sequence may serve as an adjunct to non–fat-suppressed high-resolution sequences to discern greater trabecular detail and to assess adverse synovial reaction and potential nerve compression. Our study had limitations. In most of the patients, information about the composition of the implanted materials was not available. Therefore, the material used could not be related to the extent of artifacts. However, we observed less artifact in the investigated spines. In particular, there was no area of insufficient fat suppression with either sequence, possibly because most of the screws were made of titanium. On the STIR images in this study, the region of the intervertebral foramen was too noisy for adequate assessment of nerve root edema. Conclusion As a consequence of the favorable results of this study, we introduced the STIR optimized inversion pulse sequences into our routine MRI protocol for evaluation of patients with metal implants. It replaced the previously used standard STIR sequence on our 1.5-T MRI systems. Images obtained with the STIR sequence featuring optimized higher bandwidth
AJR:199, December 2012 W741
Ulbrich et al.
Downloaded from www.ajronline.org by Hauptbibliothek Universitaet on 07/25/14 from IP address 144.200.17.40. Copyright ARRS. For personal use only; all rights reserved
of the inversion pulse showed significant artifact reduction and better anatomic distinction. References 1. Potter HG, Nestor BJ, Sofka CM, Ho ST, Peters LE, Salvati EA. Magnetic resonance imaging after total hip arthroplasty: evaluation of periprosthetic soft tissue. J Bone Joint Surg Am 2004; 86:1947–1954 2. Guermazi A, Miaux Y, Zaim S, Peterfy CG, White D, Genant HK. Metallic artefacts in MR imaging: effects of main field orientation and strength. Clin Radiol 2003; 58:322–328 3. White LM, Buckwalter KA. Technical considerations: CT and MR imaging in the postoperative orthopedic patient. Semin Musculoskelet Radiol 2002; 6:5–17
W742
4. Harris CA, White LM. Metal artifact reduction in musculoskeletal magnetic resonance imaging. Orthop Clin North Am 2006; 37:349–359 5. Lee MJ, Kim S, Lee SA, et al. Overcoming artifacts from metallic orthopedic implants at highfield-strength MR imaging and multi-detector CT. RadioGraphics 2007; 27:791–803 6. Viano AM, Gronemeyer SA, Haliloglu M, Hoffer FA. Improved MR imaging for patients with metallic implants. Magn Reson Imaging 2000; 18:287–295 7. Koch KM, Hargreaves BA, Pauly KB, Chen W, Gold GE, King KF. Magnetic resonance imaging near metal implants. J Magn Reson Imaging 2010; 32:773–787 8. Bakker CJ, Bhagwandien R, Moerland MA, Fuderer M. Susceptibility artifacts in 2DFT spin-echo
and gradient-echo imaging: the cylinder model revisited. Magn Reson Imaging 1993; 11:539–548 9. Bakker CJ, Bhagwandien R, Moerland MA, Ramos LM. Simulation of susceptibility artifacts in 2D and 3D Fourier transform spin-echo and gradient-echo magnetic resonance imaging. Magn Reson Imaging 1994; 12:767–774 10. Petersilge CA, Lewin JS, Duerk JL, Yoo JU, Ghaneyem AJ. Optimizing imaging parameters for MR evaluation of the spine with titanium pedicle screws. AJR 1996; 166:1213–1218 11. Hargreaves BA, Worters PW, Pauly KB, Pauly JM, Koch KM, Gold GE. Metal-induced artifacts in MRI. AJR 2011; 197:547–555 12. Lu W, Pauly KB, Gold GE, Pauly JM, Hargreaves BA. SEMAC: slice encoding for metal artifact correction in MRI. Magn Reson Med 2009; 62:66–76
AJR:199, December 2012