PUBLS. INST. GEOPHYS. POL. ACAD. SC., E-10 (406), 2008
Stochastic Transfer Function Simulator of a 1-D Flow Routing Renata J. ROMANOWICZ, Adam KICZKO, and Jarosław J. NAPIÓRKOWSKI Institute of Geophysics Polish Academy of Sciences Ks. Janusza 64, 01-452 Warszawa, Poland e-mail:
[email protected]
A b s tr a c t The paper presents an application of a Stochastic Transfer Function (STF) approach and a State Dependent Parameter (SDP) transformation of model variables to the combined reservoir management and flow routing problem on the Upper Narew River, NE Poland. The management objective is to reach required flow conditions in the reaches of an ecologically valuable river. A 1-D distributed flow routing model was designed for the study. However, both optimisation methods and reservoir management analysis require numerous model realizations which are computationally very expensive. A much more efficient solution consists of the application of a simplified STF simulator of river flow, which is calibrated on historical data and distributed model realizations for the parts of the river where the observations are not available. The model is stochastic, enabling derivation of prediction uncertainty in a straightforward manner. The obtained optimal control policy is tested on a fully distributed model.
1.
Introduction
River floods are commonly considered as natural phenomena with threats to life and health and loss of property. However, in some situations they have a positive impact, helping to preserve the natural features of a particular region. Due to their natural character and high water content, floodplains are commonly areas of rich biodiversity. Equally, valuable fluvial ecosystems can be destroyed by shortages of water in critical periods of high-water demand (vegetation growth). It is the task of hydrologists to assess the short and medium-term inputs to, and retention of, water eco-systems in vulnerable areas and to devise methods to regulate those inputs. This is the case in the Narew catchment, north-east Poland, in the area within the boundaries of the Narew National Park (NNP), where spring floods not only cause no material damage but bring positive effects in preserving the natural qualities of the region.
152
To maintain the required status of riverine wetlands with fluvial-glacial feed, it may be necessary to retain, during the river’s vegetation growth period, not only higher than minimum flows according to a hydro-biological criterion, but also to keep or introduce a flood impulse. The concept of flood impulse was introduced by Junk et al. (1989) for tropical rivers and was further developed by Tocker et al. (2000) for rivers situated in intermediate climate zones. The concept was followed by Kiczko et al. (2007), where the problem of reservoir management was studied. The aim was an analysis of the possibility of reaching the ecologically desirable conditions in the Narew National Park wetlands through reservoir management. River flow was described using a distributed 1-D model. Derivation of the optimal time and length of the releases from the reservoir was based on the optimisation of the entire system including the river and the reservoir (Dysarz and Napiórkowski 2002), using the Differential Evolution Algorithm (Storn and Price 1995). The optimisation algorithm requires multiple 1-D model evaluations and therefore the computation time is a limiting factor of the procedure (Dysarz and Napiórkowski 2003). In order to facilitate the computations, a lumped parameter simulator of a distributed flow routing is introduced in the multiobjective optimisation of a water management system consisting of a lowland river and a storage reservoir. The developed simulator applies the Stochastic Transfer Function (STF) approach together with a nonlinear transformation of variables. The model is calibrated on historical data and on distributed model realizations for the parts of the river where the observations are not available. The model is stochastic, enabling derivation of prediction uncertainty in a straightforward manner; therefore, it is suitable for scenario analysis of the water management system under uncertain climatic conditions. Estimated probability of water levels at the cross-sections along the river enables the derivation of probability maps of inundation at different times of the year. 2.
Methodology
Consider a 1-D numerical model with the river geometry described by n crosssections. This kind of approach is used in many popular 1-D flow routing models (ISIS, HEC-RAS, UNET, MIKE 11). The methodology we apply here is based on the application of a lumped discrete-time STF model combined with the nonlinear State Dependent Parameter (SDP) type transformation to simulate flow routing along the river instead of a distributed 1-D model. Experience gained by Romanowicz et al. (2004, 2006), and Beven et al. (2008), indicated that STF models are compatible with distributed model predictions at cross-sections where observations are available. The interpolation of water levels at cross-sections between the measurement sites can be obtained when STF simulators are calibrated on the distributed model simulations at these cross-sections. As 1-D model applies spatial discretisation based on cross-sections along the river and the floodplains, the simulator can also apply that type of spatial discretisation, but it can be made coarser than in a distributed model, depending on the application. When water levels are used as the STF model variable, we can use the nonlinear transformation of water levels upstream (model input) in order to separate linear dy-
153
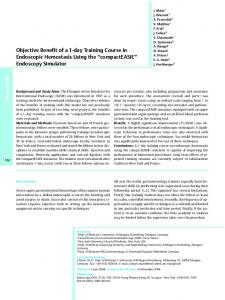
namics from the nonlinear flow routing process (Young et al. 2006, Romanowicz et al. 2007, Romanowicz et al. 2008). The resulting simulator takes the form of the socalled Hammerstein type model (Fig. 1A). However, when flow is used as the model variable, the STF model cannot be accompanied by a nonlinear transformation of the input, as this type of model would not be able to keep the mass balance for the steady state solution. In that case the simulator consists of a system of linear STF models. The nonlinear flow-water level transformation used to evaluate water levels at each cross-section applies a rating curve-type conversion, which does not influence the flow routing module (Fig. 1B). Figures 1A and 1B illustrate both schemes for a single sub-reach between two cross-sections of a distributed UNET model. In Fig. 1A, hi,k denotes water level upstream at discrete time period k, hn,k denotes the water level downstream at crosssection n, fi,n(.) denotes a nonlinear transformation between input and output (Romanowicz et al. 2008).
Fig. 1. (A) The scheme of a nonlinear Hammerstein type STF simulator of one sub-reach of a 1-D flood routing model (a sub-reach without tributaries); (B) The scheme of a linear STF model for flow with a nonlinear conversion for the water levels.
In Fig. 1B, Qi,k denotes discrete flow upstream, Qn,k denotes flow value downstream and grn(.) denotes the “rating curve” type transformation for the 1-D model variables. At the reach scale, the discrete-time STF (Young 1984) describes the process dynamics. The model structure identification and estimation of parameters is performed using MATLAB optimisation routine together with a Simplified Refined Instrumental Variable (SRIV) routine from Captain toolbox (www.lancaster.ac.uk). The STF model error is assumed to account for all the uncertainty at the output of the system that is associated with the inputs affecting the model, including measurement noise, unmeasured inputs, and uncertainties associated with the model structure. The choice of the type of STF model input determines the simulator structure. In the first approach, flow (water level) at the cross-sections upstream of each sub-reach of a numerical 1-D model is used as an input variable. In this case, the model of the entire river reach consists of n serially connected modules shown in Fig. 1A or 1B, depending on the choice of routing variables. The output from the sub-reach upstream is used here as an input to the downstream sub-reach. The other approach consists of
154
building an independent Single Input Single Output (SISO) or Multiple Input Single Output (MISO) model for each cross-section, using the available observed inputs upstream (flows or water levels) and simulated by the 1-D model flows or water levels at a cross-section as an output. In the second approach, each cross-section of the 1-D model is modelled as an independent input-output system using the modules A or B from the Fig. 1, depending on the choice of routing variable. In the case where lateral inflow is present, the multi-input model is required for the ith cross-section. Therefore the required river reach is modelled by the set of those SISO (or MISO) transfer functions. In the following step of the procedure, the flows obtained from the simulator are transformed into water levels. That nonlinear transformation, derived using the State Dependent Parameter (SDP) method (Young et al. 2001) from 1-D model simulations for each cross-section, is subsequently parameterised using radial basis functions (Buhmann 2003). We shall call this approach a parallel simulator to distinguish it from the sequential scheme. This approach should give smaller prediction errors due to the lack of propagation of the error. However, when differences between the crosssections are large, modelling errors would occur due to smaller correlation between the sites. 3.
River Narew study: parallel STF simulator
The study reach is about 110 km long. It starts at the Siemianówka reservoir and goes down over the lowland, agricultural area and Narew National Park (NNP) enclosing valuable wetland ecosystems, as shown in Fig. 2. In recent years both a reduction in mean flows and shorter flooding periods have resulted in a serious threat to the rich wetland ecosystems situated along the river in NNP. These undesirable changes were caused by changes in local climate, manifested as recent mild winters and a reduction in annual rainfall that have resulted in reduced groundwater resources.
Fig. 2. Upper Narew Valley showing the study area, stage gauging stations are shown as triangles, shaded crossed area on the right denotes the reservoir and crossed area on the left denotes the marshland.
155
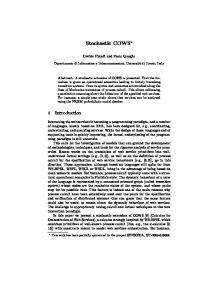
The UNET (Barkau 1993) 1-D model was chosen here due to its short run times. This code is a numerical implementation of a Saint Venant equation. In the UNET model, the river reach is represented by 57 cross-sections at about 2 km intervals obtained from a terrain survey. The model was calibrated by adjusting the Manning coefficients separately for the channel and left- and right-floodplains and water surface slope was used as a downstream boundary condition. Observations of daily water levels are available at Bondary, Narew, Ploski and Suraż on the River Narew and Narewka and Orlanka on its two tributaries. To keep a reasonable size of parameter dimensions, it was assumed that roughness coefficients do not change spatially between the gauges. The calibration period is 23.07.1981 − 28.08.1982 and the validation was performed for the period 27.08.1982 − 23.07.1983. Channel and floodplain (left and right) roughness coefficients for four reaches between gauging stations and downstream cross-section were used as model parameters. Optimization was carried out using the Differential Evolution (DE) algorithm (Storn and Price 1995). Verification gave a good fit with a mean standard deviation less than 0.14 m for each gauging station. In flood forecasting and inundation modelling we are interested in water level predictions rather than flows. However, an analysis of the UNET model results indicated that flow at each cross-section can be described by a linear dynamic relationship, while the level-level relationship is highly nonlinear. Simulated water levels at each cross-section can be derived from flow−water level nonlinear relationships, specific for each cross-section, for most of the cross-sections apart from one, situated near the first tributary. Therefore, it was decided to use flows rather than water levels to build the simulator. A preliminary analysis indicated also that use of a parallel model structure is more suitable for the present application than the sequential. Only daily observations of water levels are available from the gauging stations along the studied Narew reach. As shown in Romanowicz and Osuch (2008), daily time step does not allow for the adequate modelling of influence of tributaries on the wave celerity variation downstream Suraż. As the 1-D model output has a flexible discretisation time (e.g., 1 hour), in this application a 1-D model serves both as spatial and temporal interpolator of the observations. STF models were obtained for hourly flows simulated by UNET at 9 crosssections along the River Narew within the NNP region, between Suraż and Izbiszcze, with observed flows at Bondary, Narewka and Orlanka as input variables. All the models have 1st order dynamics. The obtained goodness of fit criterion RT2 for the validation stage (1982-1983) varies between 99.33% and 99.99%. The validation results for Suraż indicate that the UNET model has nearly linear input-output relationships for flows, i.e., it has linear dynamics. Figure 3 presents the rating curve for Suraż and water level−flow relationship obtained from UNET simulations at that cross-section shown with dotted black line. The nonparametric relationship was parameterised using Radial Basis functions (Buhmann 2003), but any other suitable parameterisation may be used. The resulting water levels at Suraż were obtained using the MISO STF model with observed flows at Bondary, Narewka and Orlanka as input variables and radial basis transformation. Figure 4 presents estimated water levels at Suraż (continuous line) together with 0.95 confi-
156
dence bounds shown as shaded area together with observed water levels shown by dots and UNET model simulations shown by stars.
Fig. 3. Observed rating curve for Suraż (thin line) and UNET level/flow relationship (thick line).
Fig. 4. Validation of the STF simulator for the cross-section at Suraż; dots denote observations, stars denote UNET simulations and continuous line denotes the simulator estimates with 0.95 confidence bounds shown by shaded area.
157
4.
Application of a simulator in reservoir management
In this application we use discharges from the Siemianówka reservoir as control variables. The optimisation criteria described in Kiczko et al. (2008) are chosen to combine reservoir management and ecological requirements posed by the wetland ecosystems along the river floodplains. Optimization of discharges from Siemianówka reservoir (control stage) was performed using historical discharges at the Bondary gauging station before the time when the reservoir was built to test the ability of improving water conditions by introducing the discharges from the reservoir. The reservoir is described using a simple discrete balance equation. Initial reservoir storage was set to the recommended value for a chosen control period by the reservoir management policy. Reservoir outflows are represented as a sum of rectangular pulses
Qout (t ) = Qbase + ∑ Pj ( t , t j , dt j , q j ) NP
(1)
j =1
where Qbase is the minimum flow (a minimum allowed discharge from the reservoir), tj is the time middle point of j-th pulse, dtj is the pulse duration time, qj is the discharge and NP is the number of considered pulses, and Pj(.) is the rectangular pulse discharge. Values of the middle time of the pulse, pulse duration time and the pulse height were used as control variables describing reservoir discharges. Ten pulses were applied (NP = 10); therefore, there were 30 control variables. In the study by Kiczko et al. (2008), three different management scenarios were analysed. In the present paper we report the results for only one scenario, from the period 0.5.10.1982 − 13.07.1983, in order to test the performance of the simulator. The optimisation problem was solved using DE Algorithm with the simulator used for flow routing. Figure 5 presents a comparison of water levels at Suraż simulated using
Fig. 5. Water levels (W.L.) at Suraż; historical observed marked with a dashed line, optimised marked with a continuous line; UNET simulations marked with a dash-dotted line.
158
Fig. 6. Low water levels probability map at the NNP area between Suraż and Izbiszcze.
UNET with results obtained using the simulator when the optimised discharges from the reservoir are applied. Also shown are the observed historical water levels at Suraż. The dark shaded area presents the values of the optimum criterion applied in order to fulfill ecological goals (the darkest shade represents the best value of the criterion). As mentioned before, the simulator predictions are given together with the uncertainty bounds. In this study we additionally apply Monte Carlo sampling to estimate the influence of parameters and observations uncertainty as well as uncertainty related to the nonlinear transformation of flows into water levels. The quantiles of predictions are used to derive the maps of probability of inundation at high and/or low water levels as shown in Fig. 6 for inundation predictions at low water levels for the region of NNP between Suraż and Izbiszcze. Comparison of these maps with ecologically desired water conditions along the River Narew reach within the Narew National Park may serve as an indicator of water management outcome.
159
5.
Conclusions
We have demonstrated that the 1-D flow routing can be successfully approximated using a system of lumped STF models (so-called simulator). The simulator structure depends on the choice of the routing variable (water levels or flows) and on the choice of input variables (sequential or parallel system). In the case of UNET model, a choiceof flows as the routing variable and a parallel structure gives superior results. The simulator was applied within the optimisation routine to derive the best reservoir discharge scheme from the point of view of joint ecological and economic criteria. Further work is required to extend this approach towards the modelling of the uncertainty of predictions related to the uncertainty of the distributed model parameters. At present only observation and simulator parameters uncertainty were taken into account during the estimation of the simulator predictions uncertainty. The uncertainty of model predictions is used to derive the probability maps of inundation extent within the ecologically valuable reach of the River Narew. A c k n o w l e d g e m e n t s . This work was partly supported by Scientific Network “Geoinformation Systems” funded by the Polish Ministry of Science and Higher Education.
References Barkau, R.L. (1993), UNET, one-dimensional flow through a full network of open channels, user’s manual version 2.1. Publication CPD-66, U.S. Army Corps of Engineers, Davis, CA, Hydrologic Engineering Center. Beven, K.J., P.C. Young, D. Leedal, and R.J. Romanowicz (2008), Computationally efficient flood water level prediction (with uncertainty), to appear in the Proceedings of Flood Risk Conference, Oxford, UK, September, 2008. Buhmann, M.D. (2003), Radial Basis Functions: Theory and Implementations. Cambridge University, Cambridge. Dysarz, T., and J.J. Napiórkowski (2002), Global optimisation method for determination of reservoir decision rules during flood. In: 5th ICHE, Warsaw, Poland, CD Proceedings, p. Track F, PDF 153. Dysarz, T., and J.J. Napiórkowski (2003), Computer-based analysis and design of control mechanisms for flood operation in multireservoir systems. In: J.J. Napiórkowski (ed.), Modelling and Control of Floods, Publs. Inst. Geophys. Pol. Acad. Sc., E-3 (365), 83-96. Junk, W.J., P.B. Bayley, and R.E. Sparks (1989), The flood pulse concept in river floodplain systems. In: D.P. Dodge (ed.), Large River; Proc. Intern. Sym. Journal of Canadian Fisheries and Aquatic Sciences, 11, 106-107. Kiczko, A., R.J. Romanowicz, and J.J. Napiórkowski (2007), A study of flow conditions aimed at preserving valuable wetland areas in the Upper Narew Valley using GSA-GLUE methodology. In: Proceedings 21st International Conference on Informatics for Environmental Protection, September 12-14, 2007, Warsaw, Poland, Shaker Verlag, 175-183.
160 Kiczko, A., A. Piotrowski, J.J. Napiorkowski, and R.J. Romanowicz (2008), Integration of reservoir management and flow routing model: Upper Narew case study, Publs. Inst. Geophys. Pol. Acad. Sc. E-9 (405), 41-55. Romanowicz, R.J., P.C. Young, and K.J. Beven (2004), Data assimilation in the identification of flood inundation models: derivation of on-line multi-step ahead predictions of flows. In: B. Webb, N. Arnell, C. Onf, N. MacIntyre, R. Gurney, and C. Kirby (eds.), Proceedings of the BHS international conference: hydrology, science and practice for the 21st century, London, July 2004, 348-53. Romanowicz, R.J., P.C. Young, and K.J. Beven (2006), Data assimilation and adaptive forecasting of water levels in the river Severn catchment, United Kingdom, Water Resour. Res. 42, W06407, DOI: 10.1029/2005WR004373. Romanowicz, R.J., A. Kiczko, and F. Pappenberger (2007), A state dependent nonlinear approach to flood forecasting, Publs. Inst. Geophys. Pol. Acad. Sc. E-7 (401), 223-230. Romanowicz, R.J., P.C. Young, K.J. Beven, and F. Pappenberger (2008), A data based mechanistic approach to nonlinear flood routing and adaptive flood level forecasting, Advances in Water Resour. 31, 8, 1048-1056, DOI: 10.1016/j.advwatres.2008.04.015. Romanowicz, R.J., and M. Osuch (2008), An integrated data based mechanistic lowland catchment model for the Upper Narew, Publs. Inst. Geophys. Pol. Acad. Sc. E-9 (405), 57-74. Storn, R., and K.V. Price (1995), Differential Evolution – a simple and efficient adaptive scheme for global optimization over continuous spaces. Technical Report TR-95-012, International Computer Sciences Institute, Berkeley, CA, USA. Tockner, K., F. Malard, and J.V. Ward (2000), An extension of the flood pulse concept, Hydrological Processes 14, 16-17, 2861-2883. Young, P.C. (1984), Recursive Estimation and Time Series Analysis, Berlin: Springer-Verlag. Young, P.C., P. McKenna, and J. Bruun (2001), Identification of non-linear stochastic systems by state dependent parameter estimation, International Journal of Control 74, 18, 1837-1857, DOI: 10.1080/00207170110089824. Young, P.C., R.J. Romanowicz, and K.J. Beven (2006), Updating Algorithms in Flood Forecasting, Flood Risk Management Research Consortium, Report UR5, www.floodrisk.org.uk. Accepted November 13, 2008