STOOP: The Sable Toolkit for Object-Oriented Profiling. Rhodes Brown. Karel Driesen. John Jorgensen Laurie J. Hendren. Qin Wang. Clark Verbrugge.
STOOP: The Sable Toolkit for Object-Oriented Profiling Rhodes Brown Karel Driesen John Jorgensen Laurie J. Hendren Qin Wang Clark Verbrugge School of Computer Science McGill University [rhodesb,jjorge1,qwang21,karel,hendren,clump]@cs.mcgill.ca
1.
2. PROFILING AGENTS
INTRODUCTION
Profile data may originate from a wide variety of sources. For example, traces of method invocations or object instantiations might come from a jvmpi agent, maps of object addresses in memory from an instrumented garbage collector, and arbitrary application-specific data from custom instrumentation compiled into the profiled program. Any information source—including existing trace data and sources as yet unforeseen—may act as a Stoop profiling agent, so long as the data is converted using a Step interface to generate the binary stream of events. Such a stream can then be connected to a Step reader and Stoop visualizer combination to render the data.
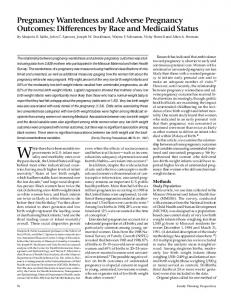
The performance and behaviour of object-oriented programs is often very difficult to understand, particularly for large, complex software systems consisting of many packages and classes. Stoop provides high-level facilities which allow a user to rapidly construct tools to collect and visualize profile data from the execution of object-oriented programs. Stoop has been implemented in Java and we have applied the toolkit to a variety of tasks for profiling Java. We are particularly interested in applying the toolkit to study program behaviour that might suggest new optimization or execution strategies for Java. For example, by examining the behaviour of hot data fields and the relationships between field accesses we may develop new strategies to make better use of a data cache. As illustrated in Figure 1, Stoop consists of three major pieces: a profiling agent, an event pipe, and a visualizer. The profiling agent collects various profile data and uses it to generate a stream of events. Our intent is to support a wide variety of profiling agents including agents using the Java Virtual Machine Profiling Interface (jvmpi), instrumented virtual machines, and instrumented bytecode. The event pipe serves as a high-level interface between the front-end profiling agent and the back-end visualizer. It converts profile data to a binary format, buffers (and potentially compresses) the data, then forwards it to the visualizer. In order to provide a clear and flexible interface, profile events are described using a specification language called Step. A compiler, stepc, generates high-level representations of the profile data that can easily be written to, and read from the event pipe. The visualizer reads the stream of profile events leaving the pipe and presents the data using several different views. The remainder of this abstract provides a short introduction to the three components: profiling agents in Section 2, the event pipe in Section 3 and the visualizers in Section 4. We conclude and give a brief overview of related tools in Section 5.
3. EVENT PIPE The Stoop event pipe provides an infrastructure for transporting profile data from producer (profiling agent) to consumer (visualizer). The reason for providing this intermediary, instead of connecting the producer directly to the consumer, is twofold. The primary motivation is to create a system that can be extended to accommodate arbitrary profile data. In particular, a user of the framework is free to define their own data schema. The second reason for decoupling producer and consumer is to allow the introduction of a specialized buffering agent. The buffering agent can use secondary storage to significantly increase its capacity. Also, it may exploit features of the data stream to further increase its capacity through compression. This enhanced buffering is useful, since profile traces often comprise gigabytes of data. In such cases, a direct link between producer and consumer would likely overwhelm simple buffering techniques.
3.1 The Stoop Trace Event Protocol At the core of the event pipe architecture is the Stoop Trace Event Protocol (Step). The Step system translates profile data to and from a binary format that is platform independent and provides opportunities for compression1 . The main feature of the system is that it is designed to be extensible, in the sense that users are free to define the format of profile data records. This flexibility is achieved through the use of a profile specification language that defines the various data records which may be passed from producer to consumer. Schema definitions are compiled (by the stepc compiler) into Java or C code that can be directly integrated into the profile agent and visualizer. This
Permission to make digital or hard copies of all or part of this work for personal or classroom use is granted without fee provided that copies are not made or distributed for profit or commercial advantage and that copies bear this notice and the full citation on the first page. To copy otherwise, to republish, to post on servers or to redistribute to lists, requires prior specific permission and/or a fee. Copyright 2001 ACM 0-89791-88-6/97/05 ..$5.00
1
For a discussion of the benefits of a binary trace format and its potential for compression see [1]. 1
input
STEPC
Writer
Profiling Agent
Buffer
Reader
Interface
Compress
Interface
Agent
Decompress
Program
View Data Manager View
Event Pipe Visualizer
Figure 1: Overview of Stoop allows for a more intuitive, high-level interface to both profile agent and visualizer, while masking representation and transmission details.
4.
records and the stepc compiler is used to automatically generate the interface methods. The Step system was inspired primarily by the MetaTF language introduced in [1]. Since our primary goal was to create a framework that could accept arbitrary profile data, the notion of using a profile specification language was naturally appealing. Originally, we had hoped to use the Meta-TF language directly, however we found it useful to extend (and slightly modify) the language in several ways. The result is a distinct Step metalanguage. Our approach is unlike commercial profilers such as OptimizeIt [4], JProbe [3] and Jinsight [2] in that these systems are fixed profiling tools where the user interacts with the profiler to view predetermined program properties. The purpose of our tool is to allow one to develop profilers to view both standard and non-standard program properties, and to view events that come from a variety of sources. Perhaps closer to our approach is Bloom [5, 6], a profiling system which allows the user to interactively build a query which may be displayed using a wide range of supported data views. However, even in this system the program traces are predefined and there is no specification language for defining new trace events. Nonetheless, Bloom’s query-based visualization techniques may prove useful in visualizing novel profile data with Stoop.
VISUALIZERS
Each visualization is generated by the combination of a data manager with a view. The data manager reads the data provided by the event pipeline, extracts the information relevant for the particular visualization, and relays it to the view. The view draws the corresponding output and interacts with the user. The data-view interface allows the view to both read data from the data manager and to send control information, such as filtering criteria, back to it. The data manager understands the meaning of the data and chooses which views may be used to visualize the information. It also needs to decide how the data can be interpreted in a given view and implements the view’s interface accordingly. The view, on the other hand, does not need to know what the data represents. Instead, it reads the data as a sequence of information units from the data manager, and displays these units according to their properties, as directed by the user. For example, instances of a histogram view might be used to visualize both the distribution of object allocations by object size and the frequencies with which the fields of different classes are referenced. In the first case, the data manager would select each object allocation event, and send to the view an information unit which increments the count for the corresponding object size. In the second case, the data manager would select each field reference event, and ask the view to increment the count for the corresponding field name. The same data may also be visualized in different ways by sending it to multiple views. In Stoop there are several built-in views, and new views can easily be added.
5.
6. REFERENCES [1] T. Chilimbi, R. Jones, and B. Zorn. Designing a trace format for heap allocation events. In Proceedings of the ACM SIGPLAN International Symposium on Memory Management (ISMM 2000), pages 35–49, Minneapolis, MN, USA, October 2000. [2] Jinsight. http://www.research.ibm.com/jinsight/. [3] JProbe. http://www.sitraka.com/software/jprobe/. [4] OptimizeIt. http://www.vmgear.com/. [5] S. P. Reiss. An overview of Bloom. In Proceedings of the 2001 ACM SIGPLAN-SIGSOFT Workshop on Program Anaylsis for Software Tools and Engineering, pages 71–77, Snowbird, Utah, USA, June 2001. [6] S. P. Reiss and M. Renieris. Generating Java trace data. In Proceedings of the ACM 2000 conference on Java Grande, pages 71–77, San Francisco, CA, USA, June 2000.
CONCLUSIONS AND RELATED WORK
In this abstract we have given an overview of the Stoop profiling toolkit. The main goal of the toolkit is to provide a profiler developer with support for rapid development of custom profilers for object-oriented languages. The toolkit has been designed to support many different profiling agents and visualizers which communicate through an event pipe. The Step protocol is used to specify the format of profile 2