However, as Boscolo and Buongiorno (1997) have shown, the management of a forest for both timber revenues and non-timber services requires more.
Strategies for Multiple Use Management of Tropical Forests: An Assessment of Alternative Options Marco Boscolo CID Working Paper No. 41 March 2000
Copyright 2000 Marco Boscolo and the President and Fellows of Harvard College
Working Papers Center for International Development at Harvard University
Strategies for Multiple Use Management of Tropical Forests: An Assessment of Alternative Options Marco Boscolo Abstract One of the debates in tropical forest management centers on how to manage these resources for multiple uses. In fact, although the need to account for multiple values in forestry decisions is widely recognized, its implications for forest management are not clear. In particular, how is multiple-use to be achieved? Should management for multiple values be adopted on each forest management unit? Or should multiple use be attained at the landscape level, for example by dividing the landscape into units and manage each unit for a dominant use (e.g., timber production, conservation, etc.)? In tropical forest settings, where multiple use is often attained with less intensive harvesting and at the expenses of bringing larger – often virgin – areas into production, the circumstances under which multiple-use management is superior to dominant-use remain unclear. Past scholarly work has pointed to some circumstances under which dominant use may be superior to multiple (joint) use. The empirical significance of these circumstances has been quantified only in limited temperate settings. In this paper, we review two circumstances that are likely to yield to a non-convexity in the forest production set: the existence of large fixed costs associated with the production of one good (e.g., timber); and the existence of inefficiencies in the timber production process. The empirical significance of such circumstances is evaluated with the aid of a simulation model developed for a lowland tropical forest in peninsular Malaysia. Results suggest that, for certain benefits associated with forest diversity, specialized use (separation of conservation and timber production processes) is likely to be a strategy superior to multiple use. Keywords: tropical forests, multiple use, specialization, non-convexities, biodiversity, carbon storage JEL Classification Codes: Q23 ______________________________________________________________________________ Marco Boscolo is a Research Fellow at the Center for International Development. His research interests focus on the economics of forest conservation and management, on modeling environmental and economic interactions, and on the determinants of the environmental behavior of rural communities and forestry firms. I am grateful to Randall Bluffstone and Jeffrey Vincent for their invaluable suggestions and comments on earlier drafts. I thank the Forest Research Institute of Malaysia (FRIM) and N. Manokaran, J. LaFrankie, K.M. Kochummen, E.S.Quah, J.E. Klahn, P.S. Ashton and S.P. Hubbell in particular for the biological data. The 50hectare forest plot at the Pasoh Forest Reserve is an ongoing project of the Malaysian Government initiated by the Forest Research Institute of Malaysia and led by N. Manokaran, Peter S. Ashton and Stephen P. Hubbell. This work was prepared with partial support from the Smithsonian Tropical Research Institute’s Center for Tropical Forest Science, from the AVINA Foundation, from the Center for International Development, and from the Harvard Institute for International Development.
Strategies for Multiple Use Management of Tropical Forests: An Assessment of Alternative Options Marco Boscolo I. Introduction One of the debates in forest management centers on how to manage tropical forests for multiple uses. Multiple use management is critical, since tropical forests provide many services whose consideration and capture increase the total forest value (Repetto and Gillis 1988; Peters and al. 1989; Panayotou and Ashton 1992). Although the need to account for multiple values in forestry decisions is widely recognized, there remain questions on its implications for forest management. In particular, how is multiple-use to be achieved? Should management for multiple values be adopted on each forest management unit? Or should multiple use be attained at the landscape level, for example by dividing the landscape into units and managing each unit for a dominant use (e.g., timber production, conservation, etc.)? It seems inevitable that specialization will increase in the future. Demand for wood is expected to increase (FAO 1997) while, at the same time, the international community calls for more extensive efforts to bring virgin tropical forests under full protection (see the World Bank/WWF initiative to bring additional 50 million hectares of forests under full protection by the year 2005). Furthermore, increased specialization will likely be the outcome of forest policy reforms that are being implemented in various tropical countries1. Such reforms,
1
In countries such as Bolivia and Cameroon, for example, higher taxes are being imposed on a per hectare basis on forest concessions. The effect of area taxes is to reduce the amount of forestland that is allocated to commercial exploitation and to increase the intensity of harvesting. In Bolivia, for example, the new forest law (passed in 1996)
1
for example higher area taxes imposed on forest concessions, will likely result in more intense harvesting of smaller areas. Yet, are these changes desirable? What are the expected economic and environmental outcomes from increased specialization? A relatively mature debate over the pros and cons of these strategies with respect to North American forests has already taken place (see, for example, Alverson at al. 1994). In tropical forest settings, where multiple values are often generated by harvesting with low intensity very large – often virgin – areas, the circumstances under which multiple-use management is superior to dominant-use remain unclear. This issue hinges upon the shape of the trade-off curve between timber and no-timber values. Standard economic theory usually assumes that, among competing uses, constant increments in one output require increasing sacrifices in another output (the production set is convex). For example, while timber harvesting is expected to impair soil protection, the damage caused by extraction of the first $500/ha worth of timber would be expected to impair soil protection less than the extraction of additional $500/ha worth of timber. This is because perhaps the first $500 can be obtained by harvesting only one highly valued tree while several additional lower value trees are needed to extract additional $500 (and thus more than proportional damage is caused). Under the assumption of convexity of the production set and building on the previous example multiple use (extract a total of $1000 from two separate hectares) is better than specialized use (extracting $1000 form one hectare and leave the other one untouched). On the other hand, if trade-offs between competing values is non-convex (a concept clarified below) than specialized used is likely to be superior.
increased the area tax of $1/ha/year. This tax contributed to the reduction of the total forest under concession from 22 to less than 6 million hectares and to an increase in the rate of exploitation (from XX to 10-20 m3/ha).
2
The forestry literature has dealt with non-convexities in multiple use forest management for some time. Bowes and Krutilla (1989:116), for example, illustrated the effect of varying the rotation age on timber and water values. They showed that, if shortening the rotation age causes water values to increase in a more than proportional way, the resulting production set between timber and water can be non-convex. Similarly, Swallow et al. (1990) analytically identified functional forms for non-timber values (wildlife, forage, and wilderness) that would lead to nonconvex production sets. Like Bowes and Krutilla, they investigated trade-offs between timber and other non-timber values by modifying the rotation age for a single stand. Others have explored non-convexities associated with stand interactions. Again focusing on the optimal rotation age problem, Swallow and Wear (1993) showed that interdependencies among stands can result in non-convex production sets for timber and wildlife forage. Talukdar (1996) reached similar conclusions. She extended previous research by developing a multistand, multi-owner, dynamic programming model and investigated policy implications and potential economic gains attainable when coordination and communication exist among landowners. Her application to Montana’s forests provides perhaps the most convincing numerical illustration of the potential gains from specialization in forest management for multiple values (in this case, timber and wildlife). A graphical analysis by Vincent and Binkley (1993) also suggests that non-convexities may be widespread in actual forests. Interestingly, their result may hold even if the forest is perfectly homogeneous. With notable exceptions, most of these studies lacked empirical testing, focused on temperate forests, and explored the nature of trade-offs mainly by varying the optimal rotation age (and consequently the age-class distribution of a forested landscape). In tropical forest
3
management the issues are partially more complicated because the decision of which cutting cycle to select is coupled with the decision of which diameter cutting limit to adopt. Furthermore, two additional reasons may cause non-convexities to arise: (1) large differential fixed costs between timber production and conservation; and (2) technical constraints in harvesting operations. In this paper we explore the empirical significance of non-convexities of the forest production set with the aid of a simulation model that predicts the economic (Net Present Value –NPV) and environmental (forest diversity and carbon emissions) consequences of alternative management regimes. The relative desirability of multiple use v. specialization is assessed by comparing the levels of timber and non-timber values that can be attained using multiple use as opposed to specialized strategies. I consider “multiple use strategies” management adaptations such as shifting from conventional to reduced impact logging, modifying felling cycles, diameter cutting limits, and species selection that are applied to the entire landscape. I consider “specialized strategies” the management of part of the landscape primarily for conservation and the other part primarily for timber production. A virgin forest stand provides the initial condition for all simulations. Findings suggest that current forest regulations aimed at multiple use management, in particular the adoption of high diameter cutting limits, are inferior (in both economic and environmental terms) to specialized land use. In other words, the concentration of extractive activities in limited areas would allow in the medium term the achievement of higher levels of timber revenues together with improvements in the overall quality of the environmental attributes considered. The primary reason for such conclusion seems to be driven by the high inefficiencies that characterize harvesting operations.
4
The basis for such comparison is presented in the next section with the help of a diagram. This section also describes two situations in tropical forestry that are likely to significantly affect the shape of the trade-off curve: large fixed costs associated with logging operations, and technical constraints. In section III I briefly describe a model that is used to test the empirical significance of such factors. Results are then presented and discussed.
II. Non-convexities in the management of tropical forests: A graphical illustration Whether the production of multiple outputs is achieved more efficiently through multiple use or dominant use depends on, among other things, the shape of the forest production set. This is the set of feasible output combinations (e.g., timber and biodiversity) attainable with a limited endowment of input factors (e.g., forestland, budgetary resources, etc.). Standard economic theory usually assumes that this set (bounded by the trade-off curve) is convex2. This is exemplified in Figure 1 where, for simplicity, only two forest products, timber (T) and nontimber (NT), are represented. If NT has a positive value, then some combination of T and NT should be sought. Since efficiency requires the manager (or policy maker) to equate production trade-offs with consumption trade-offs (relative values), social welfare is maximized when the resource is used to produce multiple goods. In Figure 1, point B is the optimal solution. Some combination of T and NT can, of course, be attained either using a multiple or a dominant use strategy. For example, solutions on the solid line connecting C to A could be obtained by managing the entire landscape for both products, for example, by choosing different felling cycles, cutting regimes, or logging technologies. Solutions on the dotted line connecting C
2
A convex set is a collection of points (solutions) such that, for each pair of points in the collection, the entire line segment joining the two points is also in the collection (Hillier and Lieberman 1990:900).
5
to A could be attained through land use specialization by managing part of the landscape according to regime C and the other part according to regime A3. The relative superiority of land use specialization over multiple use can then be ascertained by comparing the trade-off curves these two strategies generate. Multiple use is superior if, for a given level of T, higher levels of NT can be achieved with multiple use than with specialized use. This is what Figure 1 would suggest. Large fixed costs associated with timber production, and policy/technical constraints may significantly alter the shape of the trade-offs generated by multiple use. Their effects are explored in turn, again in a diagrammatic fashion.
Fixed costs. Certain costs associated with harvesting operations are likely to be independent from the intensity of harvesting. Road planning and building, inventorying, and mapping are common examples of activities whose cost is “fixed,” i.e., independent by the level of harvesting. The presence of fixed costs associated with the production of one output but not the other has been known to generate non-convexities of the production set (e.g., Lewis and Schmalensee 1977). This situation is likely to apply to tropical forests where fixed costs associated with timber harvesting are relatively higher than the costs associated with conservation (which often means simply non-activities). The impact of fixed costs on the shape of the forestry production set is illustrated by Figure 2. The points associated with timber production (all points, except A) shift to the left by an amount corresponding to the fixed costs (in present value terms). Fixed costs 3
For example, a homogeneous forest of 1,000 ha containing 800 species and 60,000 cubic meters of commercial volume could be managed for both diversity and timber production by splitting the forest in two 500-hectare blocks. Since the forest is homogeneous, such strategy would achieve the protection of at least 400 species and the production of at least 30,000 cubic meters of wood. Clearly, since halving the forest area reduces the number of species by less than half, the representation of specialization as the straight dotted line of Figure 1 is a conservative
6
create a discountinuity between the set of feasible solutions (curve M’) and the solution characterized by total conservation (point A of Figure 2).
Technical constraints. Many tropical forests are extremely complex systems where hundreds of species can be found on a single hectare. Adopting a silvicultural system that reflects the growth and regeneration requirements of each species demands a great deal of knowledge and expertise. Such knowledge is often unavailable to those that carry out harvesting and management operations. This is particularly true in the case of large commercial operations where harvesting decisions are often made by personnel unfamiliar with, untrained for, and unmotivated to carry out environmentally friendly practices. In order to ensure that harvesting operations will not compromise future harvest levels and the production of other forest goods and services, harvesting practices are generally regulated by simple guidelines such as limits imposed on the size of harvestable trees. However, as Boscolo and Buongiorno (1997) have shown, the management of a forest for both timber revenues and non-timber services requires more sophisticated silvicultural systems than the simple adoption of diameter cutting limits. For example, maintaining an intermediate level of stand diversity would require the harvesting of a few trees in most diameter classes, with no class being cut entirely. Limiting the set of management options (for reasons of practicality, technical capacity or enforcement possibilities) to the adoption of diameter cutting limits means that, for the same level of timber revenues, lower levels of diversity will be achieved. In other words, the presence of technical and capacity constraints cause the points on the forest production set associated with timber production (curve M’) to shift downward (to M’’, see Figure 3). In Figure 3 all points on M’’ attain lower levels of simplification. Presumably, also specialization will yield a trade-off curve bowed away from the origin. The point
7
diversity for the same levels of timber revenues than M’. Points A and C remain unaffected. Point A because it corresponds to a solution where no timber extraction takes place. Point C because it corresponds to the most intensive harvesting regime where all commercial trees are harvested anyway (i.e., this solution is identical to the adoption of a diameter limit of 30 cm.; see Boscolo and Buongiorno 1997). If the effects of differential fixed costs and technical constraints are strong enough, the resulting forest production set will resemble Figure 4. In this case, points along curve M’’ can be improved upon (a higher welfare level can be reached) by selecting an appropriate point on the line segment that joins A with C (see Figure 4). Between B and A land use specialization (dotted line) achieves a higher level of NT for a given value of T. In other words, “multiple use” solutions obtained by modifying variables such as felling cycles, diameter limits or logging technologies can be improved by specializing land use. Of course, whether or not fixed costs and technical inefficiencies are large enough to induce a significant non-convexity is an empirical question. This question is explored in the next sections with the aid of a simulation model.
III. Methods In order to assess the superiority of multiple use over specialization, I made use of the simulation model developed by Boscolo, Buongiorno, and Panayotou (1997) and modified by Boscolo and Buongiorno (1997). The model predicts variations over time in structure and composition of a forest stand. Dynamic variations reflect both the growth and mortality of residual (unharvested) trees in a logged-over stand and the recruitment (regeneration) of new
made in this paper will only be strengthened if such simplification is relaxed.
8
trees. Dynamics parameters (recruitment, growth and mortality) are estimated from data from a 50-hectare research plot in a virgin rainforest in Pasoh Forest Reserve in Negeri Sembilan, Peninsular Malaysia. The plot, established in 1985 by the Forest Research Institute Malaysia (Manokaran et al. 1990), has been inventoried three times, with data currently available from the first two inventories. Although these estimates are based on data from a virgin forest, other studies conducted in Malaysia indicate that average growth rates differ little between virgin and logged-over forests (Wan Razali 1988, Primack et al. 1987). To make the model more manageable, Boscolo, Buongiorno and Panayotou (1997) aggregated the hundreds of species in the Pasoh plot into three groups: dipterocarps (species in the family Dipterocarpaceae, which dominates the rainforests of Southeast Asia; denoted henceforth as D), other commercial species (O), and noncommercial species (N). They further aggregated individual trees in each group into seven 10-cm diameter classes. Their model also accounts for the damage caused to the residual stand from harvesting operations. Logging damage can be contained with reduced impact logging practices. Complete descriptions of the model, together with an assessment of its strengths and weaknesses, can be found in Boscolo, Buongiorno and Panayotou (1997) and Boscolo and Vincent (1998).
IV. Assessing trade-offs between timber and non timber values through multiple use The forest growth model described above was used to predict the impact of logging on an economic indicator, the net present value (NPV) obtained from the sale of timber, and two environmental indicators: the present value of carbon emissions (PVCE) and of forest stand diversity (PVPCI). Forest stand diversity was defined as the “proximity” or “similarity” of the managed stand to the virgin forest (hence Proximity to Climax Index or PCI).
9
For a given forest tract, we simulated approximately 140 “multiple use” management scenarios, with each of these having a different combination of decision variables: felling cycle, diameter cutting limit for dipterocarps and other commercial species, and logging technology. Each simulation gave estimates of harvested and residual number of trees, basal area, volume and biomass for each species group. From these data, we derived estimates of timber revenue and values for the environmental indicators considered.
Decision variables The simulation scenarios used a projection period of 60 years and covered the following range of management regimes: •
Felling cycles. Simulations were performed for cuttings every 30 and 60 years.
•
Diameter cutting limits and species group selection. Diameter cutting limits were specified independently for dipterocarps and commercial non-dipterocarp species. The following diameter limits were applied independently to the two groups of commercial trees: 30, 40, 50, 60, 70 cm, or no cutting at all.
•
Logging technology. We simulated the adoption of two possible logging technologies. Conventional logging where harvesting damages about 50% of the residual trees in the smallest diameter class (Griffin and Caprata 1977); and reduced impact logging (RIL) where damage to the residual stand is reduced by two thirds at an additional cost of about $135/ha (Pinard et al. 1995). RIL entails the cutting of woody climbers before harvesting, mapping of the area to be logged, careful planning and building of roads and skid trails, directional felling, and minimal use of bulldozers.
10
Economic and environmental criteria Timber revenues. The net present value (NPV) from harvesting was defined as: NPV =
T
∑δ { ∑ (P t
ij
t =0
− C j )hijt – FC – ω FRIL},
[1]
i, j
where δ t is the discount factor 1/(1+r), with r being the discrete discount rate; hijt is the number of trees harvested at time t of species group i and size j; harvest Pij is the market value of the logs in a tree of species group i and diameter class j; Cj is the variable cost of felling a tree in diameter class j and transporting the logs from that tree to the market point (a mill or port); FC is the fixed cost of conventional logging; and FRIL is the additional fixed cost associated with full implementation of RIL (ω = 1). Carbon emissions. Carbon emissions were defined as variations in the carbon stored in the biomass of living trees from one period to the next. As a result of logging, carbon is released in the atmosphere4. Following logging, the forest recovers and sequesters carbon through biomass build-up. The model records this changes as positive and negative emissions respectively. To account for carbon sequestration and release that occur at different points in time, carbon flows were discounted like timber products. The assumption is that an earlier sequestration, or emission prevention, is preferred to a later one with the rate of time preference measured by the same rate used to discount monetary values. The present value of carbon emissions was then defined as: T
PVCE =
∑ δ {k ∑ [h t
ij
t =0
ijt
i, j
+ (1 + 2 / 3ω )Dhijt ] + [ yijt −1 − yijt ] ,
4
[2]
It is assumed that the carbon reduction in the forest stand translates directly into carbon emissions (i.e., there is no long-term storage in end uses). This is a simplification that, as Boscolo and Buongiorno (1997) have shown, has minor implications for the final results.
11
where kij are estimates of the carbon stored in a tree of species group i and size j (see Boscolo and Buongiorno 1997) and yijt are the number of trees in species group i and diameter class j alive at time t. The first expression within squared brackets is related to the amount of emissions caused by harvesting. The damage matrix D reflects the fact that harvesting operations damage the residual stand, especially small trees that are killed by the felling and skidding of crop trees (see Boscolo and Buongiorno 1997). Based on a study of RIL in east Malaysia by Pinard et al. (1995) we assumed that full implementation of RIL (ω = 1) would reduce damage to the smallest class of trees by two thirds. The second expression within square brackets gives carbon accumulation from one period to the next. Carbon accumulation is measured as negative emission.
Forest diversity. The level of complexity in the virgin forest provides a useful standard for measuring diversity in the logged-over forest (Boscolo and Buongiorno 1997, Buongiorno et al. 1995). As an operational definition of diversity, Boscolo and Vincent (1998) constructed a proximity to climax index (PCI), equal to 1 minus the root mean squared deviation of basal area:
PCIt = 1−
∑( y i, j
ij 0
B j − yijt B j ) 2
∑( y
ij 0
[3]
B j )2
i, j
Bj is the basal area of a tree in diameter class j, yij0 is the number of trees in species group i and diameter class j in the virgin forest, and yijt is the corresponding number of trees t years after the initial harvest in the virgin forest. PCI equals 1 if the logged-over forest has the same structure and composition as the virgin forest, and 0 if it is devoid of trees. They weighted the number of trees by basal area to place more weight on the large trees that are associated with virgin conditions and, ecological studies suggest, high diversity of species other than trees. Similarly to
12
what was done with the other two indicators, a higher weight was given to current diversity than to future one. A present value of forest diversity was then computed as: PVPCI =
T
∑δ
t
PCI t .
[4]
t =0
To discount future flows of timber and non-timber values a rate of 10% has been used.
13
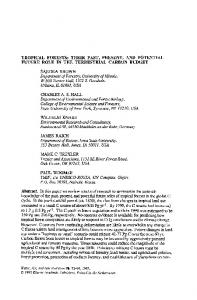
V. Results The results of these simulations are summarized in Figures 5 and 6. Figure 5 illustrates the trade-off between NPV and forest diversity; Figure 6 between NPV and carbon emissions. Each empty mark (circle or square) in the figures represents a management solution corresponding to a given combination of felling cycle, diameter limits, species harvested, and technology used. For clarity of exposition all the clearly inefficient management solution (i.e., where another solution existed that could provide higher NPV and environmental quality) are not in the Figures. NPV is maximized (point F) by the management regime where all commercial trees above 30 cm. are felled with conventional logging practices and according to a felling cycle of 60 years. On the other hand, both environmental indicators are maximized at point A where no logging takes place and, therefore, NPV is zero (there is the possibility that very light logging would not take out enough trees to cover fixed costs. Thus, there are possible solutions, not displayed, where NPV is less than zero.). Intermediate solutions are obtained by shifting from conventional to reduced logging practices and by adopting progressively larger diameter cutting limits and shorter felling cycles. Inspection of Figure 5 highlights three main points. First, NPV maximization (point F) entails a large reduction in forest diversity if compared to the pre-harvest conditions (point A). Second, it is possible to improve the provision of non-timber services at a relatively small cost. A shift from point F to E (from conventional to reduced-impact logging practices) entails only a small reduction in NPV. Third, the trade-off between NPV and PVPCI presents a discontinuity (non-convexity) in correspondence to point A. Any linear combination of A and E would achieve a higher value of either NPV or PVPCI, or both than the empty circles or squares of Figure 5. In other words, any solution attained by modifying felling cycles or diameter cutting limits can be 14
improved upon (in both economic and environmental terms) by specializing land use. Under specialized land use, part of the landscape would be managed according to solution A (total conservation) and the other part according to point E (intensive management with RIL). The case of specialized land use with respect to values such as timber and prevented carbon emissions is not so strong. Figure 6 summarizes the trade-off between NPV and PVCE and illustrates how solutions attainable through “multiple use” (empty triangles and diamonds) are not far off from linear combinations of A and E.
VI. Discussion and conclusion The results illustrated by Figure 5 suggest that non-convexities in the forest production set are likely to be empirically significant. Consequently, for certain environmental attributes, specialized use is likely to be superior to multiple use. Similarly to Vincent and Binkley (1993) these results hold even if the forest is perfectly homogeneous. There are however some caveats that need to be considered before considering these as generalizable results. In particular, these results rely on specific choices of environmental indicators5 and how they should be compared over time6, and some assumptions regarding inter-stand interactions7.
5
The use of alternative ecological indicators (particularly with respect to forest diversity) could lead to different results 6 Some controversy exists regarding whether non-market values (such as carbon emissions and forest diversity) should be discounted like monetary values or not. Here we decided to discount non-timber values like timber values. Our views on this issue have been expressed elsewhere (see Boscolo, Vincent and Panayotou 1998). However, simulations using a zero discount rate for non-market values (results not shown) did yield similar results: specialized land use for timber and forest diversity still remained superior to multiple use over a significant range. 7 The indicators used have the characteristics to be independent of their geographic layout. For example, according to the forest diversity indicator employed (PCIt) two large dipterocarp trees have the same ecological value whether they are adjacent to each other or far away from each other. Furthermore, the model does not account for other important location-specific values, for example watershed services. The consideration of such location specific values will influence the superiority of one strategy over the other and should be considered in further research.
15
Whether or not consideration of the above issues will weaken or strengthen the hypothesis of significant non-convexities in the forest production set is unclear and poses an interesting challenge for further research. An interesting question is also to which extent the non-convexities that originated from the simulation exercise are indeed due to technical inefficiencies and fixed costs rather than other possible explanations. For example, as others have highlighted, non-convexities may originate because of complex ecological interactions. To quantify the relative importance of technical constraints in driving these results, I did a quick test where I cast the forest growth model in an optimization framework. In this optimization model NPV is maximized subject to forest productivity (the forest growth model), a 60-year projection period, a 30 or 60 years felling cycles, and varying levels of minimum forest diversity constraints. Selected outputs of such optimization are illustrated in Figures 5 and 6 by filled circles and diamonds respectively. As these points in Figures 5 and 6 illustrate, optimization does reveal the presence of solutions that are superior to the cutting guidelines simulated in section V and often used on the ground. However, they require sophisticated cutting guidelines. For illustration, Table 1 gives the harvesting details corresponding to point Z (NPV=$2098; PVPCI=2.2) of Figure 5. In correspondence to a NPV of about $2,000/ha, the adoption of simple guidelines results in a level of forest diversity of about 2. For the same level of NPV a 10% higher level of forest diversity could be reached by adopting the cutting regime displayed in Table 1. This regime calls for cuttings in all commercial classes. However, only very few classes are cut entirely.
16
Table 1. Cutting regime that maximizes NPV subject to a constraint on forest diversity of 2.2 (see text). Number of trees/ha before logging (virgin stand), logged, and residual. RIL is adopted. 60 years is the optimal felling cycle. Size
Dipterocarps
Commercial non-dipterocarps
Non-commercial
(cm)
Before
Harvest
Residual
Before
Harvest
Residual
Before
Harvest
Residual
10-20
30.50
0.00
25.45
61.50
0.00
51.34
262.30
0.00
218.97
20-30
11.60
0.00
11.60
17.50
0.00
17.50
61.50
0.00
61.50
30-40
5.40
4.62
0.78
8.90
3.49
5.41
19.80
0.00
19.80
40-50
3.90
3.46
0.44
4.60
3.34
1.26
7.20
0.00
7.20
50-60
3.60
1.72
1.88
3.10
1.76
1.34
2.90
0.00
2.90
60-70
2.50
2.50
0.00
1.70
1.70
0.00
0.90
0.00
0.90
70+
5.90
1.61
4.29
1.60
1.60
0.00
0.90
0.00
0.90
This test reveals that the gains from specialization are strongly influenced by the presence of simple (and technically inefficient) cutting guidelines. Furthermore, this test also suggests that the superiority of dominant use over multiple use is likely to be weakened when the influence of high fixed costs and technical constraints is alleviated. In logged over forests, for example, the fixed costs associated with re-harvesting a stand may be significantly lower than the costs associated with harvesting a virgin stand. Or logging may be carried out at smaller scales (e.g., community forestry) where the needs for new roads, inventory and planning are greatly reduced. Under these circumstances, the case for specialized forest use may be weakened. Similarly, the case for multiple use may also be strengthened where the harvesting operators have a good knowledge of the tree species that compose the forest and can manage them correspondingly. This latter situation is not uncommon when forests are managed by indigenous people.
17
Unfortunately, in most commercial forest operations in the tropics, this latter circumstance remains more an exception rather than the rule.
Some conclusions can be drawn from this study. First, the nature of ecological and economic interactions may not always conform to common assumptions made for economic analyses. The re-consideration of these assumptions has policy implications (see, e.g., Swallow et al. 1990). Second, the identification and measurement of the economic trade-offs among conflicting objectives can be a useful exercise in evaluating multiple use strategies. It may be useful to identify which management regimes can significantly reduce environmental damage more costeffectively and whether specialized use is a superior strategy to multiple use. Finally, in absence of actual forestry experiments, these trade-offs can be evaluated with the assistance of simulation models. These models, and the data to build them, can play an important role in improving the use and conservation of tropical forests.
18
References Alverson W.S., W. Kuhlmann, and D.M. Waller (1994), Wild Forests: Conservation Biology and Public Policy, Island Press, Washington D.C. Boscolo M. and J. R. Vincent (2000), “Promoting Better Logging Practices in Tropical Forests: A Simulation Analysis of Alternative Regulations”, Land Economics [forthcoming]. Boscolo M., J. R. Vincent, and T. Panayotou (1998), ‘Discounting Costs and Benefits in Carbon Sequestration Projects”, Development Discussion Paper No. 638, Harvard Institute for International Development, Harvard University. Boscolo M., J. Buongiorno, and T. Panayotou (1997), “Simulating Options for Carbon Sequestration Through Improved Management of a Lowland Tropical Rainforest”, Environment and Development Economics 2(3):239-261. Boscolo M. and J. Buongiorno (1997), “Managing a tropical rainforest for timber, carbon storage, and tree diversity”, Commonwealth Forestry Review 76(4):246-254. Bowes M.D. and J.V. Krutilla (1989), Multiple-Use Management: The Economics of Public Forestlands, Resources for the Future, Washington D.C. Lewis and Schmalensee (1977), Nonconvexity and optimal exhaustion of renewable resources, International Economic Review 18:535-552. Manokaran, N. J.V. LaFrankie, K.M. Kochummen, E.S. Quah, J.E. Klahn, P.S. Ashton and S.P. Hubbell (1990), Methodology for the Fifty Hectare Research Plot at Pasoh Forest Reserve, Research Pamphlet no. 104. FRIM. Panayotou, T. and P. Ashton (1992), Not By Timber Alone. Economics and Ecology for Sustaining Tropical Forests. Island Press. Washington D.C. Peters, C.A., A. Gentry and R. Mendelsohn (1989), ‘Valuation of an Amazonian Rainforest’, Nature 339(June):655-6. Primack, R.B., E.O.K. Chai, S.S. Tan and H.S. Lee (1987), ‘The Silviculture of Dipterocarp Trees in Sarawak, Malaysia. II. Improvement Felling in Primary Forest Stands’, The Malaysian Forester 50(1):43-61. Repetto R. and M. Gillis (1988), Public Policies and the Misuse of Forest Resources, Cambridge University Press, Cambridge, MA. Swallow S.K., P.J. Parks and D.N. Wear (1990), ‘Policy-Relevant Nonconvexities in the Production of Multiple Forest Benefits’, Journal of Environmental Economics and Management 19:264-280.
19
Swallow S.K. and D.N. Wear (1993), ‘Spatial Interactions in Multiple-Use Forestry and Substitution and Wealth Effects for the Single Stand’, Journal of Environmental Economics and Management 25:103-120. Talukdar P. (1996), Economics of Sustainable Resource Management in a Dynamic Optimization Framework, Ph.D. Dissertation, University of Rhode Island. Vincent J.R. and C.S. Binkley (1993), ‘Efficient Multiple-Use Forestry May Require Land-Use Specialization’, Land Economics 69(Nov.):370-76. Wan Razali Wan Mohd (1988), Summary of Growth and Yield Studies in Tropical Mixed Forests of Malaysia. Paper submitted to the FAO as a compilation of training material.
20
Figure 1. Multiple Use with Convex Production Set 1.2 A
Non-Timber Values
1
0.8
Consumption trade-offs (Welfare function)
B
0.6
0.4 Production Trade-offs (Trade-off curve)
Forest Production Set
0.2
C 0 0
0.2
0.4
0.6 Timber Values
21
0.8
1
1.2
Figure 2. Forest Production Set with Fixed Harvesting Costs 1.2
Non-Timber Values
1
0.8
0.6
0.4 M
M' 0.2
0 0
0.2
0.4
0.6 Timber Values
22
0.8
1
1.2
Figure 3. Forest Production Set with Fixed Costs and Technical Constraints 1.2
Non-Timber Values
1
0.8
0.6
0.4 M'' M
M
0.2
0 0
0.2
0.4
0.6 Timber Values
23
0.8
1
1.2
Figure 4. Multiple Use with Non-Convex Production Set 1.2
Non-Timber Values
1
A
0.8
0.6
D
0.4
B
0.2 C 0 0
0.2
0.4
0.6 Timber Values
24
0.8
1
1.2
Figure 5 - NPV and Forest Diversity Trade-offs 2.8
A
Discounted Forest Diversity (max=2.63)
2.6
2.4
Z 2.2
2
E 1.8
F 1.6 0
500
1000
1500
2000
2500
3000
3500
4000
4500
5000
Net Present Value from Timber Sales ($/ha)
Solutions with simple guidelines, 60 yrs cycle
Solutions through optimization, 60 yrs cycle
Full protection solution Solutions with simple guidelines, 30 yrs cycle
CL, Solutions with simple guidelines, 60 yrs cycle
25
Figure 6 - NPV and Carbon Emissions Trade-offs Net Present Value from Timber Sales ($/ha) 0
500
1000
1500
2000
2500
3000
3500
4000
4500
0
Discounted Carbon emissions (tons/ha)
A
20
40
60
E 80
100
F 120
Solutions with simple guidelines, 60 yrs cycle
Solutions through optimization, 60 yrs cycle
Solutions with simple guidelines, 30 yrs cycle
CL, Solutions with simple guidelines, 60 yrs cycle
Full protection solution
h:\papers\ctfs_chp\chapt8.doc
26
5000