transport: (i) maltose, a competitive inhibitor of the glucose transport system ... Keywords: yeast (Saccharomyces), glucose transport, maltose inhibition, ...
Microbiology (1999), 145, 3447–3454
Printed in Great Britain
Strategies to determine the extent of control exerted by glucose transport on glycolytic flux in the yeast Saccharomyces bayanus Jasper A. Diderich,1 Bas Teusink,1 Jeroen Valkier,1 Jorge Anjos,2 Isabel Spencer-Martins,2 Karel van Dam1† and Michael C. Walsh1‡ Author for correspondence : Karel van Dam. Tel : j31 20 525 5510. Fax : j31 20 525 5505. e-mail : k.van.dam!chem.uva.nl
1
E. C. Slater Institute, BioCentrum, University of Amsterdam, Plantage Muidergracht 12, NL-1018 TV Amsterdam, The Netherlands
2
Biotechnology Unit, Faculty of Sciences and Technology, New University of Lisbon, P-2825 Monte de Caparica, Portugal
The extent to which the transport of glucose across the plasma membrane of the yeast Saccharomyces bayanus controls the glycolytic flux was determined. The magnitude of control was quantified by measuring the effect of small changes in the activity of the glucose transport system on the rate of glucose consumption. Two effectors were used to modulate the activity of glucose transport : (i) maltose, a competitive inhibitor of the glucose transport system in S. bayanus (as well as in Saccharomyces cerevisiae) and (ii) extracellular glucose, the substrate of the glucose transport system. Two approaches were followed to derive from the experimental data the flux control coefficient of glucose transport on the glycolytic flux : (i) direct comparison of the steadystate glycolytic flux with the zero trans-influx of glucose and (ii) comparison of the change in glycolytic flux with the concomitant change in calculated glucose transport activity on variation of the extracellular glucose concentration. Both these approaches demonstrated that in cells of S. bayanus grown on glucose and harvested at the point of glucose exhaustion, a high proportion of the control of the glycolytic flux resides in the transport of glucose across the plasma membrane.
Keywords : yeast (Saccharomyces), glucose transport, maltose inhibition, glycolysis, metabolic control analysis (MCA)
INTRODUCTION
The limits of metabolism are often described in terms of maxima : maximal growth rates, maximal enzyme activities, rate-limiting steps, uptake capacities, maximal consumption rates and maximal production rates (Does & Bisson, 1989 ; Mauricio & Salmon, 1992 ; Salmon & Mauricio, 1994 ; Schu$ tz & Gafner, 1995). Through metabolic control analysis (MCA) the basis for these metabolic limits can be quantified at the most fundamental level, the flux through a metabolic pathway (Kacser & Burns, 1973 ; Fell, 1992). MCA enables us to determine to what extent the component enzymes of a metabolic pathway control the flux through that pathway, i.e. which enzymic steps influence the rate limits of .................................................................................................................................................
† Present address : Instituut voor Interdisciplinaire Opleidingen (I2O), Sarphatistraat 104, NL-1018 GV Amsterdam, The Netherlands. ‡ Present address : Heineken Technical Services, Burgemeester Smeetsweg 1, NL-2382 PH Zoeterwoude, The Netherlands. Abbreviation : MCA, metabolic control analysis. 0002-3494 # 1999 SGM
that metabolic pathway. As predicted by theory and amply verified experimentally (Groen et al., 1982 ; Ruyter et al., 1991), this control may be shared by several steps (Kacser & Burns, 1973 ; Westerhoff et al., 1995 ; Van Dam, 1986). Glucose transport has often been described as an important rate-limiting step of glycolysis in yeast (Kotyk & Kleinzeller, 1967 ; Does & Bisson, 1989 ; Gancedo & Serrano, 1989 ; Oehlen et al., 1994 ; Pedler et al., 1997). Supportive evidence for this was provided by the fact that overproduction of the individual glycolytic enzymes in Saccharomyces cerevisiae did not result in an increased glycolytic flux (Heinisch, 1986 ; Schaaff et al., 1989). In this study we quantify the control exerted by glucose transport on the glycolytic flux in Saccharomyces bayanus by MCA. The extent to which the transport of glucose across the plasma membrane controls the glycolytic flux is defined as the relative change in the glycolytic flux (J) resulting from a relative change in the activity of glucose transport 3447
J. A. D I D E R I C H a n d O T H E R S
(vtrans) under a defined set of conditions. In mathematical terms : CJv
trans
l
5
dJ dvtrans l dln J\dln vtrans J vtrans
(1)
Consequently, to determine the control exerted by the glucose transport step on the glycolytic flux one must change the latter activity without affecting other steps in the metabolic pathway. Different approaches can be followed to modulate the activity of glucose transport. Firstly, glucose transport activity could in theory be modulated genetically by regulating the expression of glucose transport proteins with inducible promoters (Ruyter et al., 1991 ; Jensen et al., 1993). However, a suitable inducible promoter for the expression of glucose transporters in yeast has not yet been reported. Furthermore, the complexity of glucose transport in yeast (Reifenberger et al., 1995 ; Kruckeberg, 1996 ; Boles & Hollenberg, 1997), in terms of the numbers of proteins and regulatory mechanisms involved, restricts the choice of a suitable genetic background in which to perform these experiments. In a wild-type background the choice of modulated transporter protein may not only influence the transport activity but also affect the expression of other glucose transport proteins (Theodoris et al., 1994). A background where only one active glucose transport protein is present would be more accessible to this type of analysis ; however, the specific aim of the present study was to determine the control of the glucose transport step in wild-type yeast cells, grown under specific conditions. Secondly, at constant concentration of the transporter enzyme(s), one can modulate the activity of glucose transport with specific effectors, a method which has successfully been applied to determine the metabolic control of the glucose transport step in the parasite causing sleeping sickness, Trypanosoma brucei (Bakker et al., 1999). Several specific inhibitors of glucose transport in cells of eukaryotes have been described. Phloretin, cytochalasin B and maltose have all been shown to inhibit glucose transport in human erythrocytes (Carruthers & Helgerson, 1991). Also, by setting various extracellular glucose concentrations, the glucose transport activity can be specifically modulated. Extracellular glucose as the first metabolite in the glycolytic pathway is a system parameter and not a variable, and as such can be set by the experimenter (Kacser & Burns, 1973 ; Fell, 1992 ; Teusink et al., 1996b). Employing these methods to modulate the glucose transport activity one can probe the control characteristics of glycolysis in both laboratory wild-type strains and industrial strains under physiologically relevant conditions, without the need for genetic modification. METHODS Materials. -[U-"%C]Glucose was purchased from Amersham.
Liquid scintillation fluid was from Packard. Constituents of the growth medium were from Difco. Enzymes were from
3448
Boehringer. Glass microfibre-filters (GF\C) were obtained from Whatman. Other reagents were obtained from Merck or Sigma and of analytical grade or higher. Strain and growth conditions. Experiments for the determination of control of glycolytic flux were performed with S. bayanus IGC 4565 (CBS 378, obtained from I. SpencerMartins, New University of Lisbon, Portugal). In some additional experiments, S. cerevisiae CEN.PK 113-7D (obtained from P. Ko$ tter, Johann Wolfgang Goethe Universitaet, Frankfurt, FRG), S. cerevisiae IGC 5297 (DGI 342, Danisco, Copenhagen, Denmark) and S. cerevisiae X2180 (diploid strain obtained from the Yeast Genetic Stock Center, Berkeley, CA, USA) were used. Cells were grown in batch on a rotary shaker (250 r.p.m.) at 30 mC, in either 2 % (w\v) Yeast Extract, 1 % (w\v) Peptone and 2 % (w\v) glucose ; or in mineral medium with 2 % (w\v) glucose ; or in a medium containing 2 % glucose, 0n67 % (w\v) Yeast Nitrogen Base and 0n1 M potassium phthalate at pH 5n0. Yeast cells were grown to exponential phase (OD approx. 0n5 ; pathlength 1 cm ; &%! Pharmacia), to diauxic shift (i.e. Novaspec II spectrometer, the moment of glucose exhaustion), or through the diauxic shift (i.e. 4–5 h after the diauxic shift, cells growing on ethanol). Cells were harvested by centrifugation at 5000 r.p.m. (4 mC), washed three times in ice-cold 0n1 M KH PO buffer % (pH (pH 6n5), and then kept on ice in 0n1 M KH PO #buffer # % 6n5) until further use. For the experiments from which the control exerted by the glucose transport step was determined, S. bayanus cells that had been harvested at the moment of glucose exhaustion were always used. Glucose consumption assay. Cultured yeast cells were preincubated for 5 min in a stirred thermostated vessel at 30 mC ; an equal volume of a glucose\maltose mixture in 0n1 M phosphate buffer (pH 6n5) was then added. Samples were taken at different times by adding a volume of the glucosemetabolizing cells to an equal volume of 10 % (w\v) trichloroacetic acid. Samples were kept on ice and, after centrifugation and dilution, the remaining glucose was determined. Zero trans-influx assay. Zero trans-influx of glucose was determined according to Walsh et al. (1994a) at 30 mC in 0n1 M phosphate buffer (pH 6n5), and for comparison, by the original method of Bisson & Fraenkel (1983) with some slight modifications, i.e. the assay was performed at 25 mC in 0n1 M Tris\citrate buffer (pH 5). Maltose inhibition of glucose transport was determined by adding maltose and glucose simultaneously. Kinetic parameters of glucose transport were derived using Enzfitter software. Glucose and protein determination. Glucose was determined as described by Bergmeyer (1974). Protein was determined by the Lowry method, using bovine serum albumin (fatty-acid free) as a standard. Both protein and glucose concentrations were measured on COBAS-BIO or COBAS-FARA automatic analysers (Roche). MCA. When extracellular glucose is used to modulate the glucose transport activity, the control of glucose transport on the glycolytic flux may be written as : CJv
trans
l
5
dln J cln vtrans l RJ[G ]\εv[Gtrans] out out dln [Gout] cln [Gout]
(2)
The response coefficient R (the global change in flux J as an effect of a change in the concentration of extracellular glucose [Gout]) in equation 2 can be derived from the determination of the glycolytic flux (J) as a function of the extracellular glucose concentration ([Gout]).
Control of glycolytic flux in yeast
E
G
1 (skp) Km " vtrans l Vmax " s p sp 1j j jα Km Km (Km )# H F " " " E G 1 (skp) Km # jVmax (3) # s p sp 1j j jα Km Km (Km )# H F # # # The s and p in this rate equation are the concentrations of the substrate and product of the carrier system, i.e. glucose outside (Gout) and glucose inside (G in) the cell, respectively. It is assumed that the glucose transport step is only connected to the rest of metabolism by the pool of intracellular glucose (p). Vmax is the maximal transport activity of the corresponding component and Km the apparent Michaelis–Menten constant for glucose of the corresponding component. The ‘ interactive constant ’ α is a constant relating the mobilities of the free and the loaded sugar carriers. The interactive constant was set to 0n91 (Kotyk, 1967 ; Teusink et al., 1998a). The elasticity coefficient could then be derived by calculating the effect of a small change in extracellular glucose (s) on the steady-state activity of glucose transport (vtrans), keeping terms that are connected to other steps in glycolysis (in this case intracellular glucose, p) constant. The flux control coefficient of glucose transport on the glycolytic flux is the quotient of the response coefficient and the elasticity coefficient (equation 2).
RESULTS AND DISCUSSION Competitive inhibition of glucose transport by maltose
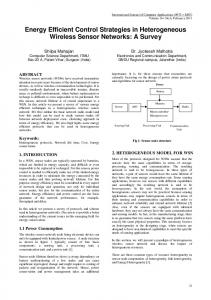
The aim of the present study was to measure the extent of control exerted by the glucose transport step under a particular well-defined condition, in this case the diauxic shift (i.e. the point of glucose exhaustion) of cells of S. bayanus grown in batch on 2 % glucose. The control exerted by glucose transport was determined by modulating the glucose transport activity with the extracellular glucose concentration and by using maltose, which was found to be a competitive inhibitor of glucose transport in yeast. Cells of S. bayanus harvested at the diauxic shift exhibited biphasic kinetics (Fig. 1). In S. cerevisiae, such biphasic kinetics have been taken to be a consequence of the presence of hexose transporters with low, moderate or high affinity for glucose (Reifenberger et al., 1997, Diderich et al., 1999). The apparent kinetic characteristics of the glucose uptake system shown in Fig. 1 were fitted assuming two distinct Michaelis–Menten type carriers : a high-affinity carrier with an apparent Km
800 v [nmol min–1 (mg protein)–1]
The elasticity coefficient ε (the local change in glucose transport activity vtrans as an effect of a change in the concentration of extracellular glucose [Gout]) can be derived from the kinetic parameters of glucose transport. In cells harvested at the diauxic shift, the kinetics of glucose transport were fitted to a system with two components. Assuming two symmetric four-state carriers, the rate equation of glucose uptake (i.e. the steady-state activity of glucose transport) can be written as :
600
400
200
50 v/s [nmol
100 min–1
(mg
150
protein)–1
200
mM–1]
.................................................................................................................................................
Fig. 1. Eadie–Hofstee plot of the inhibition of the zero transinflux of glucose by maltose in cells of S. bayanus IGC 4565 grown on YEP/2 % glucose to the diauxic shift. Zero trans-influx of glucose was measured in the absence ( ) and presence ( ) of 100 mM maltose. v is the zero trans-influx of glucose and s is the extracellular glucose concentration. Lines represent kinetic fits (see Table 1).
of 1n5 (p0n1) mM and a Vmax of 277 (p25) nmol min−" (mg protein)−" and a low-affinity carrier with an apparent Km of 34 (p10) mM and Vmax of 339 (p23) nmol min−" (mg protein)−". In the presence of 100 mM maltose the zero trans-influx of glucose was inhibited (see Fig. 1 and Table 1). This effect of maltose has the characteristics of competitive inhibition towards glucose transport, i.e. the Vmax remains constant whilst the apparent Km increases. Under these conditions, the best fit of the glucose uptake kinetics was obtained with a single component consisting of an apparent Km of 10 (p0n4) mM and a Vmax of 600 (p19) nmol min−" (mg protein)−". From these data it was not possible to distinguish accurately two components of glucose transport ; consequently it was not possible to estimate a separate Ki of maltose for each component of the glucose transport system. In cells of S. bayanus IGC 4565 harvested in exponential phase (OD 0n5, see Methods), the zero trans-influx &%! kinetics of glucose transport fitted to a one-component uptake system (Table 1). This component was also competitively inhibited by maltose although the calculated Ki was very high (approx. 300 mM), a concentration of maltose that yeast cells encounter for instance in wort. In cells of S. bayanus harvested 4 h after the diauxic shift, the kinetics of glucose transport again fitted to a one-component uptake system with a relatively low Km (2n9 mM). As in the previous two cases, this activity was competitively inhibited by maltose (Ki l 26 mM, see Table 1). The observed kinetics of glucose uptake in S. bayanus are very similar to those of S. cerevisiae. In wild-type 3449
J. A. D I D E R I C H a n d O T H E R S
Table 1. The inhibition constant (Ki) of maltose on glucose transport for different species of Saccharomyces at different growth states .....................................................................................................................................................................................................................................
Cells of S. bayanus and S. cerevisiae were grown on YEP\2 % glucose and harvested at various times during growth. Yeast cells were grown to exponential phase, to diauxic shift, to just after the diauxic shift (early ethanol) or through the diauxic shift (ethanol). Zero trans-influx of glucose was measured as described in Methods with and without the simultaneous addition of maltose. The data were fitted to a model of a two-component uptake system (referred to as 1 and 2 in the table) for the S. bayanus cells harvested at the diauxic shift and to a model of a single uptake system for cells harvested at other times. Species
Strain
S. bayanus S. bayanus
IGC 4565 IGC 4565
S. bayanus S. cerevisiae S. cerevisiae
IGC 4565 CEN.PK 113-7D IGC 5297
Growth phase
Km (mM)
Ki (mM)
Exponential Diauxic shift (1) Diauxic shift (2) Ethanol Early ethanol Early ethanol
27p2n9 1n5p0n1 34p10 2n9p0n2 1n8p0n2 1n1p0n3
307 (50) (300) 26 23 23
strains of the latter (CEN.PK 113-7D and IGC 5297), grown on 2 % glucose and harvested after glucose exhaustion, glucose transport kinetics could be fitted to one high-affinity component (Km of 1n8 and 1n1 mM, respectively). This component was also competitively inhibited by maltose, with a Ki of 23 mM (Table 1) for both strains.
maltose is an inhibitor of glucose transport with a site of inhibition that is located on the external face of the plasma membrane. Similar findings have been described in human erythrocytes, i.e. that maltose is a competitive inhibitor of glucose transport, binding at or close to the sugar influx site (Lacko & Burger, 1962 ; Carruthers & Helgerson, 1991).
In S. cerevisiae, it is known that growth on glucose inactivates maltose permease and represses transcription of MAL genes whereas maltose induces the transcription of MAL genes. S. cerevisiae and S. bayanus are two closely related species within the group Saccharomyces sensu stricto of the genus Saccharomyces (VaughanMartini & Martini, 1989), which have just a few differential phenotypic characteristics (Rodrigues de Sousa et al., 1995). No significant differences have been reported with respect to the transport of either glucose or maltose in these species (Oda & Tonomura, 1996). Indeed, in the yeast S. bayanus, during growth on glucose, maltose uptake could not be detected and only a very low maltase activity was present (data not shown).
Assuming that the competitive inhibition is caused by the binding of one of the glucose residues of maltose to the extracellular glucose-binding site of the glucose transporter, we wondered whether there was a correlation between the structure of the disaccharide and the inhibition of glucose transport, as previously suggested by Lacko & Burger (1962). Maltose inhibits glucose transport in different yeasts of the genus Saccharomyces ; however, other disaccharides of glucose, cellobiose, isomaltose and α,α-trehalose, did not cause significant inhibition (data not shown). This suggests that only the 1,4- α linked disaccharide is in a conformation which permits binding to the glucose transport protein. In the case of the other disaccharides, the conformation of the second glucose with respect to the first prevents binding and hence prevents inhibition of the glucose transport protein.
In Trichomonas vaginalis it was shown that the inhibition of glucose transport by maltose is a timedependent phenomenon caused by the extracellular hydrolysis of maltose to two glucose molecules by an αglucosidase (Ter Kuile & Mu$ ller, 1995). This is clearly not the case in S. bayanus and S. cerevisiae since both the zero trans-influx of glucose and the glucose consumption rate were inhibited by maltose to a similar extent. Furthermore, preincubation with maltose prior to zero trans-influx measurements did not affect the apparent kinetics of glucose transport (data not shown). In the S. cerevisiae wild-type strain X2180, which lacks the maltose permease and does not grow on maltose, we found that glucose consumption and zero trans-influx of glucose are both inhibited by maltose (data not shown) in cells grown on glucose. This strongly suggests that 3450
Determination of the control of glycolytic flux by glucose transport in S. bayanus (i) Direct comparison of zero trans-influx and the rate of glycolysis. The capacity (V ) or the concentration of an
max
enzyme has often been used as a qualitative measure of the degree to which a step in a metabolic pathway influences the rate limits of that pathway. The term ‘ rate-limiting step ’ has often been used for the step with the lowest capacity. In this study we examine the control exerted by glucose transport on the glycolytic flux in a more quantitative manner. The glycolytic flux was measured as the steady-state glucose consumption rate. Other measures of the glycolytic flux such as the
Control of glycolytic flux in yeast
(p0n04), which suggests that all the control of the glycolytic flux is in the transport of glucose across the plasma membrane ; in other words glucose transport is the rate-limiting step of glycolysis (Fig. 2).
7
In J
6
5
4
3
3
4
5 In vzero-trans
6
7
.................................................................................................................................................
Fig. 2. Double logarithmic plot of the zero trans-influx of glucose (vzero-trans) and the glucose consumption flux (J). The zero trans-influx of glucose and flux were modulated by varying glucose and/or maltose concentrations. Cells of S. bayanus IGC 4565 were grown on YEP/2 % glucose to the diauxic shift. The rate of glucose consumption (J) and the zero trans-influx (vzero-trans) of glucose were measured as described in Methods in the absence ( ) and presence ( ) of 100 mM maltose. The rate of glucose consumption (J) and the zero trans-influx of glucose (vzero-trans) are expressed in nmol min−1 (mg protein)−1.
production of ethanol or CO (Oehlen et al., 1994) or the # heat flux (Teusink et al., 1996a) would add an extra degree of complexity to the determination of the control exerted by glucose transport on the glycolytic flux due to the branched nature of the glycolytic network and the potential redistribution to and from the storage carbohydrates and into glycerol. Significant differences have been documented in the product patterns of S. cerevisiae as a function of strain and growth conditions (Pedler et al., 1997). The rate of glucose consumption by S. bayanus cells harvested at the diauxic shift was measured at different extracellular concentrations of glucose in the absence and presence of 100 mM maltose and compared to the zero trans-influx of glucose (Fig. 2). To compare the rate of glucose consumption at a certain extracellular glucose concentration with the zero trans-influx of glucose at that concentration, the latter was calculated from the kinetic fit (Fig. 1 and Table 1). If the rate of glucose consumption is compared with the zero trans-influx of glucose, it is apparent that the zero trans-influx is always in excess over the glucose consumption rate. This might suggest that the glucose transport step is not the rate-limiting step of glycolysis. In terms of MCA, the control exerted by the glucose transport step will be between 0 and 1, whereas a ratelimiting step would have a control of 1. However, if the relative change in flux is compared with the relative change in the zero trans-influx of glucose by making a ln vzero-trans versus ln J plot, it is found that the linearly fitted data resulted in a control coefficient of 1n04
(ii) Calculation on the basis of carrier kinetics. In the approach used above, the glycolytic flux at a particular extracellular glucose concentration was compared to the zero trans-influx of glucose at that concentration. The zero trans-influx rate of glucose, however, does not represent the actual activity of glucose transport under steady-state conditions. Glucose transport is connected to the rest of metabolism by intermediary pools of metabolites, most obviously the product of the glucose transport step, intracellular glucose (Walsh et al., 1994a ; Smits et al., 1996). Glucose transport can be stimulated or inhibited by various metabolites, the concentrations of which are determined by the total set of kinetic parameters of metabolism. Ideally, the steady-state activity of glucose transport is described by a rate equation (e.g. equation 3). For a condition where the glucose transport kinetics could be described by a one(low Km) component glucose transport system (Teusink et al., 1998a), it was shown that the difference between the zero trans-influx rate and the rate of glucose consumption could be explained fully by the effect of a pool of intracellular glucose. However, the kinetics of a high-Km uptake system led to an underestimation of the actual steady-state rate of glucose consumption. This anomaly remains unexplained.
In the present study we show how the control exerted by glucose transport can be derived mathematically, using experimental data, with a rate equation that describes glucose transport as a two-component transport system that is only connected to the rest of metabolism by the pool of intracellular glucose (equation 3). It should be noted that this rate equation is a very simple description of a two-component glucose transport system. If one or both of the components of glucose transport exhibit more complex kinetics, such as asymmetry or cooperativity, then the rate equation and therefore the derivation of the elasticities would also be more complex, which would have implications for the experimental determination of the control exerted by the glucose transport step. More research would be necessary to derive a rate equation of steady-state glucose transport activity that models the inhibition by maltose of a multi-component glucose transport system. As was explained in Methods, the calculation of the flux control coefficient (i.e. the relative change in the glycolytic flux as a result of a relative change in the glucose transport activity) involves the division of the response coefficient by the elasticity coefficient (equation 2) ; in other words, the global change in the flux J as an effect of a local change in the glucose transport activity vtrans. The response coefficient can be determined by measuring the glycolytic flux (the glucose consumption rate) as a function of the parameter modulated i.e. the concentration of extracellular glucose. The flux vs extracellular 3451
J. A. D I D E R I C H a n d O T H E R S
concentration of extracellular glucose was derived by comparing the zero trans-influx of glucose and the glucose consumption rate at that concentration of extracellular glucose (equation 3 ; Teusink et al., 1998a). The elasticity or the derivative of ln vtrans vs ln (extracellular glucose) was then derived by calculating the effect of a small change in the natural logarithm of the extracellular glucose concentration on the natural logarithm of the steady-state glucose transport activity, keeping the concentration of intracellular glucose constant.
Flux response coefficient
1·0
0·75
0·50
0·25
50
100 150 s (mM)
200
250
.................................................................................................................................................
(RJ[Gout])
Fig. 3. The flux response coefficient of glucose consumption (J) towards extracellular glucose concentration (s). Cells of S. bayanus IGC 4565 were grown on YEP/2 % glucose to the diauxic shift. Glucose consumption was measured at various concentrations of extracellular glucose. The response coefficient was obtained as explained in the text.
Flux control coefficient
2·0
1·5
1·0
0·5
50
100 150 s (mM)
200
250
.................................................................................................................................................
Fig. 4. The flux control coefficient (CJvtrans) of glucose transport activity on the rate of glucose consumption (glycolytic flux, J) as a function of extracellular glucose concentration (s). Cells of S. bayanus IGC 4565 were grown on YEP/2 % glucose to the diauxic shift. The flux control coefficient was obtained by dividing the flux response coefficient (Fig. 3) by the elasticity coefficient (see text).
glucose was smoothed by fitting a cubic spline in linear space. The slope (dJ\ds) thus determined was scaled in each point by multiplying by the respective extracellular glucose concentration and dividing by the flux [R l (dJ\ds)i(s\J )], to yield the flux response coefficient (Fig. 3). The elasticity coefficient was derived by calculating the steady-state activity of glucose transport (equation 3) as a function of the concentration of extracellular glucose. The kinetic parameters in equation 3 were determined by measuring the zero trans-influx of glucose (Table 1). The concentration of intracellular glucose at each 3452
Finally, the flux control coefficients (Fig. 4) were calculated by dividing the response coefficients by the respective elasticity coefficients (equation 2). By using this more complicated method, we arrived at the same conclusion : when cells of S. bayanus are grown on 2 % glucose and harvested at the diauxic shift, the flux control coefficient of the glucose transport step on the glycolytic flux is high (Fig. 4). At each extracellular glucose concentration, more than half of the control of the glycolytic flux resides in the glucose transport step. In glucose-limited chemostats it was shown that yeast cells evolved in time and showed enhanced relative fitness (and yield), which correlated with increased expression levels of high affinity glucose transporters and an increased zero trans-influx of glucose. This had already indicated indirectly the important role of the glucose transporters in metabolism (Brown et al., 1998). The estimated concentration of intracellular glucose was verified by the method of De Koning & Van Dam (1992). This method may give a value for intracellular glucose that is too high (Teusink et al., 1998a) since it does not correct for glucose bound to the cell. Thus, these values give a maximal intracellular glucose concentration. For example, at an extracellular concentration of 200 mM, an intracellular glucose concentration of 4 mM was measured, which results in a control coefficient (C) exerted by the glucose transport step of 0n61. When the intracellular glucose concentration was calculated from the comparison of the glucose consumption and the zero trans-influx of glucose, a value of 2 mM was found and the derived control coefficient is 0n75. We conclude that the exact value of the flux control coefficient is dependent on the concentration of intracellular glucose, but the derived flux control coefficient of glucose transport is always high (i.e. more than half of the control is in the glucose transport step). From the distribution in the calculated control coefficients (Fig. 4) it can be estimated that the error in the control coefficients is around 20 %. Flux control coefficients of more than 1 were calculated in some cases when the extracellular glucose concentration was high. At higher extracellular glucose, relatively more flux occurs through the low-affinity component. It was mentioned above that in cells of S. cerevisiae harvested in exponential phase the glucose consumption rate was higher than calculated from the kinetic characteristics of glucose transport and the concentration of intracellular glucose (Teusink et al.,
Control of glycolytic flux in yeast
1998a). Such cells only show low-affinity kinetics of glucose transport (Walsh et al., 1994a). These authors concluded that the low-affinity component was underestimated. Cells of S. bayanus harvested at the diauxic shift show dual kinetics, a high-affinity component and a low-affinity component (Fig. 1). If we incorporated an increased low-affinity component in our calculations, we found that the control exerted by glucose transport on the glycolytic flux at higher extracellular glucose concentrations decreased (not shown). However, the anomalous behaviour of cells containing only a lowaffinity glucose uptake system needs to be further investigated. In this study we show how the control exerted by the glucose transport step on the glycolytic flux can be derived on a quantitative basis. From our results we conclude that a high proportion of the control of the glycolytic flux resides in the glucose transport step. The fact that the glucose transport capacity is always in excess over the glucose consumption rate and the presence of intracellular glucose (Teusink et al., 1998a) does not prove that the control exerted by glucose transport on glycolysis is low since it might also be a result of the metabolic steps following the glucose transport step. The Km for glucose of the hexokinases (0n1–0n2 mM) and glucokinase (0n03 mM) in S. cerevisiae is far below the measured and calculated concentration of intracellular glucose (Teusink et al., 1998a). This might suggest that glucose should be phosphorylated at the maximal velocity ; however, the apparent Km of hexokinase may be increased by competitive inhibition by trehalose 6-phosphate (Bla! zquez et al., 1993) or by a direct interaction with trehalose-6-phosphate synthase (Thevelein & Hohmann, 1995). The interaction of the Tps system with hexokinase has been suggested to regulate the influx into glycolysis (Thevelein & Hohmann, 1995 ; Walsh et al., 1994b ; Teusink et al., 1998b) ; in the absence of the Tps system, glycolysis overflows. Differences between the glucose consumption rate and the zero trans-influx of glucose, as well as the presence of intracellular glucose, may thus arise as effects of the metabolic steps following the glucose transport step. ACKNOWLEDGEMENTS We are very grateful to Johann M. Rohwer for help with the MCA and Le! onie M. Raamsdonk for critical reading of the manuscript. This work was supported by the Foundation for Chemical Research (SON), which is subsidized by the Netherlands Organization for Scientific Research (NWO) and the Netherlands Association for Biotechnological Research Centres (ABON). We also acknowledge the financial support of the European Union, grant no. BIO4-CT95-0107 of the BIOTECH program.
REFERENCES Bakker, B. M., Walsh, M. C., Ter Kuile, B. H., Mensonides, F. I. C., Michels, P. A. M., Opperdoes, F. R. & Westerhoff, H. V. (1999).
Contribution of glucose transport to the control of the glycolytic flux in Trypanosoma brucei. Proc Natl Acad Sci USA 96, 10098–10103.
Bergmeyer, H. U. (1974). Methods of Enzymatic Analysis.
Weinheim : Verlag Chemie. Bisson, L. F. & Fraenkel, D. G. (1983). Involvement of kinases in
glucose and fructose uptake by Saccharomyces cerevisiae. Proc Natl Acad Sci USA 80 , 1730–1734. Bla! zquez, M. A., Lagunas, R., Gancedo, C. & Gancedo, J. M. (1993). Trehalose-6-phosphate, a new regulator of yeast glycolysis
that inhibits hexokinases. FEBS Lett 329, 51–54. Boles, E. & Hollenberg, C. P. (1997). The molecular genetics of hexose transport in yeasts. FEMS Microbiol Rev 21, 85–111. Brown, C. J., Todd, K. M. & Rosenzweig, R. F. (1998). Multiple duplications of yeast hexose transport genes in response to selection in a glucose-limited environment. Mol Biol Evol 15, 931–942. Carruthers, A. & Helgerson, A. L. (1991). Inhibition of sugar transport produced by ligands binding at opposite sides of the membrane. Evidence for simultaneous occupation of the carrier by maltose and cytochalasin B. Biochemistry 30, 3907–3915. De Koning, W. & Van Dam, K. (1992). A method for the determination of changes of glycolytic metabolites in yeast on a subsecond time scale using extraction at neutral pH. Anal Biochem 204, 118–123. Diderich, J. A., Schepper, M., van Hoek, P. & 8 other authors (1999). Glucose uptake kinetics and transcription of HXT genes
in chemostat cultures of Saccharomyces cerevisiae. J Biol Chem 274, 15350–15359. Does, A. L. & Bisson, L. F. (1989). Comparison of glucose uptake kinetics in different yeasts. J Bacteriol 171, 1303–1308. Fell, D. A. (1992). Metabolic control analysis : a survey of its theoretical and experimental development. Biochem J 286, 313–330. Gancedo, C. & Serrano, R. (1989). Energy-yielding Metabolism. London : Academic Press. Groen, A. K., Wanders, R. J. A., Westerhoff, H. V., Van der Meer, R. & Tager, J. M. (1982). Quantification of the contribution of
various steps to the control of mitochondrial respiration. J Biol Chem 257, 2754–2757. Heinisch, J. (1986). Isolation and characterization of the two structural genes coding for phosphofructokinase in yeast. Mol Gen Genet 202, 75–82. Jensen, P. R., Westerhoff, H. V. & Michelsen, O. (1993). The use of lac-type promoters in control analysis. Eur J Biochem 211, 181–191. Kacser, H. & Burns, J. A. (1973). The control of flux. Symp Soc Exp Biol 27, 65–104. Kotyk, A. (1967). Mobility of the free and of the loaded monosaccharide carrier in Saccharomyces cerevisiae. Biochim Biophys Acta 135, 112–119. Kotyk, A. & Kleinzeller, A. (1967). Affinity of the yeast membrane carrier for glucose and its role in the Pasteur effect. Biochim Biophys Acta 135, 106–111. Kruckeberg, A. L. (1996). The hexose transporter family of Saccharomyces cerevisiae. Arch Microbiol 166, 283–292. Lacko, L. & Burger, M. (1962). Interaction of some disaccharides with the carrier system for aldoses in erythrocytes. Biochem J 83, 622–625. Mauricio, J. C. & Salmon, J. M. (1992). Apparent loss of sugar transport activity in Saccharomyces cerevisiae may mainly account for maximum ethanol production during alcoholic fermentation. Biotechnol Lett 14, 577–582. Oda, Y. & Tonomura, K. (1996). Detection of maltose fermentation 3453
J. A. D I D E R I C H a n d O T H E R S
genes in the baking yeast strains of Saccharomyces cerevisiae. Lett Appl Microbiol 23, 266–268.
Teusink, B., Larsson, C., Diderich, J., Richard, P., Van Dam, K., Gustafsson, L. & Westerhoff, H. V. (1996a). Synchronized heat
Oehlen, L. J. W. M., Scholte, M. E., De Koning, W. & Van Dam, K. (1994). Decrease in glycolytic flux in Saccharomyces cerevisiae
flux oscillations in yeast cell populations. J Biol Chem 271, 24442–24448.
cdc35-1 cells at restrictive temperature correlates with a decrease in glucose transport. Microbiology 140, 1891–1898. Pedler, S., Wallace, P. G., Wallace, J. C. & Berry, M. N. (1997). The fate of glucose in strains S288C and S173-6B of the yeast Saccharomyces cerevisiae. Yeast 13, 119–125. Reifenberger, E., Freidel, K. & Ciriacy, M. (1995). Identification of novel HXT genes in Saccharomyces cerevisiae reveals the impact of individual hexose transporters on the glycolytic flux. Mol Microbiol 16, 157–167. Reifenberger, E., Boles, E. & Ciriacy, M. (1997). Kinetic characterization of individual hexose transporters of Saccharomyces cerevisiae and their relation to the triggering mechanisms of glucose repression. Eur J Biochem 245, 324–333.
Teusink, B., Walsh, M. C., Van Dam, K., Gustafsson, L. & Westerhoff, H. V. (1996b). The extent to which the glycolytic flux
Rodrigues de Sousa, H., Madeira-Lopes, A. & Spencer-Martins, I. (1995). The significance of active fructose transport and maxi-
mum temperature for growth in the taxonomy of Saccharomyces sensu stricto. Syst Appl Microbiol 18 , 44–51. Ruyter, G. J. G., Postma, P. W. & Van Dam, K. (1991). Control of glucose metabolism by enzyme IIGlc of the phosphoenolpyruvatedependent phosphotransferase system in Escherichia coli. J Bacteriol 173, 6184–6191. Salmon, J. M. & Mauricio, J. C. (1994). Relationship between sugar uptake kinetics and total sugar consumption in different industrial Saccharomyces cerevisiae strains during alcoholic fermentation. Biotechnol Lett 16, 89–94. Schaaff, I., Heinisch, J. & Zimmermann, F. K. (1989). Overproduction of glycolytic enzymes in yeast. Yeast 5, 285–290. Schu$ tz, M. & Gafner, J. (1995). Lower fructose uptake capacity of genetically characterized strains of Saccharomyces bayanus compared to strains of Saccharomyces cerevisiae : a likely cause of reduced alcoholic fermentation activity. Am J Enol Vitic 46, 175–180. Smits, H. P., Smits, G. J., Postma, P. W., Walsh, M. C. & Van Dam, K. (1996). High-affinity glucose uptake in Saccharomyces
cerevisiae is not dependent on the presence of glucose phosphorylating enzymes. Yeast 12, 439–447. Ter Kuile, B. H. & Mu$ ller, M. (1995). Maltose utilization by extracellular hydrolysis followed by glucose transport in Trichomonas vaginalis. Parasitology 110, 37–44.
3454
in Saccharomyces cerevisiae is controlled by the glucose transport system varies with the extracellular glucose concentration. In 7th International Meeting on Biothermokinetics, pp. 417–421. Edited by H. V. Westerhoff, J. L. Snoep, J. E. Wijker, F. E. Sluse & B. N. Kholodenko. Louvain-la-Neuve : BioThermoKinetics Press. Teusink, B., Diderich, J. A., Westerhoff, H. V., Van Dam, K. & Walsh, M. C. (1998a). Intracellular glucose concentration in
derepressed yeast cells consuming glucose is high enough to reduce the glucose transport rate by 50 %. J Bacteriol 180, 556–562. Teusink, B., Walsh, M. C., Van Dam, K. & Westerhoff, H. V. (1998b). The danger of metabolic pathways with turbo design.
Trends Biochem Sci 23, 162–169. Theodoris, G., Fong, N. M., Coons, D. M. & Bisson, L. F. (1994).
High-copy suppression of glucose transport defects by HXT4 and regulatory elements in the promoters of the HXT genes in Saccharomyces cerevisiae. Genetics 137, 957–966. Thevelein, J. M. & Hohmann, S. (1995). Trehalose synthase : guard to the gate of glycolysis in yeast ? Trends Biochem Sci 20, 3–10. Van Dam, K. (1986). Biochemistry is a quantitative science. Trends Biochem Sci 11, 13–14. Vaughan-Martini, A. & Martini, A. (1989). A Proposal for the Correct Nomenclature of the Domesticated Species of the Genus Saccharomyces. London : Elsevier. Walsh, M. C., Smits, H. P., Scholte, M. & Van Dam, K. (1994a).
Affinity of glucose transport in Saccharomyces cerevisiae is modulated during growth on glucose. J Bacteriol 176, 953–958. Walsh, M. C., Smits, H. P. & Van Dam, K. (1994b). Respiratory inhibitors affect incorporation of glucose into Saccharomyces cerevisiae, but not the activity of glucose transport. Yeast 10, 1553–1558. Westerhoff, H. V., Kholodenko, B. N., Cascante, M. & Van Dam, K. (1995). Elusive control. J Bioenerg Biomembr 27, 491–497. .................................................................................................................................................
Received 14 May 1999 ; revised 24 August 1999 ; accepted 25 August 1999.