Brinza et al. BMC Genomics 2010, 11:666 http://www.biomedcentral.com/1471-2164/11/666
RESEARCH ARTICLE
Open Access
Structure and dynamics of the operon map of Buchnera aphidicola sp. strain APS Lilia Brinza1*, Federica Calevro1,3, Gabrielle Duport1, Karen Gaget1, Christian Gautier2,3, Hubert Charles1,3
Abstract Background: Gene expression regulation is still poorly documented in bacteria with highly reduced genomes. Understanding the evolution and mechanisms underlying the regulation of gene transcription in Buchnera aphidicola, the primary endosymbiont of aphids, is expected both to enhance our understanding of this nutritionally based association and to provide an intriguing case-study of the evolution of gene expression regulation in a reduced bacterial genome. Results: A Bayesian predictor was defined to infer the B. aphidicola transcription units, which were further validated using transcriptomic data and RT-PCR experiments. The characteristics of B. aphidicola predicted transcription units (TUs) were analyzed in order to evaluate the impact of operon map organization on the regulation of gene transcription. On average, B. aphidicola TUs contain more genes than those of E. coli. The global layout of B. aphidicola operon map was mainly shaped by the big reduction and the rearrangements events, which occurred at the early stage of the symbiosis. Our analysis suggests that this operon map may evolve further only by small reorganizations around the frontiers of B. aphidicola TUs, through promoter and/or terminator sequence modifications and/or by pseudogenization events. We also found that the need for specific transcription regulation exerts some pressure on gene conservation, but not on gene assembling in the operon map in Buchnera. Our analysis of the TUs spacing pointed out that a selection pressure is maintained on the length of the intergenic regions between divergent adjacent gene pairs. Conclusions: B. aphidicola can seemingly only evolve towards a more polycistronic operon map. This implies that gene transcription regulation is probably subject to weak selection pressure in Buchnera conserving operons composed of genes with unrelated functions.
Background Understanding the regulation of gene expression necessitates deciphering how organisms sense their environment and respond to it. The topic is even more crucial when looking at tight symbiotic interactions within which partners maintain biochemical relationships shaping in a drastic way their genomes. Our study is focused on Buchnera aphidicola, the primary endosymbiont of aphids, and one of the most studied obligate intracellular bacteria of insects, and analyzes the evolution of the
* Correspondence:
[email protected] 1 INSA-Lyon, UMR203 BF2I, INRA, Biologie Fonctionnelle Insectes et Interactions, Bât. Louis Pasteur 20 ave. Albert Einstein, F-69621 Villeurbanne, France Full list of author information is available at the end of the article
regulation of gene expression in the context of intracellular symbiosis. In prokaryotes, gene expression and gene regulation are governed by diversified and highly evolving mechanisms [1]. In the free-living bacteria so far studied, genes are under the combined control of several mechanisms which can be enumerated following the flow of information from the gene structure to protein function: the gene copy number, the susceptibility of a gene to be transcribed (governed by the initiation transcription rate, the elongation and termination efficiencies), the composition of the transcription units (TUs), the stability and the degradation of the mRNA, the efficiency with which the mRNA is translated (mainly the codon usage), and the effect of post-translational modifications. Prokaryotic TUs may contain either one (monocistronic)
© 2010 Brinza et al; licensee BioMed Central Ltd. This is an Open Access article distributed under the terms of the Creative Commons Attribution License (http://creativecommons.org/licenses/by/2.0), which permits unrestricted use, distribution, and reproduction in any medium, provided the original work is properly cited.
Brinza et al. BMC Genomics 2010, 11:666 http://www.biomedcentral.com/1471-2164/11/666
or several (polycistronic) distinct juxtaposed genes, all controlled by a common regulatory region and transcribed into one long mRNA molecule. Finally, more general regulation mechanisms, such as chromosome topology (e.g., chromosome supercoiling), have also been reported to control global gene transcription physically [2]. Until 10 years ago, it was thought that the control of expression at the transcription initiation level was the dominant form of regulation in prokaryotes, for obvious reasons of efficiency and economy [1]. This assumption seemed natural given the apparent simplicity of prokaryotic transcriptomes (the small proportion of non-coding sequences, and lack of introns and alternative splicing). However, very recently, new technologies have highlighted the complexity and dynamic nature of gene regulation in prokaryotes (e.g., detection of sRNA, modulation of operon structures, antisense transcription) [3]. Our bacterial model, B. aphidicola, has a close phylogenetic relationship with the large-genome free-living bacterium Escherichia coli; the B. aphidicola genome is essentially an E. coli subset [4]. Since its association with aphids began, about 150-200 MY ago [5,6], B. aphidicola has undergone major genomic modifications as a result of its intracellular lifestyle: a major AT bias (70% of the genome consists of AT bases); genome shrinkage (B. aphidicola sequenced genomes range from 420 kb to 650 kb, while the last common ancestor shared with E. coli had approximately 2 Mb); a rapid evolutionary rate and lack of recombination [7-9]. Genomic analysis of B. aphidicola from the pea aphid, Acyrthosiphon pisum (BAp), has revealed the absence of genes encoding for the regulatory systems usually found in E. coli and Proteobacteria [10]. Indeed, two-component regulatory systems are absent. In addition, only two sigma factors are present in BAp: rpoD and rpoH. None of the orthologous regulators of the operons that encode the enzymes of the essential amino acids pathways in E. coli are present in B. aphidicola [10]. The genes of B. aphidicola have no leader sequences, and the bacterium does not use attenuation systems [10]. The genes encoding adenylate cyclase (cyaA) and the AMPc receptor (crp) are also absent in BAp, indicating that it can survive only on a glucose carbon source [10]. However, there is experimental evidence of gene expression regulation in Buchnera, since nutritional osmotic stress or organ and embryonic stage specificities are associated with differing gene expression profiles [11,12]. It is difficult to address the question of gene regulation in B. aphidicola, because of the impossibility of direct experimentation on this un-culturable bacterium. Promoter identification also seems to be compromised by the strong AT-bias of the intergenic regions. In this context, we decided to study the TUs of B. aphidicola,
Page 2 of 16
and the first part of our work was devoted to predicting the TUs of B. aphidicola and its operon map (i.e., the overall polycistronic TU layout as defined by Edwards [13]). The operon map is a highly dynamic structure, its evolution is governed locally by sequence evolution (base mutations), and more generally by genome rearrangements (e.g. inversions, transpositions, deletions, insertions and duplications). Both processes affect not only the genomic elements involved in gene expression regulation, such as promoters and terminators, but also the overall organization of these elements on the chromosome (gene order, proximity, strand, etc.). The methods predicting the composition of TUs (i.e. the genes each TU contains) are basically classifiers (supervised or unsupervised) assigning the pairs of adjacent genes to either the intra-TU class, or the inter-TU class. Most frequently, statistical approaches are used to develop these classifiers. Several features of the adjacent gene pairs, such as the intergenic distance, the conservation of gene pairs across multiple genomes, the functional similarity between adjacent genes, the involvement of a given gene pair in the same biological pathway or physical complex (e.g., protein-protein interaction), gene expression correlations and some other features are used in the classification. Some of these methods have been applied to all sequenced and annotated bacterial genomes, and their predicted collections of TUs are stored in dedicated or general microbial databases. We found the set of BAp TUs in three databases: BioCyc [14], DOOR [15] and MicrobesOnline [16]. The TU prediction method used in the BioCyc database [17] uses intergenic distance, functional similarity, metabolic network information and protein-protein network information to construct a log-likelihood table, which was used to make TU predictions. The method was trained on the E. coli data set. The DOOR method [18] uses a data-mining classifier trained on E. coli and Bacillus subtilis, including the intergenic distance, neighborhood conservation across multiple genomes, phylogenetic distance between adjacent genes, information from short DNA motifs, similarity score between GO terms of gene pairs and the length ratio between a pair of genes. Finally, MicrobesOnline [19] predictions were made by an unsupervised approach using intergenic distance, neighborhood conservation, functional similarity and the similarity of the gene codon adaptation index (CAI). As these three predictions were not especially designed for B. aphidicola and only partially overlap (see the Results section), we proposed a new set of TUs for B. aphidicola, based on a Bayesian prediction, that we compared with the three already available in the literature, and further validated experimentally.
Brinza et al. BMC Genomics 2010, 11:666 http://www.biomedcentral.com/1471-2164/11/666
In the second part of this study, we investigated the characteristics of B. aphidicola TUs, and evaluated the impact of operon map organization on the regulation of gene transcription. We also tested the influence of TU organization on coding sequence length dynamics during the evolution of the B. aphidicola lineage. Understanding the mechanisms of gene expression regulation in B. aphidicola is of interest for two reasons: first, it would provide a better understanding of the nutritionally based aphid - B. aphidicola association, and second, it provides an intriguing case study of the evolution of gene regulation in a reduced bacterial genome.
Methods Data organization and training data set
For training our TU finder, a data set was constructed using genomic and transcription unit information for E. coli from the Regulon database [20,21]. Using the nomenclature of Salgado et al. [22], we defined several classes of pairs of adjacent genes as follows (summarized in Additional File 1): - if both genes of the pair belong to an experimentally identified transcription unit, the pair class was designated “Same TU” (STU), - if only one of the genes of the pair belong to an experimentally determined TU, or if the genes have opposite transcription directions, then the pair class was designated “Different TU” (DTU); - if both genes belong to a TU exclusively predicted by computational methods, the pair class was designated “Not Known” (NK). In RegulonDB, some overlapping polycistronic TUs can be found, due to the presence of alternative promoters or alternative terminators. A pair of same-strand adjacent genes was classified “STU”, if there was at least one polycistronic TU containing this pair. NK pairs were excluded from the training data set, as well as the operon leader peptides. The polycistronic TUs carrying leader peptides are not structurally representative of the polycistronic TU population in B. aphidicola, because they are normally involved in transcription attenuation, a regulatory mechanism absent in B. aphidicola [10]. In this way, we constructed a training data set as similar as possible to the B. aphidicola model. Features, feature selection and predictor construction Intergenic distance
The intergenic distance is the number of base pairs separating two adjacent coding sequences, for overlapping genes the intergenic distance is negative. This feature has been shown to be critical in operon prediction [22], and to
Page 3 of 16
be the best single-feature predictor of E. coli operons [23]. Like Salgado et al. [22] and Romero et al. [17], we categorized the intergenic distance in 10-bp intervals. Transcription Rho-independent terminators
Rho-independent terminators are genomic elements which transient structure induces the stop of transcription by creating a loop within the mRNA extremity during the elongation step. Their sequence consists of a GC-rich hairpin followed by a thymine residue enriched sequence [24]. For both E. coli and B. aphidicola, we used the terminators predicted by TransTermHP [25]. Configurations tested for the Bayesian predictor DisTer
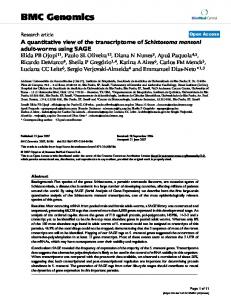
We tested three models for our Bayesian TUs predictor (DisTer). The features included in each model, and the formula used to calculate the probability that a pair of adjacent genes would be classified as STU are as follows: (1) the intergenic distance and the presence of the terminator, assuming that these properties are independent; (2) the joint distribution of the intergenic distance and the presence of the terminator; (3) the joint distribution of the intergenic distance and the TransTermHP score of the terminator. The corresponding formulae are presented in the Additional File 2. To estimate the prior probability that a pair of adjacent genes would belong to the same TU, we assumed that the number of genes in a TU follows a geometric distribution, P(LTU = n) = P(STU pair)n-1 (1 P(STU pair)). This is the simplest statistical model. The expected value of the distribution is 1/(1 - P(STU pair)), so we calculated the P(STU pair) using the mean of L TU − 1 = 0.53 (the density L TU curve is presented on Figure 1). The class attributed is normally that with the greatest estimated probability, and in our case, a gene pair could thus have been classified as an STU when the p(STU| pair properties) was >0.5, and as a DTU if it was ≤0.5. However, instead of doing this, we looked for the most discriminating value for the probability threshold, regarding the model accuracy and its predictive value. Probability threshold values between 0.05 and 1 were tested using the entire training set in order to evaluate the training data error rate, also known as the resubstitution error rate (here the same data set is used both to train the predictor and to assess its performance). This error rate is a good indicator of the uncertainty of the classification rules (Figure 2, left and Additional File 3). We used the sensitivity (the proportion of true STU pairs correctly classified as STUs by our method) and the specificity (the proportion of true DTUs correctly classified as DTU by our method) in order to evaluate the quality of the predictions.
LTU, ( L TU ): P(STU pair) =
Page 4 of 16
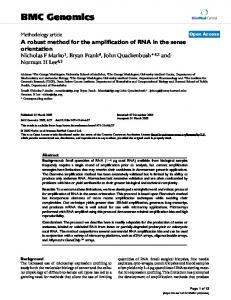
N-1 gene pairs, and is then used to classify the gene pair left out. We used the integral prediction made in this way (N iterations) to evaluate the performance of our model. On the Figure 2 the nearest point to the left corner of one curve (indicated by the arrow) is the point that minimizes the sum of the squares of the proportions of false predictions. For each model we considered that the probability threshold corresponding to this point on the curve gave the best performances. The best probability threshold value for the resubstitution error rate and the best probability threshold value for the model performances were not the same except for the second model (the probability threshold values can be visualized on Additional File 3). It is interesting to note that the second model predictor produced the best performances except when the entire E. coli data set was used, which was to be expected, since the third model divides the data into more classes than the second one. Hence the second model has the best predictive capability. Finally the second model (using joint distribution of the intergenic distance and terminator presence) with a 0.5 threshold, represents a good compromise between the resubstitution error rate (Se = 79% and Sp = 83%) and performance (Se = 78% and Sp = 84%), and was therefore the one chosen to predict the B. aphidicola TUs. All the calculations were performed using R 2.6.1 software [26].
Geometric density distribution, prob.=0.53
0.4
0.6
155
E. coli Buchnera
66
0.2
Frequency
0.8
Brinza et al. BMC Genomics 2010, 11:666 http://www.biomedcentral.com/1471-2164/11/666
0.0
27 20
0
7 4 3 1 1 5
1 1 1 10
15
TU length Figure 1 Distributions of the TU length (number of genes) in E. coli and Buchnera. The two distributions are significantly different. The numbers on the bars indicate the number of TUs of that length in Buchnera. The dotted line shows the estimated TUs length distribution with a geometric distribution.
Coding sequence length comparison
1.0
For each pair of Buchnera-E. coli orthologues, we traced the dynamics of the evolution of the sequence length in
0.0
0.2
0.4
0.6
1−Sp
0.8
1.0
0.8 0.4 Se 0.6 0.0
0.0
0.0
1 2 3
0.2
0.2
0.2
0.4 Se 0.6
0.4 Se 0.6
0.8
0.8
1.0
1.0
The predictive value of the model was also tested for the same probability threshold values using the holdout method: the E. coli data set was split into training (80%) and test (20%) data sets (Figure 2, middle), but also by a leave-one-out cross validation method (Figure 2, right). This last is an iterative approach in which each gene pair in the training set of N gene pairs is left out during one iteration. The model is trained with the remaining
0.0
0.2
0.4
0.6
1−Sp
0.8
1.0
0.0
0.2
0.4
0.6
1−Sp
0.8
1.0
Figure 2 ROC curves of the three prediction models tested for DisTer. ROC curves (showing 1-Sp, where Sp is the proportion of true DTU pairs correctly classified as DTU by our method, as a function of Se, the proportion of true STU pairs correctly classified as STU by our method) are evaluating the resubstitution error rate (left) and the model performance when the model is trained on 80% of the E. coli data and tested on the other 20% (middle), or using the leave-one-out technique (right). The red lines correspond to the second predictor model (DisTer), which was chosen for Buchnera operon map prediction. The grey arrows indicate the nearest point of the curves to the left upper corner. For the description of the models 1, 2 and 3 see the Methods section.
Brinza et al. BMC Genomics 2010, 11:666 http://www.biomedcentral.com/1471-2164/11/666
both lineages using Vibrio cholerae (accession number AE003852 and AE003853) as an outgroup. Pseudomonas aeruginosa (CP000438) or Haemophilus influenzae (L42023) were used when no orthologue could be found in V. cholerae. As no gene duplication has occurred in the B. aphidicola lineage since its divergence from E. coli [4], we used the bidirectional best hit method to identify the orthologues of B. aphidicola genes. Comparing the length of B. aphidicola genes to those of their E. coli orthologues (Δ L_E.coli-L_Bu ) and of the outgroup orthologue lengths (ΔL_Ext-L_Bu), we defined six classes: (1) genes with the same length in B. aphidicola and E. coli (ΔL_E. coli-L_Bu = 0); (2) genes which length increased in the E. coli lineage (if |ΔL_Ext-L_Bu| < |ΔL_E. coli-L_Ext| and ΔL_E. coli-L_Bu > 0); (3) genes which length decreased in the E. coli lineage (if |ΔL_Ext-L_Bu| < |ΔL_E. coli-L_Ext| and ΔL_E. coli-L_Bu < 0); (4) genes which length increased in the B. aphidicola lineage (if |ΔL_Ext-L_Bu| > |ΔL_E. coliL_Ext | and Δ L_E. coli-L_Bu > 0); (5) genes which length decreased in the B. aphidicola lineage (if |ΔL_Ext-L_Bu| > |Δ L_E. coli-L_Ext | and Δ L_E. coli-L_Bu < 0); (6) genes for which the lineage undergoing a length change could not be identified (if |ΔL_Ext-L_Bu| = |ΔL_E. coli-L_Ext| and ΔL_E. coli-L_Bu ≠ 0). Experimental validation of Buchnera TUs
B. aphidicola TUs were experimentally validated using the protocol devised by Charaniya et al. [27]. B. aphidicola cells were purified from about 900 mg of aphids, using the procedure described in Charles et al. [28]. Total gDNA was extracted using the QIAamp DNA Mini Kit (Qiagen, Helden, Germany). The gDNA was used for tuning the PCR conditions, and as positive control for the RT-PCR reactions. Total RNA was isolated and purified with RNeasy kit (Qiagen) as described by Calevro et al. [29]. Purity and RNA integrity were evaluated by NanoDrop® determination of the absorbance at 230 nm, 260 nm and 280 nm, and by denaturing agarose gel electrophoresis respectively (data not shown). The total RNA was then treated with Turbo DNA-free™ DNase (Ambion, Austin, TX, USA). The reverse transcription was performed from 1 μg RNA, using random hexamers and SuperScript™ III, according to the SuperScript™ First-Strand Synthesis system kit for the RT-PCR kit protocol (Invitrogen, Paisley, UK). The addition of 1 μl RNase H at the end of the reverse transcription, combined with incubation for 20 minutes at 37°C, eliminated all the RNA initially present in the solution. Two microliters from the reverse transcription reaction were used for each of the subsequent RT-PCR reactions. Specific oligo primers were designed for each product (gene pair) with the Oligo 6 software (Molecular Biology Insight, Inc). cDNA from the total RNA was used as template for the PCR reaction. A negative
Page 5 of 16
control was run without adding the reverse transcriptase enzyme, and a positive control was run on genomic DNA (gDNA). PCR reactions were performed using the AccuPrime™ Taq DNA Polymerase High Fidelity kit (Invitrogen), adapted to amplify DNA fragments up to 20 kbp. The PCR conditions were as follows: 30 sec of initial denaturing at 94°C, 36 amplification-denaturing cycles lasting 30 sec at 94°C, annealing for 30 sec at 47° C or 43.5°C, depending on the melting temperature of the primers, and extension at 68°C, for 2 to 5 min, depending on the amplicon length. The total reaction volume was 50 μl, and 10 μl of this mix were analyzed on 1% agarose gel stained with Ethidium Bromide. 17 pairs of genes were also tested with 26 amplificationdenaturing cycles.
Results Buchnera operon map
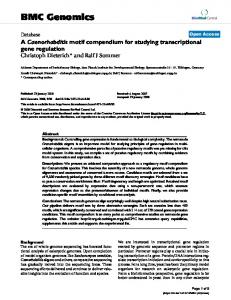
The entire B. aphidicola genome is arranged into 443 adjacent genes pairs having the same strand orientation, and 167 pairs of adjacent genes with the opposite strand orientation. Our prediction (DisTer) was run on the 443 adjacent gene-pairs, and the results were compared to the predictions available in the literature for B. aphidicola (Figure 3). The DisTer prediction differed significantly from each of the other predictions. MicrobesOnline was closest to the DisTer prediction, but even these two methods disagreed on the classification of 99 out of the 443 same-strand pairs (Figure 3). We therefore propose a new operon map of the B. aphidicola genome, containing the 133 predicted polycistronic TUs out of the 288 found in the B. aphidicola genome (155 are monocistronic). The list of the 288 TUs of B. aphidicola is presented in the Additional File 4. The average length (number of genes) of the predicted B. aphidicola TUs is 2.12 (1.63 in E. coli), whereas the average length of its polycistronic TUs is of 3.43 genes (3.17 in E. coli). On average, B. aphidicola TUs contain more genes than those of E. coli, and the TU length distribution of B. aphidicola is significantly shifted to the right when compared to that in E. coli (Wilcoxon test, p-value ≈ 10-9, Figure 1). Experimental validation of the Buchnera operon map using microarray data
In order to compare the four predicted collections of TUs of B. aphidicola (DisTer, MicrobesOnline, DOOR and BioCyc), we used gene expression data obtained by Reymond et al. [12], and we made the assumption that the variability of gene expression for the STU (Same Transcription Unit, see the Methods section) pairs would be lower than that of the DTU (Different Transcription Unit) pairs. The comparison was carried out after excluding monocistronic TUs, and using one-way
Brinza et al. BMC Genomics 2010, 11:666 http://www.biomedcentral.com/1471-2164/11/666
Page 6 of 16
F-value was calculated. The non-parametric p-value is the proportion of the simulated F-values that are higher than the observed F. Although all four methods gave significant p-values, the lowest value was obtained with DisTer (Table 1).
DisTer (323)
51 9 30 42 172 7 26 12 MicrobesOnline
Experimental validation of Buchnera operons using RTPCR
Number of predicted STU pairs
323
198
278
224
Total number of predicted TU
288
413
333
387
To confirm the co-transcription of the genes predicted within STU pairs (i.e., the presence of the polycistronic mRNA), RT-PCR reactions were performed for some gene pairs using primers that amplify across their intergenic region. Each amplicon contained the intergenic region of the tested pair, and at least 300 bp of the flanking regions located upstream and downstream of this intergenic region. In order to verify if our technique allows distinguishing between STU and DTU gene pairs, we used two positive controls (Figure 4, PC-pairs) and 4 negative controls (Figure 4, NC-pairs). The positive controls were chosen among the gene pairs of the operon trpABCD, which had previously validated by Bauman et al. [30]. The negative controls were chosen among the convergent and divergent pairs of B. aphidicola (3 divergent and one convergent pair). The products corresponding to the positive control pairs were amplified by RT-PCR, but not the products corresponding to the negative control pairs. Thus this technique is appropriate for experimentally verifying the DisTer predictions. We tested the predictions made for 31 gene pairs: 8 pairs predicted as STU solely by DisTer (Figure 4, apairs), 4 pairs predicted as STU by DisTer and only one or two of the other methods (Figure 4, b-pairs), 9 pairs that were predicted as STU by all the 4 methods (Figure 4, c-pairs) and finally, 10 pairs of adjacent genes predicted as DTUs pairs by DisTer (Figure 4, d-pairs). Twenty-nine out of the 31 experimentally tested pairs revealed a corresponding mRNA (Figure 4 and Additional File 5). Eight pairs out of the 10 pairs predicted as DTUs pairs by DisTer, but also by the other methods, (except the dnaX-ybaB pair) were amplified by RT-PCR. This experimental result suggests that even if DisTer predicts longer operon structures in Buchnera as compared to the 3 other predictors, the real Buchnera operon map may by even more polycistronic. We also detected the mRNA for the four following long polycistronic TUs: atpBEFHAGDC, argCBGH, trpABCD and leuSholAnadDsirA (Additional Files 6), although we were not able to amplify the complete mRNA from the atp operon (the longest), but only all the contiguous overlapping fragments. B. aphidicola vs. E. coli TU comparison
DOOR (224)
1
0
0
(278)
1
6 BioCyc (198) 86 Figure 3 Comparison of the four predicted transcription unit collections of Buchnera. Four-way Venn diagram of the pairs classified as STUs (Same Transcription Unit, see Methods) by the different methods. No Buchnera gene pair was classified as STU by the MicrobesOnline and DOOR methods but as DTU (Different Transcription Units, see Methods) by the other two. Nor was any Buchnera gene pair classified as STU by the DisTer and BioCyc methods and as DTU by the other two. The number shown below the method name indicates the total number of Buchnera gene pairs classified as STU by the method.
ANOVA-model with the polycistronic TUs as the qualitative regression variable and the log-transformed expressions as the explained variable (Table 1). As the four predicted operon maps have different numbers of polycistronic units, the adjusted R2 values (penalized by the number of parameters) were compared. Although the four methods gave similar adjusted R 2 values, DisTer showed slightly greater correlation (Table 1). P-values were computed using a non-parametric approach: we simulated 10,000 other B. aphidicola operon maps by shuffling the TU labels in such a way that the same TU lengths were conserved as in the original map. For each simulation, the one-way ANOVA Table 1 One-way ANOVA analysis of gene expression data for comparing the operon maps of Buchnera. DisTer BioCyc MicrobesOnline DOOR
Adjusted R2
0.44
0.38
0.40
0.41
Non-parametric p-value