Polymer 44 (2003) 2385–2392 www.elsevier.com/locate/polymer
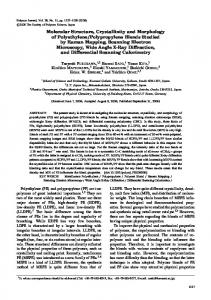
Structure and morphology development during deformation of propylene based ethylene – propylene copolymer and its blends with isotactic polypropylene Shaofeng Rana, Benjamin S. Hsiaoa,*, Pawan K. Agarwalb, Manika Varma-Nairc a
Department of Chemistry, State University of New York at Stony Brook, Stony Brook, NY 11794-3400, USA b ExxonMobil Chemical Company, Baytown Polymers Center, Baytown, TX 77522-5200, USA c ExxonMobil Research and Engineering Co., 1545 Rt. 22 East, Annandale, NJ, 08801, USA Received 17 September 2002; received in revised form 6 December 2002; accepted 9 December 2002
Abstract The structure and morphology development during the deformation of metallocene based ethylene – propylene copolymers with dominant propylene moiety (C3 M-EP) and its isotactic polypropylene (M-iPP) blends were investigated by simultaneous small-angle X-ray scattering (SAXS) and wide-angle X-ray diffraction (WAXD) using synchrotron radiation, high temperature tensile testing and differential scanning calorimetry (DSC). X-ray results showed that the structure and morphology in the blends of M-iPP/C3 M-EP are dictated by the M-iPP component. During stretching at room temperatures, both pure M-iPP and polymer blends exhibited the same transition from the a-form crystal to the mesophase. However, the a-form was found to be unchanged during the deformation of C3 M-EP copolymer, which indicated that the effect of local stress on the crystal domain in pure copolymer was too small to induce the phase transition. Although the DSC results showed that the blends in their isotropic state were immiscible with each other, the mechanical properties of the blends at high temperature (70 8C) indicated that they follow the conventional rule of mixing. q 2003 Elsevier Science Ltd. All rights reserved. Keywords: Metallocene isotactic polypropylene; EP copolymer; SAXS
1. Introduction The formation of soft, elastic fibers of a composition based largely on propylene has long been the goal of the several major industrial laboratories. It is believed that such fibers, if they can be made using existing equipment for the production of inelastic fibers with only minor modifications to accommodate and enhance the elasticity, would represent a significant breakthrough in the use of propylene-based polymers. For the development of the technological opportunity for these fibers, the polymer blends involving metallocene based ethylene – propylene copolymer with dominant propylene moiety (C3 M-EP) and isotactic polypropylene (M-iPP) have been studied [1 –4]. The C3 M-EP copolymers are a recently developed material system containing the ethylene content ranging from 6 to 18 wt% * Corresponding author. Tel.: þ 1-631-632-7793; fax: þ1-631-632-6518. E-mail address:
[email protected] (B.S. Hsiao).
[5]. Such materials are inherently elastic with an elongation at break ratio larger than 1000%. Clearly, the unique elastic property is related to the structure and morphology of the EP copolymer. During synthesis, the metallocene catalyst imparts random insertion of ethylene moiety in the growing chain that, in the end, destroys most of the polypropylene’s crystallinity. In spite of the relatively low crystallinity (5 – 15%), such materials can be readily formed into pellets. This is a highly desirable property for transportation/ handling use and subsequent processing/mixing operations in the production of elastic fibers. To obtain a better understanding of the structure and property relationships in propylene-based semi-crystalline polymers, some relevant structural information about the iPP fibers is briefly reviewed here. The iPP chains can adopt a 31 helical conformation (left-handed or right-handed helix) in the solid phase (crystal or mesomorphic). In the crystal phase, the helical chains can be organized into different spatial arrangements giving rise to three distinct
0032-3861/03/$ - see front matter q 2003 Elsevier Science Ltd. All rights reserved. PII: S 0 0 3 2 - 3 8 6 1 ( 0 2 ) 0 0 9 3 5 - 7
2386
S. Ran et al. / Polymer 44 (2003) 2385–2392
polymorphs: a-monoclinic, b-hexagonal and g-orthorhombic crystal forms, depending on the crystallization conditions [6 – 9]. Among these three crystal structures, the a˚ , b ¼ 20.8 A ˚ , c ¼ 6.5 A ˚, monoclinic form (a ¼ 6.6 A b ¼ 98.78) is the most thermodynamically stable one. All crystal forms require specific registrations between the helical hands of adjacent chains. The presence of ‘mesomorphic phase’ can be obtained by rapid quenching of the molten iPP or by mechanically deforming the a-form sample [10]. Natta and Corradini [11] first pointed out that the mesophase was an intermediate phase having a degree of ordering between the amorphous phase (short-range ordering) and the crystalline phase (three-dimensional ordering). Although the mesophase in iPP is often termed as the ‘smectic’ phase [11,12] to indicate the two-dimensional ordering of this phase, however, the experimental evidence for the ‘smectic’ form is not well documented. Perhaps, the more acceptable notation of the mesomorphic phase is that it consists of bundles of ordered helical chains with random assembly of helical hands [13]. In mesophase, the average interchain distance can be characterized by the diffraction maximum near the amorphous scattering peak (2u ¼ 15.78 ˚ ), while the signature of the 3-turn helix in at l ¼ 1.54 A chains can be identified by the second diffraction maximum at a large angle (2u ¼ 20.68) at the first layer line. The current work has been performed to study the structure, morphology and property relationships in M-iPP, C3 M-EP and their blends. In order to explore the molecular factors responsible for elasticity in the blends, thorough characterizations including simultaneous small-angle X-ray scattering (SAXS) and wide-angle X-ray diffraction (WAXD), differential scanning calorimetry (DSC) and high temperature mechanical testing have been carried out.
their blends are listed in Table 1, which were detected by Gel Permeation Chromatography (GPC) methods using two types of detectors (DRI: refractive index; LALLS: lowangle laser light scattering) at high temperatures. Polymer blends of M-iPP and C3 M-EP with different ratios were prepared in a twin-screw extruder at about 200 8C. Thin sample films with a thickness about 0.5 mm were prepared by melt pressing in a press followed by a rapid quenching using a heat-sink metal block. The in situ deformation study of four different PP film samples (homopolymer, copolymer and their blends) using simultaneous SAXS/WAXD techniques were carried out at the Advanced Polymers Beamline, X27C, National Synchrotron Light Source (NSLS), of Brookhaven National Laboratory (BNL). In this beam line, a three-pinhole SAXS collimation apparatus [14] was used to define the incident beam (the wavelength was 0.1307 nm). The beam size was about 0.3 mm in diameter at the sample position. The deformation of the film was performed with an Instron 4410 tensile apparatus using two imaging plates for X-ray detection. The Instron was modified so that it could symmetrically stretch the film. The symmetric stretching guaranteed that the focused X-ray could illuminate the same position on the film during deformation. In this setup, the chosen sample-to-detector distance was 1590 mm for SAXS and 140 mm for WAXD. A constant strain rate was applied to the specimen throughout the whole deformation. Simultaneous SAXS/WAXD images were taken after deformation reaching the desired strain values. The typical collection time was 1 min per image. DSC measurements were carried out to directly evaluate the properties of the samples based on different blends by using a Perkin –Elmer DSC II station. During such studies, in addition to samples prepared by compression molding, samples processed in the fiber form (here in after referred to ‘as received’ samples in the DSC thermograms) were used. The fibers were made using a conventional fiber spinning line; the details of which due to proprietary considerations cannot be disclosed in depth here [15]. The fiber samples were measured without tension. The typical scanning rate in DSC was 10 8C/min. The samples were stored at ambient
2. Experimental The chosen M-iPP homopolymer, C3 M-EP copolymer and their blends at different ratios were experimental materials provided by ExxonMobil Chemical Company. The molecular weight data of the two starting polymers and Table 1 Molecular characteristics of components and blends of M-iPP/C3 M-EP Composition (M-iPP/M-EP)
100/0 95/5 90/10 80/20 50/50 35/65 0/100 a b
GPC-DRIa
GPC-LALLSa
Mn ( £ 103)
Mz ( £ 103)
Mw ( £ 103)
Mw/Mn
Rgwb
Mw ( £ 103)
Mz ( £ 103)
60 83 71 72 105 108 108
285 309 310 343 351 377 354
156 179 178 189 206 223 212
2.60 2.16 2.51 2.62 1.96 2.06 1.96
16.8 18.5 18.4 18.9 20.3 21.1 20.9
167 187 183 192 208 224 218
303 286 250 304 268 296 276
At 135 8C; TCB. Using Mark– Houwink parameters a ¼ 0.73, log (k) ¼ 23.68.
S. Ran et al. / Polymer 44 (2003) 2385–2392
2387
The stress – strain results were taken at 75 8C with a crosshead speed of 50.8 mm/min in this study.
3. Results and discussions 3.1. Structure changes during stretching
conditions for at least 48 h before DSC measurements. After the first scan, the sample was held at 200 8C for about 3 – 5 min and then cooled down to 2 100 8C at a rate of 2 20 8C/min. The second heating scans were taken again at the rate of 10 8C/min to 200 8C. The high temperature tensile stretching experiments were carried out using an Instron machine equipped with an environmental chamber.
Selected 2D SAXS/WAXD patterns of neat M-iPP are shown in Fig. 1 The corresponding linear WAXD intensity profiles taken along the equator are shown in Fig. 2 and the linear SAXS intensity profiles along the stretching direction are shown in Fig. 3. In Fig. 1, the WAXD pattern of the unstretched sample shows distinct diffraction rings, which represent the typical a-form crystal without preferred orientation. These diffraction peaks can be indexed by reflections from the a-monoclinic unit cell, which are shown in Fig. 2. The corresponding SAXS image of the unstretched sample shows a single scattering ring, which is consistent with the lamellar morphology of isotactic polypropylene, having a long period of about 13 nm. At the strain of 70%, the WAXD plot shows slight increases in the equatorial peak positions (Fig. 2), which suggests that the lateral dimensions of the unit cell are decreased by tensile deformation. The simultaneously measured SAXS profile shows that the scattering maximum on the meridian is moved to a lower angle by stretching, which suggests that the long period of the lamellar stacks is increased. The combined SAXS/WAXD results suggest that upon stretching, small crystals can be melted away leaving behind the more perfect and larger lamellae, and these lamellae can further be elongated and reoriented. Both effects will result in increasing the long period and lamellar orientation. At strains above 100%, the features of WAXD from M-iPP are significantly changed. It is noted that a distinct six-point pattern (two peaks on the equator and four peaks on the layer line) is seen at 200% strain, Fig. 1. The
Fig. 2. One-dimensional WAXD profiles of neat M-iPP taken along the equator.
Fig. 3. One-dimensional SAXS profiles of neat M-iPP along the stretching direction.
Fig. 1. Simultaneous measured 2D SAXS and WAXD pattern of neat M-iPP homopolymer at different strains.
2388
S. Ran et al. / Polymer 44 (2003) 2385–2392
Fig. 5. One-dimensional WAXD profiles of neat C3 M-EP copolymer along the equator.
Fig. 4. Simultaneous measured 2D SAXS and WAXD pattern of neat C3 MEP copolymer at different extensions.
corresponding equatorial WAXD profile (Fig. 2) shows a broad scattering peak. This pattern is the signature of the mesomorphic form from an oriented iPP sample [16]. The off-axis four points represent the 31 helical structure in the extended chain assembly. The transition of the a-crystal to mesophase in iPP fibers by deformation at room temperatures has recently been reported by us [13], which is also seen here. The SAXS pattern at high strains illustrates the appearance of a strong equatorial streak, which represents the fibrillar morphology. The corresponding SAXS intensity profile along the stretching direction shows that the scattering peak disappears at high strains. The as-prepared C3 M-EP copolymer has a relatively low degree of crystallinity (less than 10%), which is completely isotropic with only two identifiable reflections in Fig. 4 (the weak crystalline image has been enhanced for visualization). These two isotropic peaks coincide with the (111) and (008) reflections of the g phase [17] instead of the reflections of the a phase. While g phase is relatively uncommon in iPP formed under typical processing conditions, recent work by Jones et al indicated that small amounts of comonomer units (4 – 10% ethylene or 1-butene) could promote the g phase rather than the a phase in meltcrystallized copolymers [18]. Our observation is consistent with this report. The linear WAXD intensity profiles taken
along the equator are shown in Fig. 5 and the linear SAXS intensity profiles taken along the stretching direction are shown in Fig. 6. At the strain of 55%, the WAXD image shows that an oriented a-form crystalline structure, which dominates the detected pattern, is induced by strain. Three strong reflection peaks along the equator are seen in Fig. 5, which can be indexed by the (110), (040) and (130) reflections of the a phase. The two reflections from the g phase are still visible but become significantly weakened with the increase of strain (up to 300%); the corresponding intensities, however, remain isotropic. It has been reported that the g phase can be converted to the a phase upon stretching [19], which appears to be the case here. During deformation, the a-form crystalline structure is found to persist with no indication of transition to the mesophase. Perhaps this can be attributed to the unique structure and morphology of C3 M-EP, which has been considered as a thermoplastic ‘elastomer’. Our previous study pointed out that in order to convert the a phase to the mesophase by
Fig. 6. One-dimensional SAXS profiles of neat C3 M-EP copolymer along the stretching direction.
S. Ran et al. / Polymer 44 (2003) 2385–2392
Fig. 7. One-dimensional WAXD profiles of the M-iPP/C3 M-EP (95:5) blend along the equator.
stretching, the a form crystal must be dissembled first [13], which requires the presence of large local stress on the interface between the crystal and amorphous phases. It is conceivable that in C3 M-EP, the large fraction of the amorphous ethylene – propylene sequences bore the majority of the deformation energy, thus lowering the stress build-up on the crystal/amorphous interface, which prevented the likelihood of destroying the a form crystals. The corresponding 2D SAXS images collected at high strains shown in Fig. 4 indicate that the strain-induced crystalline morphology remains lamellar-like, instead of fibrillar-like in pure m-iPP (Fig. 1). The linear equatorial WAXD profiles for polymer blends containing high concentrations of M-iPP (95 and 80%) and C3 M-EP are shown in Figs. 7 and 8, respectively. It is seen that the strain-induced structural changes in the blends are very similar to that of the metallocene derived iPP homopolymer. Both samples show that at strain of 50%, the a-form crystal is transformed to the mesophase (we note that the existence of the a-form crystal in the C3 M-EP phase may be too low to be detected by WAXD), and the lamellar morphology is converted to the fibrillar morphology. This is not surprising, because both blends have a high concentration of M-iPP, which dominates the structure of the blend.
2389
Fig. 8. One-dimensional WAXD profiles of the M-iPP/C3 M-EP (80:20) blend along the equator.
about 500 psi. We believe that in metallocene EP copolymers of normal MW and MWD, irrespective of the compositions, the upper limit of the elongation to break ratio (elasticity) is about 3000%. Thus, the observed elongation to break ratio is near the limit of the maximum extensibility for an EP copolymer. All other curves in Fig. 9 show distinct yield points, which indicates that the relatively large fraction of the iPP crystals still dominates the material properties at the chosen testing temperature. The elastic behavior (or the elongation to break ratio) of various blends can be evaluated from these curves. It is seen that the blends with the C3 M-EP concentration of less than 20% show elongation to break ratios near 1000%, while for the blends with C3 M-EP concentration above 20%, their elongation to break ratios increase substantially to about 1800%. All the blends exhibit excellent tensile strengths at about 3000 psi. The above data indicate that the blend with concentration of C3 M-EP between 25 and 50% exhibits a good combination of elasticity and strength properties. At this point, we must point out that all the above data were collected from molded samples with no preferred orientation. The fiber processing
3.2. Mechanical property evaluation at high temperatures The elastic behavior of the polymer blend for the fiber application can be evaluated by the tensile testing method at high temperatures. Tensile testing results of M-iPP, C3 M-EP and their blends at representative high temperature, 75 8C, are shown in Fig. 9. As expected, the stress – strain relationship of the C3 M-EP copolymer is rather rubbery at this temperature (the crystallinity is probably 5 –10%). The material can be stretched to an elongation to break ratio of about 2700% and yet demonstrate a respectable strength of
Fig. 9. Tensile profiles of several M-iPP/C3 M-EP blends at 75 8C.
2390
S. Ran et al. / Polymer 44 (2003) 2385–2392
Fig. 10. DSC heating scans (first heat) of fibers made of M-iPP/C3 M-EP blends (no tension was applied) in (a) the melting region, (b) the premelting region.
will undoubtedly produce a high degree of molecular orientation, and shall in the end dictate the properties (e.g. elasticity) of the final products. 3.3. Thermal property evaluation and its relationship with elasticity Many studies have shown that the elastic behavior of a material is dependent primarily upon the ability of its chains to take up as many configurations as possible. The configuration rearrangements (and chain motions) in turn are determined by the Tg or the Tm of the material, or by the distance between the transition temperature and the end-use temperature. The other topological constraints, such as physical entanglements and/or chemical crosslinks, also influence the elastic character of the material, though in a secondary fashion. Configurations take place by bond rotations and by chain segmental slippage, which are directly proportional to the molecular weight. The chain extensibility (e b) thus is a direct function of the molecular weight of the material. The MWD has a minor effect unless the polymer contains excessively long molecules that can
Fig. 11. DSC heating scans (second heat) of fibers made of M-iPP/C3 M-EP blends in (a) the melting region, (b) the pre-melting region.
sustain the load during deformation. The Tg’s of both amorphous components in M-iPP homopolymer and C3 MEP copolymer are relatively high, which will hinder the molecular relaxation of the final fiber products. Since molecular orientation exacerbates the Tg value, certainly a low Tg C3 M-EP copolymer is more desirable but may not be feasible to use in fiber production due to some practical issues alluded to earlier in the introduction section. DSC was used to determine the thermal behavior, crystalline state, crystallinity and miscibility of the (fiber) sample based on different blends of M-iPP/C3 M-EP, which are shown in Figs. 10 and 11. Figs. 10A and B represent the scans of the ‘as received’ samples (or the first heat) in the high temperature melt region and in the pre-melt glassy region, respectively. Figs. 11A and B represent the corresponding ‘cycled scans’ (or the second heat scans) in the high temperature melt region and in the pre-melt glassy region, respectively. By comparing the melt transition regions of the scans from the ‘as received’ samples and the cycled scan in Figs. 10A and 11A, it is seen that they are significantly different from each other, suggesting that the overall crystalline state of iPP is different in the fibers versus that in the equilibrated isotropic state. Fig. 10A shows that
S. Ran et al. / Polymer 44 (2003) 2385–2392
2391
Table 2 Thermal characteristics of the ‘as received’ samples of M-iPP and its blends with C3 M-EP Composition (M-iPP/M-EP) by wt.
100/0 95/5 90/10 80/20 50/50 35/65 a b c d e
First heata
Tg (8C)-PP
Tm (8C)
DH (J/g)
Crystallinityb (%) (experimental)
Crystallinityc (%) (expected)
Tm0 (8C)d
Experimental
Calculatede
164.8 159.1 159.5 157.6 153.3 152.0
80.5 76.0 73.6 68.8 45.6 37.5
38.9 36.7 35.5 33.2 22.0 18.1
38.9 37.0 35.0 31.1 19.5 13.6
53.2 53.2 55.4 52.3 51.8 50.6
,7.0 ,3.0 ,1.3 ,0.4 , 2 6.9 , 2 8.7
– 5.2 3.4 20.04 210 214.7
Heating rate: 10 8C/min. Based on DHf (100%) ¼ 8700 J/mol. Expected value is based on the base M-iPP sample. Pre-melting of small crystals. Using Fox relation: 1=Tgb ¼ v1 =Tg1 þ v2 =Tg2 ; assuming Tg1 ¼ 7 8C, Tg2 ¼ 225 8C.
the incorporation of C3 M-EP depresses the melting temperature of M-iPP. The Tm depression is about linearly related to the C3 M-EP concentration in the blend. There is a nearly 13 8C drop from the Tm of the neat M-iPP at about 164.8 –152 8C for the 35/65 blend (M-iPP/C3 M-EP). The information of melting temperature and heat of fusion for all the samples corresponding to the M-iPP component are listed in Table 2. In contrast, the Tm corresponding to the base iPP is found to be invariant to the C3 M-EP copolymer concentration for all the blends (except the neat iPP) in the second heating scans as seen in Fig. 11A. Incorporation of the C3 M-EP component though depresses the Tm of M-iPP sample by about 5 8C, from , 157 to , 152 8C. The data are summarized in Table 3. The normal melting temperature of the isotropic M-iPP material is about 157 8C. Its higher Tm value noted in the first scan is in part due to the higher molecular orientation in addition to perhaps a larger population of relatively thicker crystals, the later formed during spinning. The depression of the Tm is about constant in the blends at the second scan, which indicates that the samples are probably phase separated. Further evidence of the phase separation between M-iPP and C3 M-EP is
seen by the similar values of the experimental versus calculated (expected) degree of crystallinity in each blend (Table 3). From these observations and what follows in the analysis of the pre-melting region scans, we conclude that miscibility between the two components at least in their isotropic state (second scan) may be ruled out. In the fibers though there appears to be a slight degree of compatibility, which apparently results mainly from the nature of the fiber spinning process. Since the fibers are rapidly cooled, the components’ relaxations are not fast enough to segregate themselves to their own domains. Depression of the Tm in iPP with C3 M-EP concentration in the ‘as received’ sample scans (Fig. 10A) is very much analogous to the commonly observed depressions in the melting temperature of polymers when ‘impurities’ are present. Pre-melting regions for the first and second heat scans are shown in Figs. 10B and 11B, respectively. In the case of the “as received” samples (Fig. 10B), in addition to the changes near 0 8C, we observe a clear endotherm peak around 50 8C. The first change near 0 8C represents the glass transition temperature of the polymer, which is due to the M-iPP component. The estimated Tg values are summarized in the last column of Table 2, which indicates that the Tg value
Table 3 Thermal characteristics of the samples during the second heating scans Composition (M-iPP/M-EP) by wt
100/0 95/5 90/10 80/20 50/50 35/65 a b
Cycled heata
Glass transition
Tm (8C)
DH (J/g)
Crystallinity% (experimental)
Crystallinity% (expected)
Tm0 (8C)
Tg (8C)-PP
Tg (8C)-EP
157.3 152.3 151.9 152.5 151.6 151.7
94.2 90.5 87.0 77.8 48.2 36.7
45.5 43.7 42.0 37.6 23.3 17.7
45.5 43.2 40.9 36.4 22.7 15.9
– NDb ND ND ,51 ,51
, , , ,
– ND ND ND 225.0 225.0
Fiber samples cooled at 10 8C/min after melting; data from the second heat cycle. ND, not detected in the DSC traces.
2 3.3 2 3.6 2 5.2 2 6.1 ,0.0 ,0.0
2392
S. Ran et al. / Polymer 44 (2003) 2385–2392
progressively decreases with increase in the C3 M-EP concentration. This observation suggests some compatibility (miscibility) of the amorphous phases between the two components in fibers. We note that the Tg < 7 8C for the M-iPP fiber is significantly higher than what is normally observed and accepted Tg ¼ 0 8C for iPP. The higher Tg of the M-iPP fibers suggests that it has a highly constrained amorphous phase, which may be resulted from the high orientation of the crystalline phase in the fiber. The 50 8C endotherm transition on the other hand remains fairly constant. This endotherm is due to the melting of small and poorly defined crystals that are probably formed during the fast cooling process in fiber formation. It is seen that the strength of this endotherm sharpens with C3 M-EP concentration in the first scan, whereas no such endotherm (at 50 8C) is seen for the samples in the second scan. Two Tg’s, corresponding to each component (iPP and EP), are noted in high concentration blends, as seen in the bottom two scans. This indicates that the blends become immiscible after the fiber morphology is destroyed in the second heating scan. Although separate and distinct Tg’s are not clearly discernible in the top four curves of Fig. 11B, which correspond to the blends with 20% and/or less C3 M-EP copolymer in M-iPP, we suspect that these blends in their isotropic state are also immiscible from the molecular point of view. Nonetheless all the blends appear to be very well mechanically compatible systems (Fig. 11B).
4. Conclusions The structure and morphology development during the deformation of ethylene/polypropylene copolymers with dominant propylene moiety and its blends with isotactic polypropylene was investigated by simultaneous SAXS and WAXD, DSC and tensile tests. Results showed that the structure in the blends of M-iPP and C3 M-EP is dictated by the M-iPP component. The excess propylene component formed a-form crystallites in the blend, which could be converted into mesophase during stretching at room temperatures. However, the a-form iPP crystals in the neat C3 M-EP copolymer persisted during deformation. DSC results indicated that the blends in their isotropic state were immiscible with each other; limited miscibility was found in the fiber samples probably due to fast cooling. However, blending M-iPP and C3 M-EP together produced
materials with well-mixed mechanical properties. The data indicated that the blends with the concentration of C3 M-EP copolymer in the range of 25 –50% could exhibit a good combination of elasticity and strength, which may be suitable for elastic fiber applications.
Acknowledgements The authors acknowledge the financial support from the NSF Center for Advanced Engineering Fibers and Films at Clemson University, the NSF grant (DMR 0098104) and Exxon-Mobil. The SAXS synchrotron beamline X27C was supported by the Department of Energy (Grant DE-FG0299ER 45760). The authors thank Mr Henglin Yang for his assistance on the synchrotron experiments.
References [1] Bedia EL, Astrini N, Sudarisman A, Sumera F, Kashiro Y. J Appl Polym Sci 2000;78:1200. [2] Mighri F, Huneault MA, Ajji A, Ko GH, Watanabe F. J Appl Polym Sci 2001;82:2113. [3] D’Orazio L, Cecchin G. Polymer 2001;42:2675. [4] D’Orazio, Mancarella C, Martuscelli E, Sticotti G, Massari P. Polymer 1993;34:3671. [5] Pegoraro M, Severini F, Di Landro L, Braglia R, Kolarik J. Macromol Mater Engng 2000;280:14. [6] Caldas V, Brown GR, Nohr RS, MacDonald JG, Raboin LE. Polymer 1994;35(5):899. [7] Morris DR. J Macromol Sci, Phys 1969;B3(1):53. [8] Bruckner S, Meille SV, Petraccone V, Pirozzi B. Prog Polym Sci 1991;16:361. [9] Lotz B, Wittmann JC, Lovinger AJ. Polymer 1996;37:4979. [10] Phillips RA, Wolkowicz MD. In: Moore EP Jr., editor. Polypropylene Handbook. Munich: Hanser Publishers; 1996. p. 419. [11] Natta G, Peraldo M, Corradini P. Rend Accad Naz Lincei 1959;26:14. [12] Hsu CC, Geil PH, Miyaji H, Asai K. J Polym Sci Polym Phys 1986;24: 2379. [13] Ran S, Zong X, Fang D, Hsiao BS, Chu B, Phillips RA. Macromolecules 2001;34(8):2569. [14] Chu B, Harney PJ, Li Y, Linliu K, Yeh F, Hsiao BS. Rev Sci Instrum 1994;65(3):597– 602. [15] Agarwal PK, Cheng CY, Datta S. Elastic fibers and Article, US patent 6,342,565, Jan. 29, 2002. [16] de Candia F, Iannelli P, Staulo G, Vittoria V. Colloid Polym Sci 1988; 266(7):608. [17] Bruckner S, Meille SV. Nature 1989;340:455. [18] Turner-Jones A. Polymer 1971;12:487. [19] Turner-Jones A, Aizlewood JM, Beckett DR. Makromol Chem 1964; 75:134.