Student accuracy in reading logarithmic plots: the problem and how to fix it Andrew F. Heckler, Brendon Mikula
Rebecca Rosenblatt
Department of Physics Ohio State University Columbus, OH USA
[email protected],
[email protected]
Department of Physics Illinois State University Normal, IL USA
[email protected]
Abstract— Through extensive student testing and interviews, we found that the majority of university sophomore, junior, and senior engineering students in a standard introductory materials science engineering course have a variety of difficulties reading correct values from simple logarithmic graphs. For example, students often unknowingly interpreted the log scale as linear and were confused about the order of magnitude of a value in the negative exponent region. To address these issues, we used the results of our findings to develop and implement a set of online “essential skills” tasks to help students achieve a core level of mastery and fluency in reading log plots, a basic and critical skill for engineers. The online tasks were administered as for-credit homework assigned several times throughout the semester, and students spent 10-20 minutes on each assignment. Results of posttests indicate that with this minimal practice, students were able to dramatically improve their accuracy in reading log plots compared to a control group with no log plot practice. Furthermore, testing one month after training demonstrated that student continued to retain the learned skill. Future development will focus on making these essentials skills task broadly available online and further improving effectiveness and usability. Keywords—logarithmic graphs; problem solving skills ; graph interpretation; online homework
I.
INTRODUCTION
While complex problem solving skills are critical for engineers to learn and are thus the focus of considerable research and instructional efforts, it is also the case that more simple, elementary skills, are also necessary for solving problems. These simple yet “essential skills” may be fairly straightforward to learn through deliberate practice, but, often to the surprise or chagrin of the instructor, students typically do not have these skills or they are far from fluent in their use. In this study, we investigate the essential skill of reading logarithmic plots. We demonstrate and describe the significant difficulties that most junior and senior level students have with reading simple log plots, and we demonstrate a method to help students achieve and retain significant gains in mastery with a relatively small commitment of time. II.
PARTICIPANTS AND METHODS
The participants in this study were enrolled in an introductory materials science course for engineers, which is a
required core course for many of the engineering major programs at Ohio State University, a large public research university. The students ranged from 2nd to 5th-year engineering students. About 10-15% of the students intended on becoming materials science engineering majors, and about 35% of the students were mechanical engineering majors, the most common major in the course. Data was collected over a period of 5 quarters, for a total of approximately 600 participants. The data was collected in three ways. First, we administered free response and multiple choice tests. In addition to the standard homework, students were given a “flexible homework” assignment with credit for participation as part of the course grade. The flexible homework assignment consisted of participation in a one-hour session where students completed some combination of testing and interviewing. Throughout the quarter, students were randomly selected to participate in the flexible homework. Typically, about 95% of all enrolled students participated in the flexible homework. The tests items were in either multiplechoice, free-response, or a multiple-choice-with-explanation format. Students completed the material at their own pace at individual stations in a quiet room. Afterwards we would informally ask students to explain their answers and they were also asked whether they had any questions. We observed during these sessions that students made a good faith effort to answer the questions to the best of their ability. Second, we conducted individual or group interviews with over 50 students. These interviews consisted of asking students to verbally answer questions and provide their reasoning on simple log plot questions. Several dozen interviews were videotaped, and the rest were recorded via interview notes. The interviews were used to gain more insight into student difficulties that were discovered in the written tests. Most interviews were conducted individually, but some were given in groups of 3 or 4. Finally, the third method for collecting data was via the official online homework assignments administered as part of the course. Tests and interviews were administered either before or after relevant instruction. Different conditions were constructed in order to obtain pre-post test data needed to assess the effectiveness of the instructional intervention.
This work has been supported in part by the Center for Emergent Materials at The Ohio State University, an NSF MRSEC (Award Number DMR – 0820414). 2013 IEEE Frontiers in Education Conference 978-1-4673-5261-1/13/$31.00 ©2013 IEEE 1066
The difficulties reported here were found in both written tests and interviews. Thus incorrect answers to the questions should not be viewed as uninteresting artifacts of the particular questions, but rather indicative of authentic student difficulties with understanding and interpreting logarithmic plots. III.
STUDENT DIFFICULTIES WITH LOG PLOTS
Perhaps surprisingly, we could find no research documenting student difficulties with reading log plots, though there are studies documenting student difficulties with understanding logarithm functions [1], and logarithmic functions in the context of pH [2,3].
Approximately what value is indicated by the arrow on the number line below?
107
108
Responses indicating a correct interpretation of log scale
109
1010
Responses indicating a linear interpretation of log scale
In the course of testing and interviews we identified a number of specific difficulties, described below. Note that for results reported in this section, testing was administered near the end of the course, and as such the reported student difficulties should be considered post traditional instruction. A. Determining Values when Minor Tick Marks are Absent When minor tick marks between orders of magnitude are absent on a graph, most students interpret the scale between the orders of magnitude as linear. To demonstrate this, we randomly assigned students into one of two conditions. In the first condition, 107 students were given a numerical value and asked to provide a mark were this value is represented on a line that has orders of ten (major tick marks) indicated on a logarithmic scale. In the second condition, a mark was provided on the scale, and 106 students were asked to determine the value. For example, as seen in Figures 1 and 2, students were either asked to determine the value of the position approximately half-way between 108 and 109, or they were given the value of 3.0×10⁸ and asked to mark that value on the graph. Indicate with a hash-mark on the number line below the value 3 × 10⁸ :
107
108
1010
109
Responses indicating a linear interpretation of log scale
Responses indicating a correct interpretation of log scale
Fig.1 Provide-mark question with minor tick marks absent. Majority of student responses indicated a linear interpretation of log scale.
Fig 2. Determine-the-value question with minor tick marks absent. Almost half of student responses indicated a linear interpretation of log scale.
The results indicate that in both conditions, the majority of students interpreted the scale between the major tick marks as linear. For example, in the provide-mark condition in Figure 1, 57% of students indicated that 3.0×10⁸ was one-third of the way between 108 and 109, clearly a linear interpretation. In the determine-value condition in Figure 2, 49% of students indicated that the arrow (placed at the 3.0×10⁸ position, which is a little less than halfway between 108 and 109 on the graph), indicated a value between 4.0×10⁸ and 5.0×10⁸. This is also a clear indication of a linear interpretation, and post- interviews with students verified this interpretation for both conditions. B. Confusion of Values of Minor Tick Marks When minor tick marks are provided between the order of magnitude major tick marks, many students misinterpret the value to the hash marks, counting the first mark as “1” instead of “2” and so on. Also, to our surprise, even with minor tick marks present, some students still interpret the logarithmic scale as linear. To demonstrate this, we randomly assigned students to either a minor tick-mark present condition or a minor tick marks absent condition. As shown in Figure 3, students were provided with a graph with mark at the same position for both conditions, the only difference being that one graph had minor tick marks provided and the other did not. The results indicate that student perform poorly in both conditions, but more students answer correctly when tick marks are provided (41%) compared to when they are not (21%) (χ(1)= 6.3, p = 0.01) . The majority of the errors for the tick mark present condition are in misinterpreting the values of the tick marks (15%), and surprisingly interpreting the scale as linear, apparently ignoring the minor tick marks (20%). Note also, that a small number of students made an error on the order of magnitude, this error will appear more frequently in another context discussed in the next subsection. For the tick mark absent condition, the majority of errors resulted from
2013 IEEE Frontiers in Education Conference 1067
Approximately what number is indicated by each arrow on the number line below? Please answer in standard scientific notion, i.e. bx10c with c as an integer (e.g. 8.2x10¹¹).
105
106
107
108
105
106
107
108
Minor tick marks present condition
Minor tick marks absent condition
Responses 5.0×10⁵ 3.0×10⁶
1.5×10⁵
2.0×10⁵
3.0×10⁵
3%
15%
41%
20%
4%
4%
21%
Tick mark error
Correct
Minor tick marks provided (N = 74) No minor tick marks provided (N = 67) Comments
5.0×10⁶
Other
3%
4%
15%
58%
0%
6%
10%
Linear scale error
Order of mag error
Order of mag error + linear scale error
Fig 3. Example of question with minor tick marks present or absent (with positive exponents), including a table of student responses from each question type.
Approximately what number is indicated by each arrow on the number line below? Please answer in standard scientific notion, i.e. bx10c with c as an integer (e.g. 8.2x10¹¹).
10−6
10−5
10−4
10−3
10−6
10−5
10−4
10−3
2.0-2.5 ×10⁻⁵
4.0-6.0 ×10⁻⁵
10%
30%
10%
3%
13%
Tick mark error
Correct
1.4-1.6 ×10 Minor tick marks provided (N=73) No minor tick marks provided (N=69) Comments
-5
Minor tick marks present condition
Minor tick marks absent condition Responses 1.0-2.5 ×10⁻⁴
4.0-5.0 ×10⁻⁴
6.0-6.5 ×10⁻⁴
7.0-8.5 ×10⁻⁴
Other
14%
5%
4%
16%
11%
35%
4%
19%
10%
3%
13%
Linear scale error
Order of mag eror
Order of mag error + linear scale error
Order of mag error + reverse scale error
Fig 4. Example of question with minor tick marks present or absent (with negative exponents), including a table of student responses from each question type.
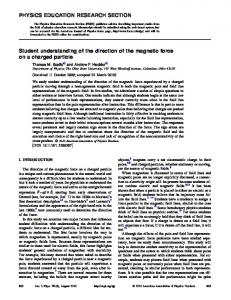
interpreting the scale as linear, which is a replication of results from the experiment in the previous subsection. C. Determining Values in the Negative Exponent Region When logarithmic graphs represent regions of negative exponents, additional difficulties of determining the correct order of magnitude, and determining the correct direction of the scale are introduced, further decreasing student performance. This was demonstrated by assigning students to either a tick mark present or absent condition, similar to the previous experiment, only in this experiment, the graphs represent negative exponent regions. For example, students where shown graphs with a mark between 10-5 and 10-4 indicating the value of 2.3×10⁻⁵, and student were asked to determine this value from the graph (see Figure 4).
The results shown in Figure 4 suggest that the performance on this task is even worse than the performance on positive exponent graphs with only 30% of students answering correctly in the tick mark present condition, and only 13% of students in the tick mark absent condition answering correctly. The low scores are a result of an additional error in the interpretation of the order of magnitude. Students were often confused, for example which side of the 10-4 major tick mark (i.e., to the right or left side) represents the order of magnitude of 10-4. In addition, student often made what we labeled in Figure 4 as the “reverse scale error”, meaning that students would “count down” (leftward) from the higher order of magnitude and use the fraction of distance as the value. For example in figure 4, students would note that the arrow is about 3/4 away from (to the left of) the 10-4 mark toward 10-5, so they would reason that the value should be 7.5×10⁻⁴. Post
2013 IEEE Frontiers in Education Conference 1068
interviews with students verified our interpretations of the errors and correct responses. D. Determining Values on 2-d Graphs Up to this point, we have only discussed student interpretations of one dimensional logarithmic plots. However, in practice we are more interested in student performance on two dimensional logarithmic plots (i.e. log-log or log-linear plots), which are commonly found in materials science text books. For two dimensional plots, we found that student performance is still poor, and the mistakes they make are the same as those found in one dimensional plots. To demonstrate this, we provided 206 students with a log-log plot with a line on it, gave them the value on one axis and asked them to read off the value on the other axis. For example in figure 5, we present a stress vs. creep rate log-log graph, and ask the students to determine the creep rate for a given stress. The results, shown in Figure 5, indicate that 41% of students answered within the accepted range, however, some of these responses may be false positives, since the accepted range includes one of the possible tick mark errors. The Figure also indicates that many students make the order of magnitude error and the minor tick mark error, though interestingly there was no evidence of the linear interpretation error, though this could be due to the specific values, which in this case do not lend themselves to a clear signal of a linear interpretation error because the values are not near the middle of the scale.
IV.
ADDRESSING STUDENT DIFFICULTIES: ESSENTIAL SKILLS PRACTICE ASSIGNMENTS
The results of the last section not only clearly demonstrate that even junior and senior level engineering students have difficulty reading values off of simple logarithmic plots, but the details of the difficulties allow us to design practice tasks to help them improve on specific common errors and become proficient in the essential skill of reading logarithmic plots. To this end, we designed a set of training tasks to improve student performance on reading logarithmic plots. The rationale is based on the general finding that experts have mastered a set of basic skills and knowledge to the extent that they are fluent or automatic in their use [4]. The central idea is that if necessary and frequently called processes are automated, this will place less demand on attention and other cognitive processes, allowing for efficient and effective problem solving (e.g., reference [5]). In this case, we are interested in improving fluency in reading logarithmic plots so that student may devote resources to solving more important engineering problems. The strategy used in this proposal to improve mastery and fluency is based on numerous studies demonstrating that testing with feedback can be an effective method for learning [6,7]. In order to further improve the learning and retention, the practice will also be spaced on the order of weeks, following the evidence of the advantages of spaced practice (e.g., reference [8]).
The figure below presents a stress vs. steady state creep rate graph for a steel alloy at 925°C. What is the creep rate when the stress is 70 MPa?
< 1.0×10⁻⁴ 3% Order of mag error
1.0-3.5 ×10⁻⁴ 15% Order of mag error + tick mark error
Responses (N=206) 4.0-8.0 ×10⁻⁴ 1.0-1.5 ×10⁻³ 12% 41% Correct Tick mark error (potential tick mark error)
4.0-8.0 ×10⁻³ 21% Order of mag error
Fig 5. Example of 2-dimensional graph question, including table of student responses.
2013 IEEE Frontiers in Education Conference 1069
Other 7%
We employed practical logistical constraints on the training, namely that the training would be administered via an automated online system as for-credit homework, and the training, integrated over the course, would require only a relatively small time commitment by the student, on the order of one hour, since this is an additional task assigned in the course.
which had an average score of 39% correct (t(142)=7.1, p