of the art video codecs, such as H.264/MPEG-4 AVC [1]. Such effectiveness in video compression suggests the po- tential efficiency of using HEVC intra coding ...
SUBJECTIVE EVALUATION OF HEVC INTRA CODING FOR STILL IMAGE COMPRESSION ˇ ra´ bek, Pavel Korshunov, and Touradj Ebrahimi Philippe Hanhart, Martin Reˇ Multimedia Signal Processing Group (MMSPG), Ecole Polytechnique F´ed´erale de Lausanne (EPFL) Station 11, CH-1015, Lausanne, Switzerland ABSTRACT High Efficiency Video Coding (HEVC) demonstrates a significant improvement in compression efficiency compared to H.264/MPEG-4 AVC, especially for video with resolution beyond HD, such as 4K UHDTV. One advantage of HEVC is the improved intra coding of video frames. Hence, it is natural to question how such intra coding compares to state of the art compression codecs for still images. This paper attempts to answer this question by providing a detailed analysis and performance comparison of HEVC intra coding with JPEG and JPEG 2000 (both 4:2:0 and 4:4:4 configurations) via a series of subjective and objective evaluations. The evaluation results demonstrate that HEVC intra coding outperforms standard codecs for still images with the average bit rate reduction ranging from 16% (compared to JPEG 2000 4:4:4) up to 43% (compared to JPEG). These findings imply that both still images and moving pictures can be efficiently compressed by the same coding algorithm with higher compression efficiency. 1. INTRODUCTION As a future video compression standard, HEVC is demonstrating significant quality gains when compared to state of the art video codecs, such as H.264/MPEG-4 AVC [1]. Such effectiveness in video compression suggests the potential efficiency of using HEVC intra coding for still images. This possibility is investigated in a few studies that compare still images compression standards with HEVC intra coding by using PSNR as an objective metric for visual quality [2, 3]. Such objective evaluations demonstrate that HEVC can achieve a considerable gain even compared to the state of the art JPEG 2000 compression standard. However, the PSNR metric, despite its popularity in visual quality evaluations, does not accurately reflect perceptual visual quality of human visual system [4]. In addition, the lack of This work has been conducted in the framework of the COST IC1003 European Network on Quality of Experience in Multimedia Systems and Services QUALINET, EC funded Network of Excellence VideoSense, and Swiss SER project Quality of Experience in 3DTV.
standardization in the field of objective quality assessment and the lack of extensive and commonly accepted comparisons of the different metrics make the PSNR-based assessments rather questionable. Therefore, to fully confirm the claim raised by objective evaluations on the effectiveness of HEVC intra coding for still images, a formal subjective evaluation is necessary. This paper performs both objective and subjective evaluations (with emphasis on subjective methodology) of HEVC intra coding for still image compression following the guidelines defined by the JPEG committee for the evaluation of JPEG XR [5]. HEVC intra coding is compared to the existing JPEG [6] and JPEG 2000 [7] (both 4:2:0 and 4:4:4 configurations are used) standards using high resolution 24 bpp images. The compression efficiency is evaluated by means of PSNR objective metric, for comparison with previous work, and subjective tests, which have been conducted in a specific testing environment and following formal evaluation methodology recommended by ITU-R [8]. Evaluated HEVC intra coding can be considered as an extension of H.264/MPEG-4 AVC, as both approaches are based on spatial sample prediction followed by transform coding. However, the main features of HEVC that makes it different, in terms of perceptual quality, compared to the previous standards include [3]: • Quadtree-based coding structure following the HEVC block coding architecture • Angular prediction with 33 prediction directions • Planar prediction to generate smooth sample surfaces • Adaptive smoothing of the reference samples • Filtering of the prediction block boundary samples • Prediction mode dependent residual transform and coefficient scanning • Intra mode coding based on contextual information This paper describes the evaluation environment, dataset used, and encoding algorithms in Section 2, and detailed evaluation methodology in Section 3. Subjective and objective results comparing HEVC intra coding with JPEG and JPEG 2000 algorithms are presented and discussed in Section 5. The paper is concluded in Section 6.
2. TEST ENVIRONMENT The experiments were conducted at the MMSPG quality test laboratory, which fulfills the recommendations for the subjective evaluation of visual data issued by ITU-R [8], and was also used by the JPEG committee in the assessment of JPEG XR standard during its development. The laboratory setup was intended to ensure the reproducibility of the subjective tests results by avoiding unintended influence of external factors. The test area was controlled by an indoor video security system to keep track of all the test activities and possible unexpected events, which could affect the test results. An Eizo CG301W LCD monitor with a native resolution of 2560 × 1600 pixels was used to display the test stimuli. The monitor was calibrated using an EyeOne Display2 color calibration device according to the following profile: sRGB Gamut, D65 white point, 120 cd/m2 brightness, and minimum black level. The room was further equipped with a controlled lighting system that consists of neon lamps with 6500 K color temperature, while the color of all the background walls and curtains present in the test area were in mid grey. The illumination level measured on the screen was 15 lux and the ambient black level was 0.2 cd/m2 . The experiment involved only one subject per display assessing the test materials. Subjects were seated in line with the center of the monitor, at a distance approximately equal to the height of the screen, but were encouraged to vary the viewing distance whenever needed, to inspect the high resolution image shown on the screen.
For JPEG 2000 coding, the Kakadu implementation3 version 6.0 was used. Two different configurations were considered. The first configuration uses chrominance subsampling, which requires external pre- and postprocessing steps. Since the weighting tables in JPEG 2000 have been designed and optimized for 4:4:4 content, visual weighting was disabled in this configuration. The following parameters were used: • Pre-processing: RGB to YCbCr conversion and 4:4:4 to 4:2:0 downsampling. • 64 × 64 code block size, 1 layer, no precincts, 9 × 7 wavelets, and 5 decomposition levels. • No visual weighting. • Post-processing: 4:2:0 to 4:4:4 upsampling and YCbCr to RGB color conversion. As visual weighting impacts the performance of the JPEG 2000 codec, a second configuration with visual weighting enabled was also included in the evaluations. The parameters in this second configuration were the same as before but the pre- and post-processing steps were discarded and the RGB 4:4:4 images were encoded directly without any subsampling. The rate control option was used to encode the images at the target coding bit rates. In this study, the HEVC Test Model4 , version 8.0rc2, was used. As for JPEG 2000, the images were converted from RGB 4:4:4 to YCbCr 4:2:0 prior to encoding and then back-converted to obtain the final decoded image. The images were coded in Main Intra Profile and the target bit rates were obtained by varying the quantization parameter.
3. DATASET
4. TEST METHODOLOGY
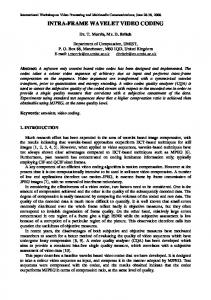
The dataset from the JPEG XR evaluation1 was used in this study. All the images had a resolution of 1280 × 1600 pixels and were available in RGB 4:4:4 uncompressed format. The whole image set was split into a training set of 4 images (referred to as p04, p14, p22, and p30) and a testing set of 6 images (referred to as p01, p06, p10, bike, cafe, and woman). Figure 1 provides an overview of the dataset. This set of images was coded using the 3 codecs and 4 different coding configurations described below. Similarly to the JPEG XR evaluation [5], the following bit rates were selected: 0.25, 0.50, 0.75, 1.00, 1.25 and 1.50 bpp. Thus, this resulted in a final test set of 144 coded images used for the subjective evaluation. The JPEG compressed images were produced using the IJG implementation2 , version 6b. The images were coded in Baseline Profile and the target coding bit rates were controlled by varying the quality factor input parameter.
The subjective quality evaluations to compare the image compression algorithms described in Section 3 were conducted following the methodology proposed in [5]. As an adaptation of the double-stimulus continuous quality scale (DSCQS) method for video quality evaluation [8], the selected method implies that two images are displayed simultaneously by splitting the screen horizontally into two parts. One of the two images was always the reference (unimpaired) image. The other was the test image, which in this study was a compressed version of the reference. The position of the reference image on the screen was randomly selected at each visualization. Instead of judging the quality of both images, the subject was asked to detect the impaired image in the pair and rate its quality, using a continuous quality scale ranging from 0 to 100, associated with 5 distinct quality levels (Bad, Poor, Fair, Good, and Excellent).
1 http://mmspg.epfl.ch/iqa
3 http://www.kakadusoftware.com/
2 http://www.ijg.org/
4 https://hevc.hhi.fraunhofer.de/
(a) p04
(b) p14
(c) p22
(d) p30
(e) p01
(f) p06
(g) p10
(h) bike
(i) cafe
(j) woman
Fig. 1: Dataset: training set (a-d) and testing set (e-j). 4.1. Training session Before the test starts, oral instructions were provided to the subject to explain his/her task. Additionally, a training session was organized to allow subjects to familiarize with the assessment procedure and the graphical user interface. The contents shown in the training session were not used in the test session and the data gathered during the training were not included in the final test results. The 4 training contents, shown in Figure 1, were coded with the different codecs and bit rates described in Section 3. Five training samples were manually selected by expert viewers so that the quality of samples were representative of all categorical quality levels on the rating scale. The training materials were presented to subjects exactly as for the test materials, thus in side by side image pairs, where one of the two stimuli was always the unimpaired image. 4.2. Test sessions Since the total number of test samples was too large for a single test session, the overall experiment was split into 4 sessions of approximately 13 minutes each. After each session, each subject took a 5 minutes break before starting the next session. Each session included test materials corresponding to 3 contents (p01, p06, p10 in sessions 1 and 3 and bike, cafe, woman in sessions 2 and 4), all the codecs under analysis, and only a subset of the bit rates, which were uniformly distributed across all the sessions. Four dummy pairs, whose scores were not included in the results, were included at the beginning of each session to stabilize the subjects’ ratings. To reduce contextual effects, the stimuli orders of display were randomized applying different permutation for each subject, while the same content was never shown consecutively. A total of 22 subjects, 6 female and 16 male, took part in the test, completing all the test sessions. All participants were screened for correct visual acuity and color vision using Snellen and Ishiara charts, respectively. 4.3. Analysis of the results After collecting the scores from the individual subjects, the following statistical tools were applied to analyze the pref-
erences for the different content, compression algorithms, and bit rates. 4.3.1. Outlier detection To detect and remove subjects whose scores appear to deviate strongly from others in a session, outlier detection was performed. The outlier detection was applied to the set of results obtained from the 22 subjects and performed according to the guidelines described in Section 2.3.1 of Annex 2 of [8]. In this study, 2 outliers were detected in session 1 and 1 outlier was detected in session 2. 4.3.2. Mean opinion scores and confidence intervals Statistical measures were computed to describe the score distribution across the subjects for each of the test conditions (combination of content, codec, and bit rate). The mean opinion score (MOS) was computed as: PN M OSi =
j=1 sij
N
(1)
where N is the number of valid subjects and sij is the score by subject j for the test condition i. The relationship between the estimated mean values based on a sample of the population (i.e., the subjects who took part in our experiments) and the true mean values of the entire population is given by the confidence interval of the estimated mean. The 100 × (1 − α)% confidence intervals (CI) for MOSs were computed using the Student’s t-distribution, as follows: σi CIi = t(1 − α/2, N ) · √ N
(2)
where t(1 − α/2, N ) is the t-value corresponding to a twotailed Student’s t-distribution with N −1 degrees of freedom and a desired significance level α (equal to 1-degree of confidence). N corresponds to the number of valid subjects, and σi is the standard deviation of a single test condition i across the subjects j. The confidence intervals were computed for an α equal to 0.05, which corresponds to a degree of significance of 95%.
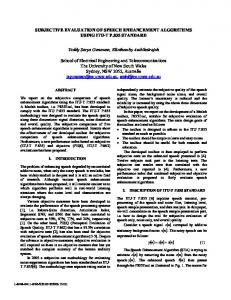
4.3.3. Relationship between estimated mean values To understand whether the difference between two MOS values corresponding to two different codecs is statistically significant, a multiple comparison significance procedure was applied to the data [9]. Particularly, for each bit rate and content, a one-way ANOVA test was conducted to compare all the codecs pairwise to understand whether the differences of their means were statistically significant [9]. 4.3.4. Bit rate reduction To evaluate the coding efficiency of HEVC intra coding, the Bjøntegaard model [10] and PSNR values were used to determine the objective bit rate reduction ∆BR(PSNR). Similarly, using MOS values instead of PSNR values, the subjective bit rate reduction, ∆BR(MOS), was estimated. ∆BR(MOS) is more realistic since it is based on perceived quality, while ∆BR(PSNR) is based on estimated quality. ∆BR(PSNR) was computed using a third order logarithmic polynomial fitting of the data points, as proposed in [10]. ∆BR(MOS) was computed using finite integration and piecewise linear interpolation on the monotonic part of the subjective rate-distortion curves. 5. RESULTS AND DISCUSSION The PSNR based rate-distortion performance for all compression algorithms and contents is shown in Figure 2. It is clear that HEVC outperforms other codecs across the majority of contents and through most investigated bit rates. JPEG 2000 with 4:2:0 sampling configuration is the only competitive compression algorithm in comparison to HEVC, especially for content p01. The observed performance difference of JPEG 2000 4:2:0 and HEVC in terms of PSNR is between 0.0 - 3.0 dB for all tested bit rates and contents. Furthermore, the PSNR improvement of HEVC relative to JPEG 2000 4:4:4 and JPEG varies through all tested contents and bit rates between 0.7 - 4.9 dB and 1.1 - 8.6 dB, respectively. Similar results for still image compression performance comparison based on objective metrics have been reported in two recent studies. Using the dataset containing, among others, the images described in Section 3, HEVC HM 6.0 encoder and reference software encoders for other standards, Nguyen and Marpe [2] have reported an average bit rate reduction of 43% and 22.6% for HEVC intra coding over JPEG and JPEG 2000 4:2:0, respectively. Additionally, Lainema and Ugur [3] have reported an average bit rate reduction of 56% over JPEG. The ∆BR(PSNR) values reported in Table 1 are similar to those reported in above mentioned studies and confirm that, according to objective evaluations based on PSNR, a significant bit rate reduction
Table 1: Overall bit rate reduction for HEVC relative to all examined standards as an anchor. PP Codec P JPEG JPEG 2000 4:2:0 JPEG 2000 4:4:4 Metric PPP ∆BR(PSNR) ∆BR(MOS)
-61.63% -43.10%
-20.26% -30.96%
-46.88% -15.98%
can be achieved for HEVC intra coding over the JPEG standards. The subjective rate-distortion plots illustrating the MOS and CI values for each content are shown in Figure 3. For each content, the MOS values span the entire range of quality levels. The only exception to this overall behaviour is on content cafe, whose structure is sensitive to compression artifacts and therefore, even for the highest bit rate, the image quality is rated below 90. An overall impression of the performance of the different codecs can be obtained when looking closely at the ratedistortion plots in Figure 3. In general, all examined coding standards have the same or very similar performance at the highest bit rate. However, at lower bit rates, the performance of individual coding algorithms varies significantly depending on the content. While HEVC outperforms (particularly at bit rates below 1.00 bpp) other coding algorithms for contents bike, cafe, and p10, its performance is quite comparable to both versions of JPEG 2000 for contents p01 and p06. Moreover, HEVC shows always better or equal performance than JPEG with the exception of content woman. Looking at the MOS results of the image woman, which consists in a woman’s face portrait, one can see that HEVC is outperformed by JPEG and JPEG 2000 4:4:4. While JPEG outperforms HEVC only at 0.80 bpp and 1.00 bpp, JPEG 2000 4:4:4 seems to be better for all bit rates below 1.00 bpp (1.00 bpp included). This might be explained by the specific banding artifacts introduced by HEVC at lower bit rates for this particular content. Such banding artifacts are subjectively more disturbing in comparison to the typical blurring effect introduced by JPEG 2000 4:4:4 coding. The estimated bit rate saving based on MOS for HEVC relative to JPEG, JPEG 2000 4:2:0, and JPEG 2000 4:4:4 is about 43%, 31%, and 16%, respectively. The differences between ∆BR(MOS) and ∆BR(PSNR) values (see Table 1) show the importance of subjective tests to determine a more realistic estimation of the achievable bit rate reduction . Interesting observations can be made by looking at the mutual comparison of both versions of JPEG 2000. Although JPEG 2000 4:2:0 performs always better than JPEG 2000 4:4:4 in terms of PSNR, the subjective results dictate the opposite. This might be explained by the fact that visual weighting was disabled for JPEG 2000 4:2:0 while it
Fig. 2: Rate-distortion performance.
Fig. 3: Mean opinion scores vs. bit rate for the different compression algorithm across the test images.
Table 2: Results of the multiple comparison test expressed in terms of number of contents for which HEVC performs better, equal, or worse than the other codecs.
therefore specialized still image compression encoders may be becoming redundant, at least if judged by compression efficiency criteria only.
``` rate [bpp] ``Bit 0.25 0.50 0.75 1.00 1.25 1.50 ``` Condition ``
7. REFERENCES
HEVC HEVC HEVC HEVC HEVC HEVC HEVC HEVC HEVC
> = < > = < > =