Supplementary Table 1: Food Parameters available in different ... - MDPI
Recommend Documents
2018, 19, 2766; doi:10.3390/ijms19092766 www.mdpi.com/journal/ijms. Supplementary Table 1. Laboratory and clinical features of patients according to ...
142350647. 142354720 LINC01300. + gain chr8. 142432006. 142441620 PTP4A3. + gain chr8. 143257699. 143257779 MIR4472-1. + gain chr8. 143279716.
Variable (normal range). AAS. AltD. N median (IQR) median (IQR). P-value. WBC count (4.50-9.00x10³/µl). 993. 10.32 (7.87-13.20). 8.00 (6.40-10.69).
Bacon and gammon, Meat pies, Sausage, Ham and canned meats. Luncheon meats ... Pizza, Empanadas, Tacos, Burritos, Fajitas. Meat Substitutes and.
Supplementary Table 1. Hierarchical multiple regression analyses of the associations between daytime sleepiness (A), OSA risk (B) and insomnia (C) and ...
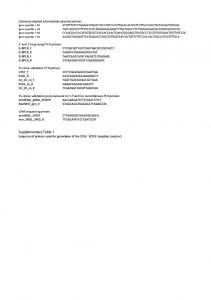
Supplementary Table 1: Primers used for qrT-PCr. Gene name. Forward primer 5â²-3â². Reverse primer 5â²-3â². ZEB1. GACAGTGTTACCAGGGAGGAGCA.
Supplementary Table 1. Pearson's correlation coefficients (r) between nonmetric multidimensional scaling ordination axes and species of Sebastes visually ...
Res. Public Health 2018, 15, x FOR PEER REVIEW. 2 of 4. Table S3. Attacker results of extended CPEP game under a learning curve of the piecewise function.
Antiglycemic drugs (%). 230 (52%). 430 (63%). Patient characteristics at follow up of participants in the Danish arm of Anglo-Danish-Dutch. Study of Intensive ...
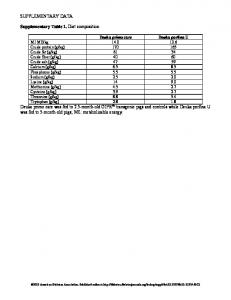
Deuka primo care was fed to 2.5-month-old GIPRdn transgenic pigs and controls while Deuka porfina U was fed to 5-month-old pigs; ME: metabolizable energy.
Elektra Papadopoulos. Food and Drug Administration. Indira Hills ... Jeremy Hobart. Plymouth Hospital. Adam Jacobs ... Gary Cutter. University of Alabama ...
Initial denaturation Cycles Denaturation. Annealing/Elongation. Temperature Time. Temperature Time Temperature Time. ABCD1. 95 °C 30 s. 50. 95 °C 5 s.
Coding of subsidiary food groups from National Diet and Nutrition Survey according to NOVA ... Subsidiary food group name. NOVA food groupâ . 1C. Pizza. 4.
Supplementary Table 2: Shows the quantile regression coefficients for children's Dietary Inflammatory Index treated categorically with 3 levels (level 1 is.
Supplementary Table 1: Food Parameters available in different countries Countrie s
N
Vit A
Vit B1
Vit B2
Vi t B3
Vit B6
Vit B12
Vit D
Vit C
Vit E
Beta Caroten e
Energ y
USA
8127
Foli c Aci d
620
× × ×
× × × ×
× × ×
824
× × × ×
× × ×
Korea
× × × ×
South Africa Venezuel a Spain
157
× × × × ×
×
Japan
× × ×
×
400
× × × ×
×
Australia
Belgium
99
Greece
172
Germany
140
France
107
Italy
73
Sweden
102
Austria
128
United Arab Emirates Chile
358
×
× ×
×
×
×
1543
× × × × × × × × ×
× × × × × × × × ×
× × × × × × × × ×
× × × × × × × × ×
× × × × × × × × ×
× × × × × × × × ×
× × ×
×
92
125
Carbs
× × × × × × × × ×
× × × × × × × × ×
× × × × × × × × ×
× × × × × × × × ×
×
×
× × × × × × × ×
× × × × × × × ×
×
×
Fibe r
× × × ×
T. Fat
× × × ×
Sat Fat
× × × ×
MUF A
× × × ×
PUF A
Cholester ol
Protei n
Alcoh ol
F e
Mg
Se
Z n
× × × × ×
×
× × × × ×
× × ×
×
×
× × ×
× × ×
×
×
×
×
×
× ×
×
×
×
× × × × × × × × × ×
× ×
×
×
×
×
×
×
×
Supplementary Table 2: Shows the quantile regression coefficients for children’s Dietary Inflammatory Index treated categorically with 3 levels (level 1 is the reference level) adjusted for sex, age, race, and BMI, NHANES, 2005–2012. Weighted CRP Levels 25th percentile
50th percentile
75th percentile
90th percentile
Est.
SE
95% CI
Est.
SE
95% CI
Est.
SE
95% CI
Est.
SE
95% CI
Quartile 2
0.018
0.011
[-0.003, 0.039]
†0.060
0.022
[0.018, 0.102]
†0.109
0.050
[0.011, 0.206]
0.323
0.323
[-0.131, 0.777]
Quartile 3 (3 + 4)
0.012
0.009
[-0.006, 0.030]
†0.062
0.026
[0.010, 0.113]
†0.123
0.034
[0.057, 0.189]
†0.25
0.115
[0.025, 0.475]
CDII Level
The quantile regression coefficients (Est.), standard errors (SE) and 95% confidence intervals (CI). † Indicates a significant value (at α = 0.05).