The 28th North American Fuzzy Information Processing Society Annual Conference (NAFIPS2009) Cincinnati, Ohio, USA - June 14 - 17, 2009
Support Vector Machines in the Prediction of Mutagenicity of Chemical Compounds Thomas Ferrari
Giuseppina Gini
Emilio Benfenati
Department of Electronics and Information Politecnico di Milano Milan, Italy Email:
[email protected]
Department of Electronics and Information Politecnico di Milano Milan, Italy Email:
[email protected]
Istituto di Ricerche Farmacologiche Mario Negri Milan, Italy Email:
[email protected]
Abstract— In this paper we introduce the problem of predicting the mutagenic toxicity property of chemical compounds and we discuss how this can be partially formulated as a computational intelligence problem. Then we develop a statistical model based on a selected set of descriptors of the molecular structure. The classifier, that we derived from SVM methods, outperforms the available methods in performance and simplicity.
I. I NTRODUCTION In our everyday life we have to deal with an always increasing number of new and different chemical compounds as food colourings and preservatives, drugs, paints for clothes and ordinary objects, pesticides and many others. At present the number of registered chemicals is about 28 millions. It’s well recognised that an uncontrolled chemicals proliferation may pose high risk to environment and people, hence their toxic activity has to be assessed. Biological active chemicals interact with biomolecules triggering specific mechanisms, like the activation of an enzyme cascade or the opening of an ion channel, which lead to a biological response. These mechanisms, determined by the chemical composition, are unfortunately largely unknown, thus toxicity tests are needed. Alongside classical methods as ”in vivo” and ”in vitro” experiments, the use of computational tools is gaining more and more interest in the scientific community and the industrial world as accompaniment or replacement of existing techniques. In fact, while real tests are clearly expensive and time consuming, with the actual computational capacity “in silico” models are broadening the horizons of experimental sciences: we are more and more moving from experiments to simulations. In computational chemistry we are able to represent molecules according to different views, from the basic valence model to graph representation, from electronic clouds to 3D structure. Algorithms are available to compute molecular descriptors, ranging from simple properties to complex fingerprints, that can help transforming the study of interactions between molecules and living organisms in a kind of data mining problem, finding relevant correlations with the response of interest. For regulatory purposes it is important to obtain satisfactory classification accuracy on new chemical families not well
978-1-4244-4577-6/09/$25.00 ©2009 IEEE
studied and developed. In this area models are needed that can take advantage of statistical analysis on great numbers and can be further refined using cooperative methods (for instance local models of given classes) to improve or confirm the results and give more insights into the domain. Moreover, to achieve a really predictive models it is important also to assess the predictive power of our relations. This paper surveys the mutagenic toxicity prediction issue from the Quantitative Structure-Activity Relationships perspective. In particular a support vector machines machine learning method is presented and a model for the mutagenic property prediction is developed and validated by data mining from a set of calculated molecular descriptors. We conclude our experiment with an open source release of the final model that is available from the authors and in the next future on the site of the CAESAR project1 . II. T HE MUTAGENIC PROPERTY Mutagenic toxicity is the capacity of a substance to cause genetic mutations. This property is of high public concern because it has a close relationship with carcinogenicity and eventually reproductive toxicity [5]: most of the mutagenic substances are suspected carcinogenic substance in case a genotoxic mechanism is considered. A particular group of chemical substances, called xenobiotics, binds DNA molecules whether inducing cellular death or promoting a complex series of events that may finally induce cancer. Most of the lesions chemically induced to DNA are repaired, but the missed ones may cause a mutation, i.e. the introduction of an altered gene which will be inherited by the new cellular generation. However, cancer induction is a process depending on several factors, since even nongenotoxic substances may facilitate the pathology by some mechanisms different from the DNA damage. Today regulators request the availability of mutagenicity potency, to correctly label and restrict mutagens/carcinogens and the human exposure to them. For example in drug/pesticide discovery mutagens should be stopped as early as possible, even before they are synthesized. Models are needed to 1 CAESAR
project home page at http://www.caesar-project.eu/
The 28th North American Fuzzy Information Processing Society Annual Conference (NAFIPS2009) Cincinnati, Ohio, USA - June 14 - 17, 2009 identify mutagens/carcinogens, and to keep into account their potency. In experiments, mutagenic toxicity can be assessed by various test systems. One crucial point was the creation of cheap and short-term alternatives to the rodent bioassay, the main tool of the research on chemical carcinogens. With this intent Bruce Ames created a series of genetically engineered Salmonella typhimurium bacterial strains, each strain being sensitive to a specific class of chemical carcinogens [2]. The Ames test is an in vitro model of chemical mutagenicity and carcinogenicity, and consists of a range of bacterial strains that together are sensitive to a large array of DNA-damaging agents [3] [4]. An interesting point is the reliability of such experimental tests: as discussed in [22] the estimated interlaboratory reproducibility rate of Salmonella test data is 85%. This observation will be taken into account in our model. III. P REDICTING PROPERTIES WITH QSAR S In this paper we focus on QSAR (Quantitative StructureActivity Relationship), that branch of predictive toxicity looking for correlations between the properties of the chemical structure and a measure of its activity/toxicity in a specific area, such as mutagenicity, carcinogenicity or skin sensitisation, that is called ”endpoint of interest”. Modelling is based on the construction of predictive models using a set of known molecules and the associated activity values. Such models can be generated using a wide variety of statistical methods, and more recently using machine learning methods (rule induction, neural networks, etc.). In early QSAR studies, only few physicochemical properties were proposed to be responsible for the biological potency, as steric (size and shape of the chemical), electronic (related to the ability of the chemical to undergo reactions) and hydrophobic (related to transfer across cell membranes) ones. The attempts to quantitatively relate these chemical parameters to the observed effects were restricted to very closely correlated compounds, differing in only one part (substituent) of the molecule [16]. In modern QSAR a wide set of theoretical molecular descriptors is used, consisting of different kinds to take into account the various features of the chemical. Their computation can be carried out by many software packages (mainly commercial) starting from the structural representation, even for that chemicals not yet synthetised. The first step in making a QSAR model is the calculation of molecular descriptors, which fall into three main classes. In the first class we have geometric descriptors, characterising the 3-dimensional structure of the molecule as geometric moments, molecular surface areas and volumes. The next class of descriptors are called topological descriptors since they represent the molecule as a mathematical graph encoding various features (such as connectivity and path lengths); they extract information regarding the shape of a molecule independently of the specific geometry. The third class of descriptors are the electronic descriptors and represent the
electronic features of a molecule such as HOMO and LUMO energies, electronegativity, and hardness. Another type of numerical values are the so called fingerprints. Fingerprints are used to encode structural characteristics of a chemical compound into a fixed bit vector; they are typically generated by enumerating all cycles and linear paths up to a given number of bonds and hashing each of these cycles and paths into a fixed bitstring of ’1’ and ’0’. The specific bit-string encode a very large number of sub-structures into a compact representation [19] The underlying idea of QSAR models is that chemicals with similar values for the considered descriptors must behave in a similar way; thus, once the model is built, it can be used as a forecasting tool in drug design, environment protection and hazard analysis for all those compounds whose structure is similar to the structure of the ones used to tune the model. To asses the predictive ability of the model different validation methods are available, as k-folds cross validation and external test set. However, even though a model may exhibit good predictive ability during validation and testing, it is not always guaranteed that the it will perform well on a new set of data. The main reason is that the number of chemicals and chemical classes is really big (about 28 millions of chemicals substances are so far registered in the CAS register), while the number of biological assays used for training is relatively small (in the order of hundreds). In this context, it must be mentioned that one of the major problems in QSAR modelling is the availability of high quality experimental data for building the models. The input data must be both accurate and precise in order to develop a meaningful model, because its statistical validness depends on the one of the data that have led to its development. In addition there is the problem of descriptors reproducibility: experimental values can differ greatly even when referred to the same compound2 . QSAR has been applied to mutagenicity prediction. One of the first attempts [16] used only four descriptors, namely: one obtained from quantum computing (LUMO); the partition coefficient between octanol and water (LogP, it’s a measure of the potency of the molecule to cross the cellular membrane); a structural indicator; a descriptor able to exclude molecules considered outliers. This paper used only 230 compounds, mutagenic or not, of the same chemical class. One of the problem of this model was the use of a quantum computation descriptor, that takes a long process to be obtained, and the limitation to a single chemical class. The same data set has been used with Inductive Logic Programming [25]. Early computational models based on the expert system paradigm have been developed for mutagenicity and other endpoints [15]. Some of them had been incorporated into commercial programs [23], [18], [13]. For a recent evaluation of their performances see [24]). A new era in modelling mutagenicity arrived with the availability of large data set of non congeneric compounds. 2 An example is given by the partition coefficient (LogP): in the several approaches to its computation it is not uncommon to get differences of orders of magnitude.
The 28th North American Fuzzy Information Processing Society Annual Conference (NAFIPS2009) Cincinnati, Ohio, USA - June 14 - 17, 2009 The most notable has been provided and analysed by Kazius et al. [17], and includes more than four thousand molecules with the respective Ames test binary result. A drawback of those data is that molecules tested with different methods (with and without metabolic trial) are mixed; however, it is accepted in the scientific community as a sound dataset. On this core data a few other papers have been published [20], [28] that we used to benchmark the results of our model.
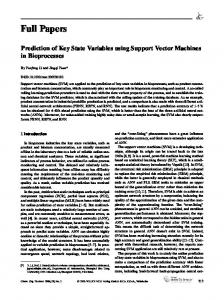
IV. S UPPORT V ECTOR M ACHINES FOR C LASSIFICATION Support Vector Machines (SVM) are a collection of supervised learning methods for classification and regression [12] [8]. Their elegance combined to their potency make of SVM a bright tool with well-founded basis in statistical learning theory, already successfully used in many application domains, including QSAR [20] [7]. Let’s overlook the key idea behind SVM classifiers. Given a training set of d-dimensional data points, where each of them is known to belong to one of c classes, the aim of a supervised classifier is to predict which class new data points will be in. Focusing for clarity on binary classification, if it is assumed (but just for the moment) that data points of the two classes are linearly separable, a smart model is given by a (d-1)-dimensional hyperplane that correctly separates instances of different classes3 . Generally there are infinite possible separator hyperplanes. The one that better generalises the problem is the “furthest” from samples of both classes: small variation in the data would not introduce big variation in the model. This paradigm is put into practice by the maximum margin hyperplane, where “margin” is the sum of the two distances from the hyperplane to the closest samples set of both classes. These points are called support vectors and are the training patterns closer to the decision boundary. In the following we review the C-Support Vector Classification (C-SVC) algorithm, a linear method originally proposed by Vapnik [27] and later extended for nonlinear classification at AT&T Bell Labs [6]. Consider the set of l training vector-label pairs {xi , yi }, i = 1, . . . , l, x ∈ Rd and y ∈ {−1, +1}. Given any separator hyperplane w · x − b = 0, where w is a normal vector, its parallel hyperplanes lying on the support vectors of the two classes can be written (just fixing a scale) as w · x − b = 1 and w · x − b = −1. So the margin can be computed as the distance between these two hyperplanes (see Figure 1). 2 , maximising the margin Being such distance d = kwk means minimising k w k, and after a convenience substitution 2 with kwk the maximum margin hyperplane problem can be 2 3 It’s clear that such concept can be easily extended to handle the multiclass case with c classes by considering the respective c hyperplanes that separate instances of each class from all the others [6]. Anyway, since the mutagenicity prediction is a binary problem, in the following we consider the case of two classes, labelled for convenience +1 and -1.
Fig. 1.
The maximum margin hyperplane.
presented as a Quadratic Programming optimisation problem: 1 k w k2 2
min w,b
subject to
( w · xi − b ≥ +1 ∀i : yi = +1 w · xi − b ≤ −1 ∀i : yi = −1
, i = 1, . . . , l
or more concisely: min w,b
subject to
1 k w k2 2 yi (w · xi − b) ≥ 1
, i = 1, . . . , l
To extend to the linearly inseparable case we have to relax some constraints introducing a slack variable zi measuring the error of the instance xi , and then trying to simultaneously maximise margin while minimising the error: X 1 k w k2 +C min zi w,b 2 i ( yi (w · xi − b) ≥ 1 − zi subject to i=1,. . . ,l zi ≥ 0 where C is the cost parameter, the only to be chosen by the user (larger is C and higher is the penalty assigned to errors). With this soft margin extension, proposed by Cortes and Vapnik [10], it’s possible to simultaneously try to fit and generalise the training data by a linear model. To get a nonlinear classification, the input training vectors are mapped into a higher dimensional space by a nonlinear function Φ(x), and a linear model in the new space can implement nonlinear boundaries in the original space [1]. X 1 k w k2 +C zi min w,b,zi 2 i ( yi (w · Φ (xi ) − b) ≥ 1 − zi subject to i=1,. . . ,l zi ≥ 0
The 28th North American Fuzzy Information Processing Society Annual Conference (NAFIPS2009) Cincinnati, Ohio, USA - June 14 - 17, 2009 Obviously the computational load grows exponentially, but SVM get around this trouble elegantly, performing the mapping with kernel functions. First of all it is necessary to switch to the Wolfe dual [14] of the Lagrangian formulation of the QP problem just presented (see Cortes and Vapnik [10] for derivation): X 1X λi − λi λj yi yj Φ (xi ) · Φ (xj ) max Λ 2 i,j i X λi y i = 0 subject to i,j=1,. . . ,l i 0 ≤ λi ≤ C where the new variable Λ = λ1 , . . . , λl is the vector of Lagrange multipliers. The same problem can be solved either in the primal or the dual form. Notice that in the dual form the mapped data only occurs as a dot product: by Mercer’s theorem [11] [26], given K(xi , xj ), a continuous, symmetric, positive semi-definite kernel function, it does exist a function Φ (x): K(xi , xj ) = Φ(xi ) · Φ(xj ) ∀i, j It means that the dot product in some high dimensional space can be evaluated by a kernel function in the original space, even without knowing the mapping Φ. It’s simple as it appears: just substitute every occurrence of Φ(xi ) · Φ(xj ) with the kernel function K(xi , xj ), and the mapping is never computed. Thereby, the final formulation of the problem in its dual form is: X 1X λi − λi λj yi yj K(xi , xj ) max Λ 2 i,j i X λi yi = 0 subject to i,j=1,. . . ,l i 0 ≤ λi ≤ C This is a convex quadratic optimisation problem, so every local solution is also global [14]. Common kernel functions are: • linear: K(xi ,xj ) = xi · xj d • polynomial: K(xi , xj ) = (γ xi · xj +r) , γ > 0 • RBF Function): K(xi , xj ) = ¢ ¡ (Radial Basis exp −γ k xi − xj k2 , γ > 0 • sigmoid: K(xi , xj ) = tanh (γxi · xj + r) where γ, r and d are kernel parameter. With an RBF kernel a support vector machine is a kind of neural network called RBF network. V. B UILDING AN SVM- BASED CLASSIFIER FOR MUTAGENICITY: An environment to develop SVM models is provided by the open source LibSVM [9] library4 , containing C++ and Java implementation of SVM algorithms with high-level interfaces (Python, Weka and more). Within this environment we built a 4 Software
available at http://www.csie.ntu.edu.tw/˜cjlin/libsvm
model for the mutagenicity classification using the RBF kernel (after the results of previous experiment on the same chemical set [20]). The optimal parameterisation of the model has been automated by a script included in the library, that performs an almost exhaustive grid-search in the 2-dimensional parameter space of the objective function using as evaluation criterion a cross-validation on the training set. A. The data set Our mutagenicity model uses a large set of 4225 chemical structures, meticulously assembled after an individual check within the CAESAR project from the data set described in [17]. The check removed from the original data set a few molecules with errors or lack of clear information. The data set was split into a training set (80%) and a test set (20%). For each compounds a complete set of few hundreds molecular descriptors were calculated with MDL-QSAR software [21] [19]. The descriptors include basic chemical properties of the whole molecules (as log P and number of rings)and small fragment counts. For modelling we had to reduce the descriptors number. The subset of descriptors has been automatically selected with the BestFirst search method, using as subset evaluator the 5-folds cross-validation score on the training set. In short, BestFirst algorithm searches the space of attribute subsets by greedy hill climbing (considering all possible single attribute additions or/and deletions at a given point), with a backtracking facility to explore also non-improving nodes. The same subset of 27 descriptors has been obtained either searching forward starting from the empty set, and with a bi-directional search starting from the 10 top rated attributes by a single attribute evaluator (Relief), both with 3 steps of backtracking. The selected descriptors are in Table I. The resulting dataset has been normalised by dividing each descriptor column by its maximum absolute value. Let us discuss about the meaning of the descriptors. About global topological descriptors. • Gmin is the minimum atom-level electronic state value in a molecule; it is a measure of the most electrophilic atom in the molecule. Mechanistically, an electrophilic center is important for covalent bond formation with nucleophilic DNA, and so it is not surprising that Gmin is found to be important in modelling. • idwbar is the Bonchev-Trinajstic mean information content based on the distribution of distances in the graph. • LogP is the partition coefficient between octanol and water. • nrings is the number of rings in a molecular graph computed as the cyclomatic number (i.e. the smallest number of bonds which must be removed such that no ring remains). The local descriptors are Atom-type counts. Atom types are classifications based on element and bonding environment.
The 28th North American Fuzzy Information Processing Society Annual Conference (NAFIPS2009) Cincinnati, Ohio, USA - June 14 - 17, 2009 TABLE I T HE DESCRIPTORS Internal code MDL042 MDL043 MDL044 MDL046 MDL047 MDL048 MDL051 MDL052 MDL053 MDL054 MDL055 MDL060 MDL062 MDL063 MDL064 MDL065 MDL067 MDL068 MDL069 MDL070 MDL168 MDL174 MDL175 MDL187 MDL198 MDL226 MDL230
Symbol SsCH3 acnt SdCH2 acnt SssCH2 acnt SdsCH acnt SaaCH acnt SsssCH acnt SdssC acnt SaasC acnt SaaaC acnt SssssC acnt SsNH2 acnt StN acnt SdsN acnt SaaN acnt SsssN acnt SdaaN acnt SsOH acnt SdO acnt SssO acnt SaaO acnt SHsOH Acnt SHother Acnt SHCHnX Acnt Gmin idwbar LogP nrings
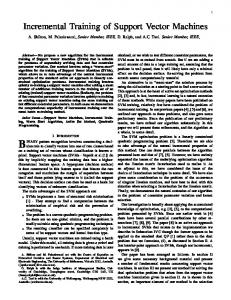
Atom type assignments are used in functional group identification, hydrogen addition, and hydrogen bond identification, and to determine VDW radii. Except for the first capital ”S”, each lower case letter represents a bond: • each ”s” within an atom type designation represents a single bond to that atom; • each ”d” within an atom type designation represents a double bond to that atom; • each ”t” within an atom type designation represents a triple bond to that atom; • each ”a” within an atom type designation represents an aromatic bond to that atom In our model a few of them match known structural alerts. The SdsN descriptor (for the nitrogen atom type N¯), is associated with the azo group, a structural alert. Molecules with larger SdsN descriptor values tend to have larger calculated output values. SsssN is the atom count of all tertiary nitrogens in molecules. Tertiary nitrogen group alerts occur when the nitrogen is attached to either an aromatic or partially unsaturated rings. SaasC counts aromatic carbons with an attached substituent atom. Is not an alert per se; however, it reflects the nature of structural alerts attached to the ring system. B. Model development and validation On such a huge training patterns set the best assignment found by the calibration procedure was (C, γ) = (8, 8), a plot of the grid-search is reported in Figure 2. With this parameterisation a model was trained and its prediction ability evaluated on the untouched test set, normalised with the same
TABLE II S TATISTICS AND CONFUSION MATRICES ON TRAINING AND TEST SETS OF THE SVM MODEL (C-SVC, RBF KERNEL , (C, γ) = (8, 8). SVM accuracy: sensitivity: specificity:
training set 92.3% 93.5% 90.8%
10-CV 82% 84.2% 79.2%
test set 83.2% 86.6% 78.9%
3380 chemicals (training set) mutagenic non-mutagens
classified as mutagenic non-mutagenic 1766 122 137 1355
845 chemicals (test set) mutagenic non-mutagens
classified as mutagenic non-mutagenic 407 63 79 296
scale factors used for the training set. Moreover, its robustness was assessed by a stratified 10-folds cross-validation.
Fig. 2. Grid-search in the (C, γ) space of the objective function parameters on a logarithmic scale (base 2). Each point represents a different parameterisation. Points on the same line has gained the same score by a 5-folds cross-validation on the training set. In the middle the best parameterisation assignment found (C, γ) = (8, 8).
The classifier has been evaluated for accuracy, sensitivity, specificity. Sensitivity is the number of positive chemicals correctly predicted divided by the total number of positives; specificity is the number of negative chemicals correctly predicted divided by the total number of negatives. Accuracy is defined as the total number of chemicals correctly predicted divided by the total number of chemicals. As we can see in Table II, the prediction accuracy is good under all points of view (accuracy, sensitivity and specificity). These error percentages approach the average inter-laboratory reproducibility error of the experimental test (15%) [22]. VI. C ONCLUSIONS Our hypothesis that a QSAR approach was a good method to build models of non-congeneric compounds has been proved.
The 28th North American Fuzzy Information Processing Society Annual Conference (NAFIPS2009) Cincinnati, Ohio, USA - June 14 - 17, 2009 In terms of accuracy our model, that uses performant algorithms, can reach an accuracy very near to the rate of the reproducibility of the experimental data in different laboratories. In terms of interpretability of our model, it uses a few global descriptors and the MDL keys. Some MDL keys are related to known structural alerts. However we should remember that the interpretability of non linear models does not depend on simple relations between input and output and the mix of the descriptors cannot be translated into rules. The next step in assessing our results can be devised in splitting experimental data according to the different protocols and examine each subset alone to understand whether the results are similar or not. Further research is foreseen. For chemical people it can be wise to make a chemical interpretation of the MDL keys involved in the model in terms of electrophilicity or reactivity of the substance. In terms of computer science applications, our model is in the direction of providing open source code for the scientific community. Other few steps are needed in order to create an open source version of the few proprietary software now used to feed our algorithm, in particular some of the descriptors. The use of predictive models is growing, since they aim to provide fast, reliable and quite accurate estimates of the chemicals activity. These features make them suitable for legislative purposes, and that is why they have been included as an alternative tool for risk assessment in the new European legislation on chemical production, called REACH (Registration, Evaluation, Authorisation and Restriction of Chemicals). This legislation fixes the rules for chemical production in E.U., and one of its key points is that it requires a risk analysis for each chemical placed in European market in amount greater than 1 ton/year. The proposed mutagenicity model is able to deal with the REACH requirements. ACKNOWLEDGEMENTS The authors thank Dr. Roberta. Bursi for supplying the Salmonella assay data and the partners of the EU CAESAR project (in particular BCX) for checking the chemical data and computing the descriptors. This work was supported in part by the EU contract CAESAR of the 6th framework program. R EFERENCES [1] Aizerman, M., Braverman, E., and Rozonoer, L. (1963). Theoretical foundations of the potential function method in pattern recognition learning. Automation and Remote Control, 24:774–780. [2] Ames, B. N. (1984). The detection of environmental mutagens and potential. Cancer, 53:2030–2040. [3] Ashby, J. (1985). Fundamental structural alerts to potential carcinogenicity or noncarcinogenicity. Environ Mutagen, 7:919–921. [4] Ashby, J. and Tennant, R. W. (1988). Chemical structure, salmonella mutagenicity and extent of carcinogenicity as indicators of genotoxic carcinogenesis among 222 chemicals tested by the u.s.nci/ntp. Mutat Res, 204:17–115.
[5] Benigni, R., Netzeva, T. I., Benfenati, E., Bossa, C., Franke, R., Helma, C., Hulzebos, E., Marchant, C., Richard, A., Woo, Y. T., and Yang, C. (2007). The expanding role of predictive toxicology: an update on the (q)sar models for mutagens and carcinogens. J Environ Sci Health C, 25:53–97. [6] Boser, B. E., Guyon, I. M., and Vapnik, V. N. (1992). A training algorithm for optimal margin classifiers. In Proceedings of the 5th Annual ACM Workshop on Computational Learning Theory, pages 144– 152. ACM Press. [7] Burbidge, R., Trotter, M., Buxton, B., and Holden, S. (2001). Drug design by machine learning: support vector machines for pharmaceutical data analysis. Computational Chemistry, 26:5–14. [8] Burges, C. J. C. (1998). A tutorial on support vector machines for pattern recognition. Data Mining and Knowledge Discovery, 2(2):121–167. [9] Chang, C.-C. and Lin, C.-J. (2001). LIBSVM: a library for support vector machines. Software available at http://www.csie.ntu.edu.tw/ cjlin/libsvm. [10] Cortes, C. and Vapnik, V. N. (1995). Support vector networks. In Machine Learning, pages 273–297. [11] Courant, R. and Hilbert, D. (1953). Methods of Mathematical Physics, volume 1. Interscience Publishers. [12] Cristianini, N. and Shawe-Taylor, J. (2000). An introduction to support vector machines. Cambridge University Press, Cambridge, UK. [13] Enslein, K., Gombar, V. K., and Blake, B. W. (1994). Use of SAR in computer-assited prediction of carcinogenicity and mutagenicity of chemicals by the topkat program. Mutat Res, 305:47–61. [14] Fletcher, R. (1987). Practical Methods of Optimization. Wiley. [15] Gini, G., and Benfenati, E. (1997). Computational predictive programs (expert systems) in toxicology. Toxicology, 119:213-225. [16] Hansch, C., Malony, P. P., Fujita, T., and Muir, R. M. (1962). Correlation of biological activity of phenoxyacetic acids with hammett substituent constants with partition coefficents. Nature, 194:178–180. [17] Kazius, J., Mcguire, R., and Bursi, R. (2005). Derivation and validation of toxicophores for mutagenicity prediction. J Med Chem, 48(1):312– 320. [18] Klopman, G. and Rosenkranz, H. S. (1992). Testing by artificial intelligence: Computational alternatives to the determination of mutagenicity. Mutat Res, 272:59–71. [19] Durant, J. L., Leland, B. A., Henry, D. R., and Nourse, J. G. (2002). Reoptimization of mdl keys for use in drug discovery. J Chem Inf Comput Sci, 42:1273–1280. [20] Liao, Q., Yao, J., and Yuan, S. (2007). Prediction of mutagenic toxicity by combination of recursive partitioning and support vector machines. Molecular diversity, 11:59–72. [21] MDL-QSAR software Home page at http://www.mdl.com/ [22] Piegorsch, W. W. and Zeiger, E. (1991). Measuring intra-assay agreement for the ames salmonella assay. In Hotorn, L., editor, Statistical Methods in Toxicology, Lecture Notes in Medical Informatics, pages 35–41. Springer-Verlag. [23] Ridings, J. E., Barratt, M. D., Cary, R., Earnshaw, G. G., Eggington, E., Ellis, M. K., Judson, P. N., Langowski, J. J., Marchant, C. A., Payne, M. P., Watson, W. P., and Yih, T. D. (1996). Computer prediction of possible toxic action from chemical structure; an update on the derek system. Toxicology, 106:267–279. [24] Ringeissen, S., Note, R., Dochez, C., Flamand, N., Ouedraogo-Arras, G., and Meunier, J. R. (2007). Evaluation of (q)sar models for the prediction of mutagenicity potential. AATEX, 14 Special issue:469–473. [25] Srinivasan, A., Muggleton, S. H., Stenberg, M. J. E., and King, R. D. (1996). Theories for mutagenicity: a study in first-order and featurebased induction. Artificial Intelligence, 85:277–299. [26] Vapnik, V. N. (1995). The nature of statistical learning theory. SpringerVerlag New York, Inc. [27] Vapnik, V. N. and Lerner, A. (1963). Pattern recognition using generalized portrait method. Automation and Remote Control, 25:821–837. [28] Zheng, M., Liu, Z., Xue, C., Zhu, W., Chen, K., Luo, X., and Jiang, H. (2006). Mutagenic probability estimation of chemical compounds by a novel molecular electrophilicity vector and support vector machine. Bioinformatics, 22(17):2099–2106.