(NM_001287593), 590-709, 120 bp; CLIC2 (NM_001289), 444-563, 120 bp; CLIC3. (NM_004669), 246-377, 130 bp; CLIC4 (NM_013943), 364-483, 120 bp; ...
SUPPORTING INFORMATION Additional Supporting Information may be found online in the supporting information tab for this article.
Supplementary Methods The following gene-specific PCR primers of human origin were used in real-time PCR: HER2 (GenBank accession number, NM_002512), 288-408, 121 bp; ClC-1 (NM_000083), 1181-1301, amplicon=121 bp; ClC-2 (NM_004366), 1007-1127, 121 bp; ClC-3 (AF029346), 2111-2239, 129 bp; ClC-4 (NM_001830), 737-871, 135 bp; ClC-5 (NM_001127899), 1211-1339, 129 bp; ClC-6 (NM_001286), 937-1060, 124 bp; ClC-7 (AF224741), 1036-1156, 121 bp; ANO1 (NM_002250), 1475-1595, 121 bp; CLIC1 (NM_001287593), 590-709, 120 bp; CLIC2 (NM_001289), 444-563, 120 bp; CLIC3 (NM_004669), 246-377, 130 bp; CLIC4 (NM_013943), 364-483, 120 bp; CLIC5 (NM_001114086), 580-699, 120 bp; CLIC6 (NM_001317009), 1970-2087, 118 bp; AP2α (NM_003220), 787-906, 120 bp; AP-2β (NM_003221), 1134-1253, 120 bp; AP-2γ (NM_003222), 828-947, 120 bp; EGR2 (NM_000399), 590-711, 122 bp; STAT3 (NM_139276), 1263-1382, 120 bp; Foxp3 (NM_014009), 1253-1372, 120 bp; EBP1 (U87954), 653-772, 120 bp; MBP-1 (M55914), 690-809, 120 bp; HDAC3 (NM_003883, 699-819), 121 bp; HDAC6 (NM_006044, 3517-3637), 121 bp; β-actin (ACTB) (NM_001101, 411-511), 101 bp.
B. ClC-3
A. ANO1
0.06
0.04
0.02
ratio to ACTB
ratio to ACTB
0.06
0.04
0.02
0.00
0.00
D. CLIC1
C. ClC-7
0.3
0.04
0.00
ratio to ACTB
ratio to ACTB
0.06
0.02
0.2
0.1
0.0
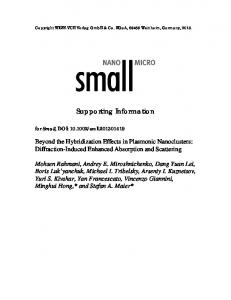
Figure S1. Transfection efficacy of siRNAs in MDA-MB-453 cells. A-D: Real-time PCR assay for ANO1 (A), ClC-3 (B), ClC-7 (C), and CLIC1 (D) in si-cont-, siANO1-, si-ClC-3-, si-ClC-7-, and si-CLIC1-transfected MDA-MB-453 cells (n=4 for each). Expression levels were expressed as a ratio to ACTB.
B
A
1.5
1.0
0.5
relative expression (P-STAT3 / STAT3)
relative expression (P-Akt / Akt)
1.5
0.0
0.5
0.0
D
C
1.5
1.0
0.5
0.0
relative expression (P-STAT3 / STAT3)
1.5
relative expression (P-Akt / Akt)
1.0
1.0
0.5
0.0
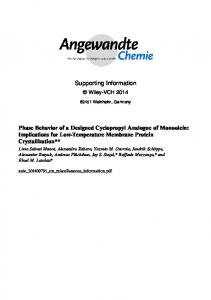
Figure S2. Effects of the expression levels of phosphorylated AKT (P-AKT) and phosphorylated STAT3 (P-STAT3) proteins on siRNA-mediated inhibition of ANO1 for 72 hr in MDA-MB-453 cells (A, B) and siRNA-mediated inhibition of ClC-3 for 72 hr in YMB-1 cells (C, D). Immunoblotting was performed as shown in Figure 7. After compensation, the ratio of P-AKT to AKT or P-STAT3 to STAT3 in si-cont was expressed as 1.0 (n=4 for each).
B
A
HER2
HER2
(185 kDa)
185 kDa)
ACTB
ACTB
(43 kDa)
(43 kDa)
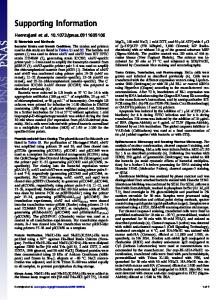
Figure S3. Effects of the siRNA-mediated inhibition of Cl- channel/transporter subtypes expression levels of HER2 proteins in YMB-1 cells. A, B: Protein lysates of si-cont-, ANO1-, si-ClC-3-, si-ClC-7-, and si-CLIC1-transfected YMB-1 cells were probed immunoblotting with anti-HER2 (upper panel) and anti-ACTB (lower panel) antibodies the same filter.
on siby on
0.1
0.2
0.1
E. EBP1
F. MBP-1
0.2
0.4
0.1
0.0
ratio to ACTB
0.0
ratio to ACTB
0.0
0.2
0.0
0.10
0.04
0.02
0.00
ratio to ACTB
0.2
D. STAT3
0.06
ratio to ACTB
0.3
C. AP-2γ
0.05
0.00
G. HDAC6 0.03
ratio to ACTB
0.3
ratio to ACTB
B. AP-2β
ratio to ACTB
A. AP-2α
0.02
0.01
0.00
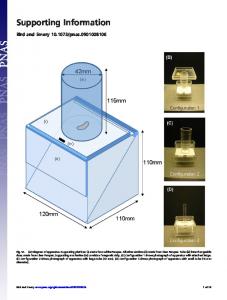
Figure S4. Effects of the treatment with T16-inh-A01 (10 μM) for 48 hr on expression levels of HER2-related transcriptional factor transcripts in YMB-1 cells. A-G: Real-time PCR assay for AP-2α (A), AP-2β (B), AP-2γ (C), STAT3 (D), EBP1 (E), MBP-1 (F), and HDAC6 (G) in vehuicle- and T16-inh-A01-treated YMB-1 cells (n=4 for each). Expression levels were expressed as a ratio to ACTB. Results are expressed as means ± SEM.